Hidden123Gap
- 지표
- 버전: 1.2
- 업데이트됨: 22 11월 2021
- 활성화: 5
Hidden123Gap (123Gap) is universal business tool from the professional traders that helps to visualize market situation. It previews markets using a price action and a sentiment in the market. The tool is necessary to understand the market situation and the anticipation of further movement. Finally, you will see how traders estimate the market.
With this tool, you will see important supports and resistances. It shows you the entry of big players on the market.
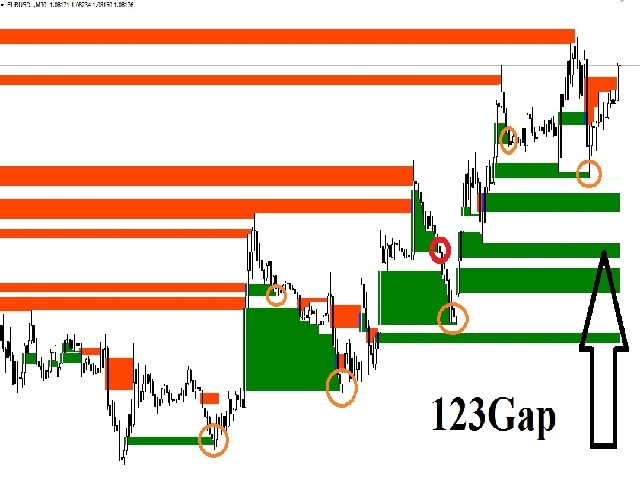
The indicator works on all timeframes. You are not limited by use of different timeframes, the indicator is able to adapt. On the screenshots, you can see different views of 123Gap and entrances to the market. 123Gap contains basic settings. Please keep in mind that the use of more bars for calculation may lead to the program slowdown.
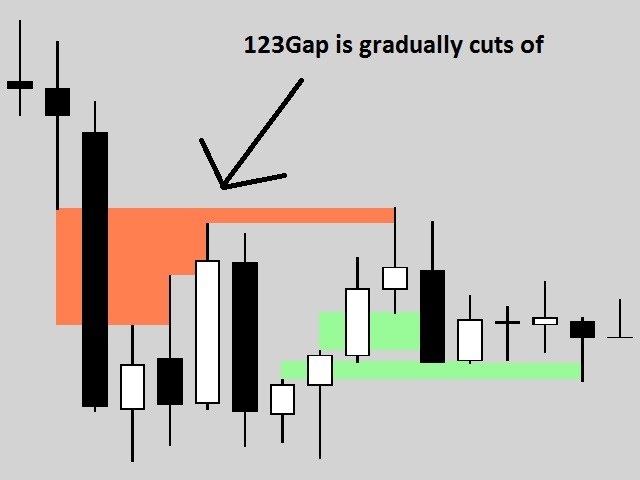
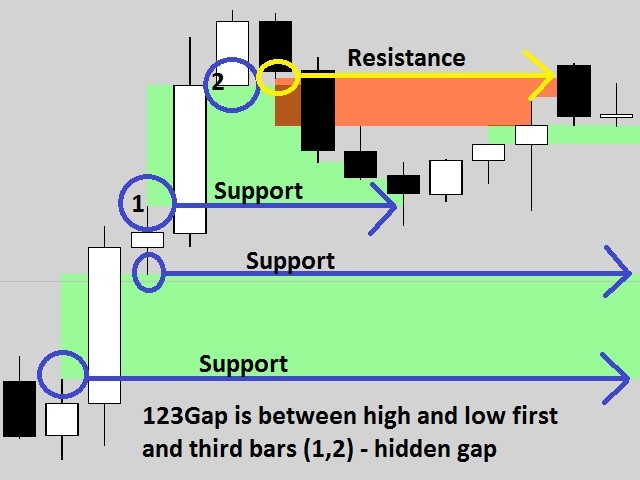
123Gap shows hidden gaps in the market, this gap will be filled in the future. This gives us a very effective S/R.
NOTE: It is possible that the indicator draws wrong! Just go to another chart and back again to the same.
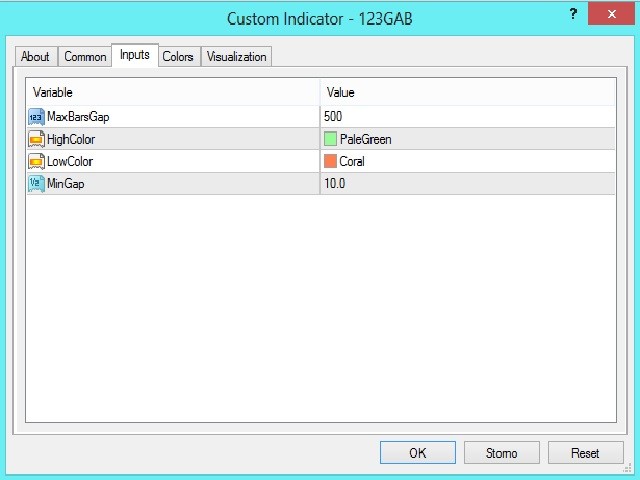
Settings
- MaxBarsGap=500 – indicator shows information 500 bars back
- HighColor – color of high
- LowColor – color of low
- MinGap=10 – you will see gaps with size exceeding 10 points (1 pips)