MT4 DeThrust StatsMood
- 지표
-
Salvatore Colombo
 Trading is not a lottery.
You don't gain by luck and you don't lose by chance. You gain because the probabilities are on your side and you lose because you don't understand that yet. - 버전: 1.2
DeThrust StatsMood — Impulse Exhaustion Detector for D1
DeThrust StatsMood is a MetaTrader 4 indicator optimized for the Daily (D1) timeframe, designed to identify potential exhaustion points following exceptionally strong directional moves in the Forex market.
How it works
The indicator detects when price experiences a statistically abnormal acceleration compared to the symbol’s historical behavior and signals the potential exhaustion of that impulse.
This is not a conventional trend reversal indicator. Its purpose is to identify the final stage of exceptionally extended moves, regardless of their duration.
The detection logic combines three filters:
- Statistical anomaly — price moves beyond the Bollinger Bands, indicating a move outside its historical norm.
- Peak dominance — the high or low of the candidate bar represents the absolute extreme within the defined lookback window.
- Confirmation — a minimum number of subsequent bars confirms the potential change in direction.
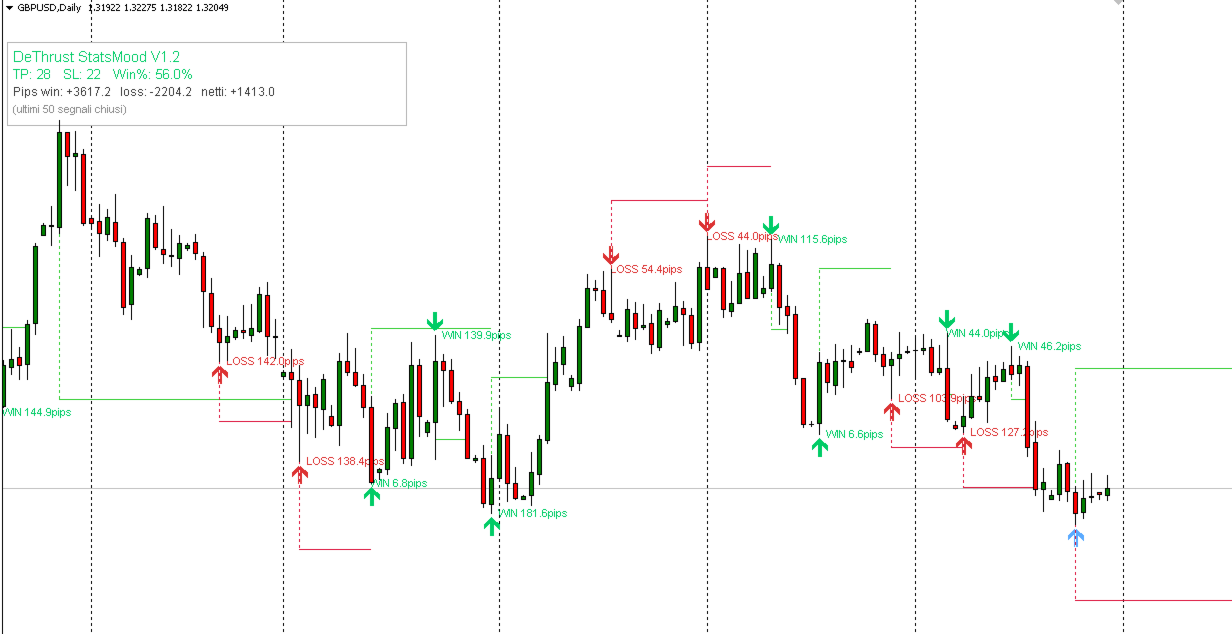
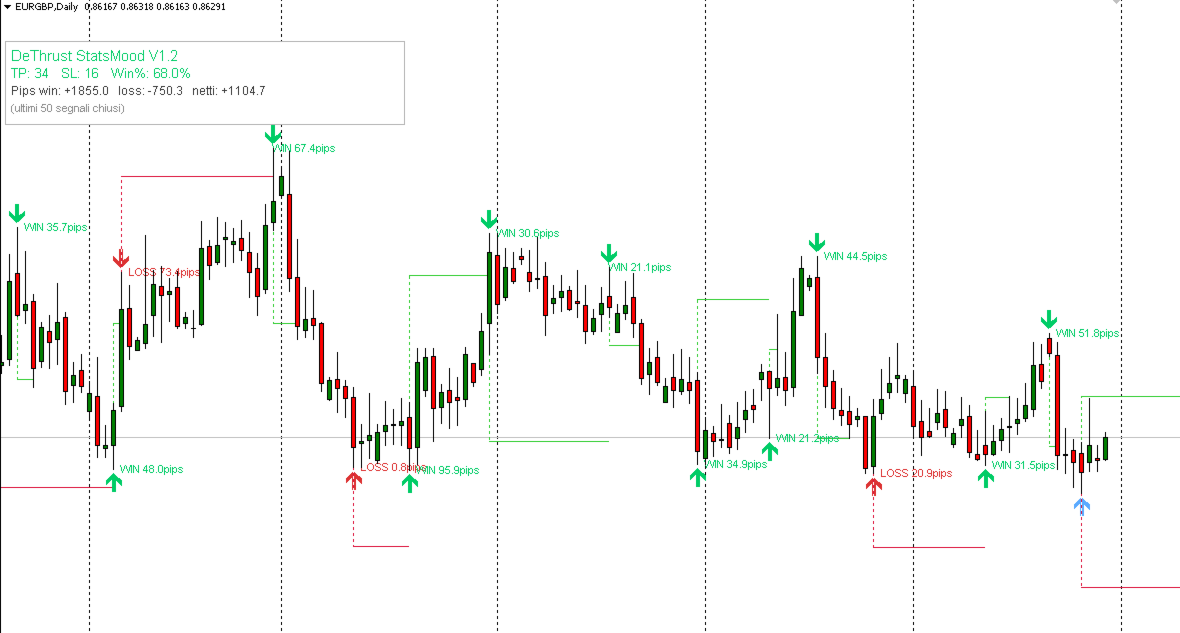
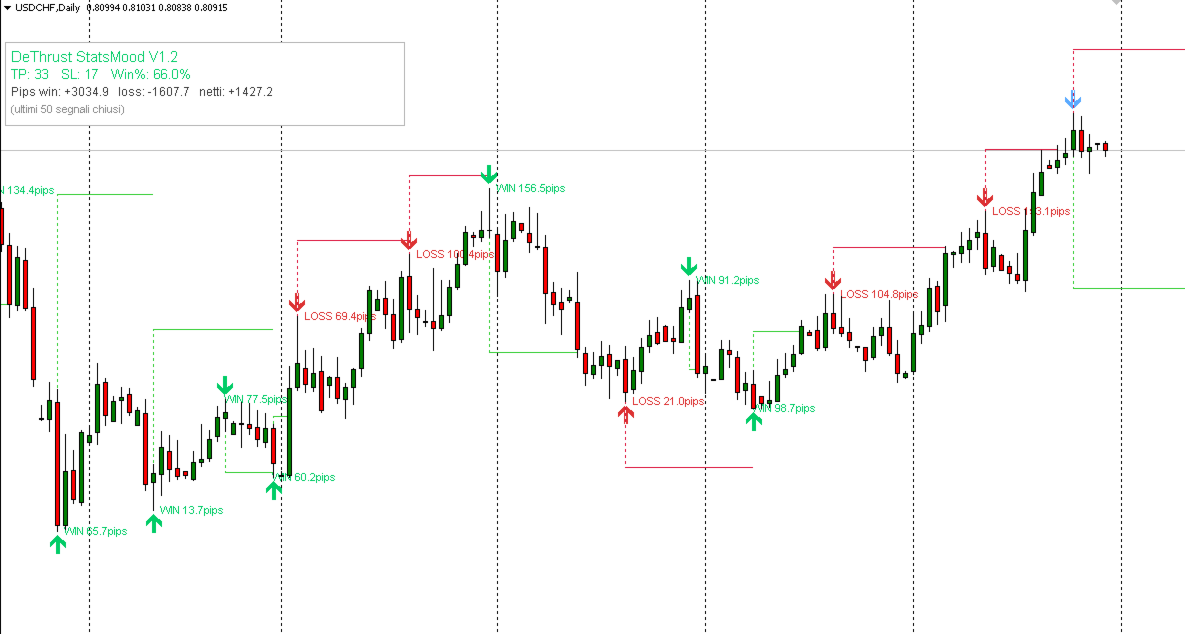
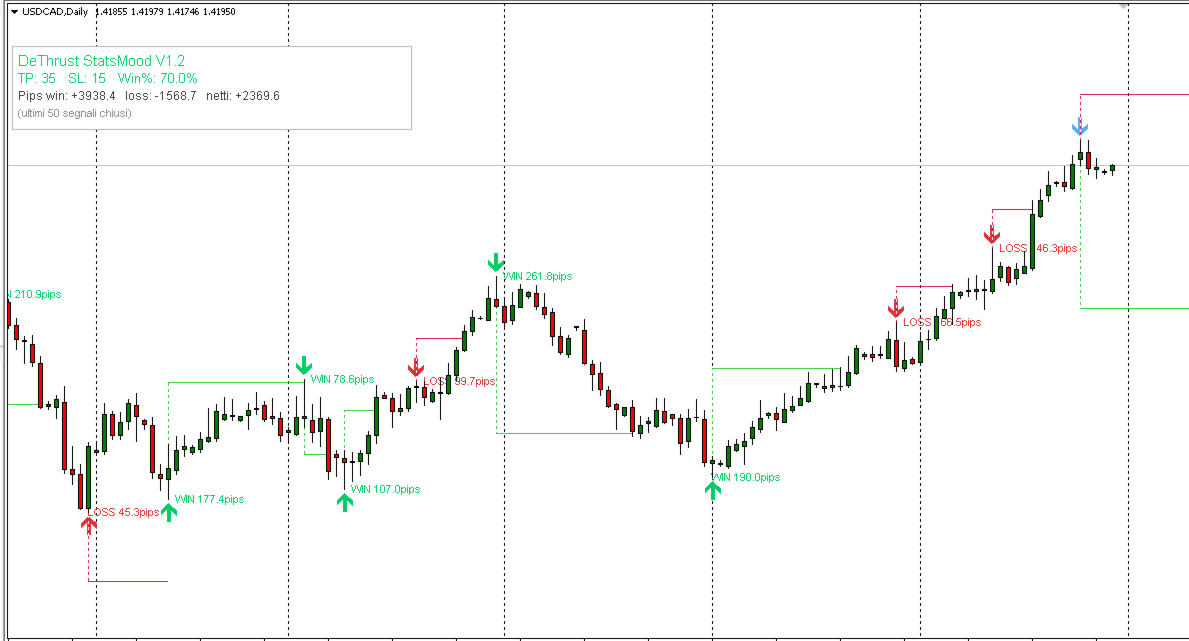
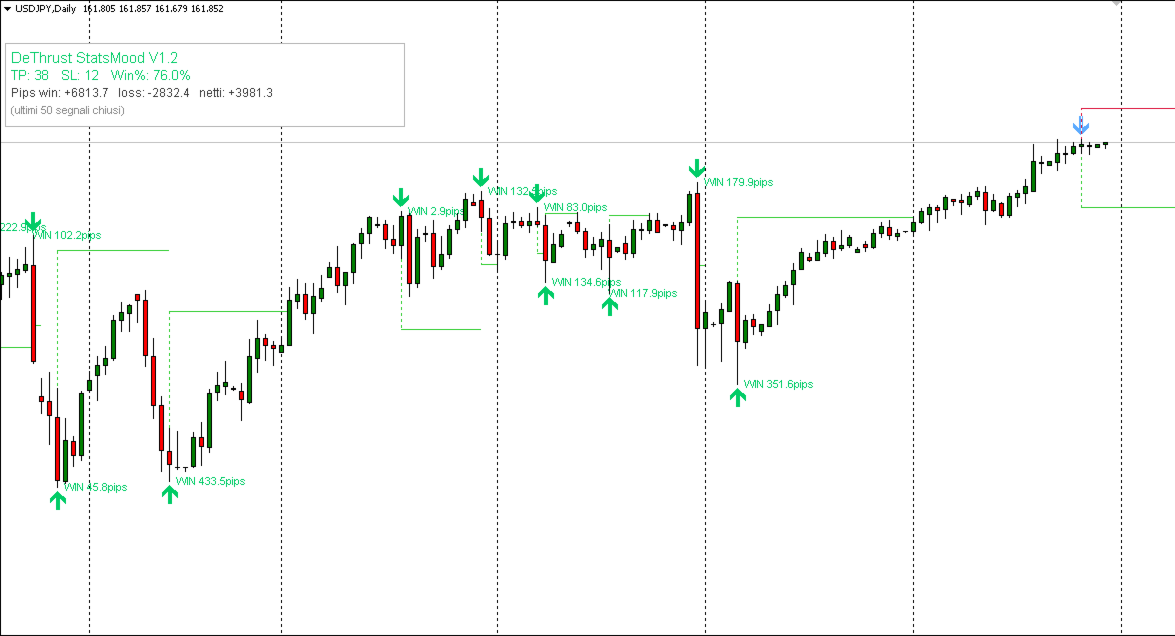
Visual signals
- Green arrow — signal closed in profit (WIN)
- Red arrow — signal closed in loss (LOSS)
- Blue arrow — latest open signal, still active
- Green line — Take Profit level (opposite Bollinger Band)
- Red line — Stop Loss level
- Right-side label — signal result in pips (e.g. “WIN 184.7 pips”)
Take Profit and Stop Loss lines are automatically closed when:
- price touches the level (candle touch, not candle close);
- a new signal in the same direction appears.
Lines associated with signals closed by the appearance of a new arrow may not update graphically in real time. Statistical calculations and pip results remain accurate.
Statistics panel
The top-left panel displays in real time:
- number of TPs and SLs over the most recent closed signals;
- Win percentage (Win%);
- total winning, losing, and net pips.
Main parameters
| Parameter | Default | Description |
| BBPeriod | 20 | Bollinger Bands period |
| BBDev | 1.0 | Bollinger Bands standard deviation |
| PeakWindow | 3 | Peak dominance window |
| ConfirmWindow | 3 | Confirmation bars window |
| MinConfirmBars | 1 | Minimum number of confirmation bars |
| SLBufferATR | 1.50 | Stop Loss distance in ATR multiples |
| StatsCount | 50 | Number of signals used in the statistics panel |
Notes
- The indicator is optimized for the Daily (D1) timeframe. Results on other timeframes may vary.
- Pips are calculated from the close of the signal candle.
- Some lines related to signals closed by the appearance of a new signal may not update graphically in real time. Statistical calculations remain correct.