Bull bear pressure indicator
- 지표
- 버전: 1.20
- 업데이트됨: 22 9월 2022
- 활성화: 5

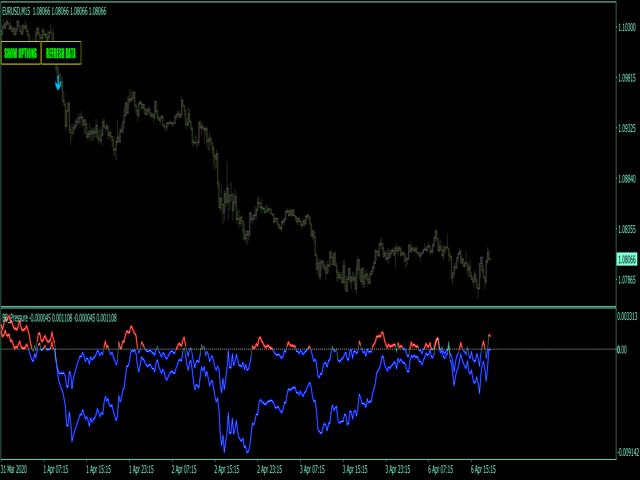
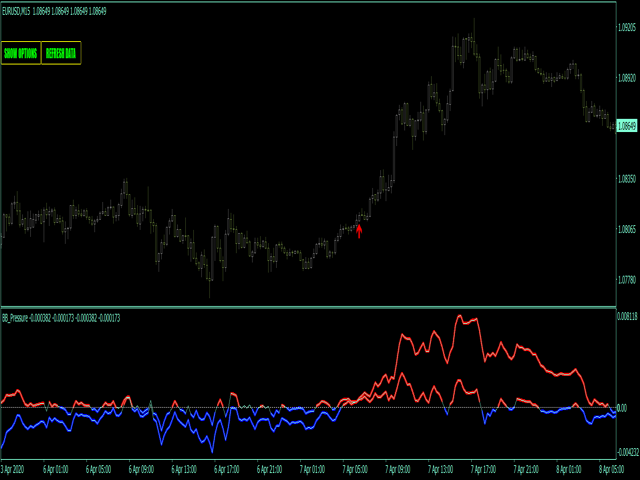
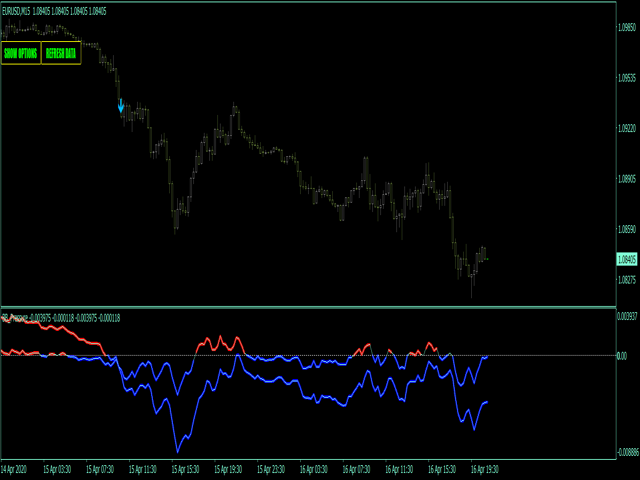
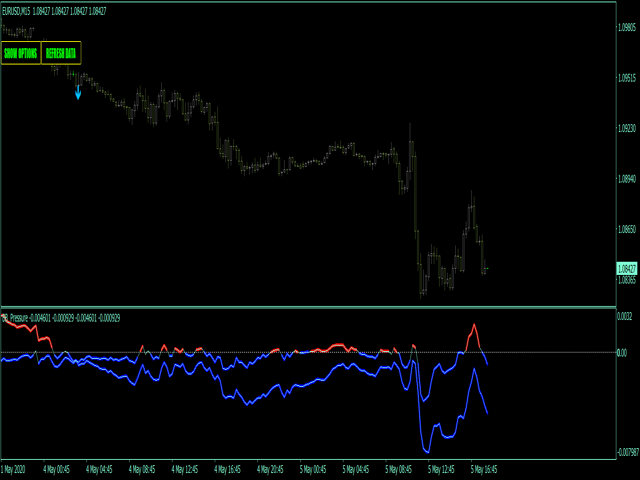
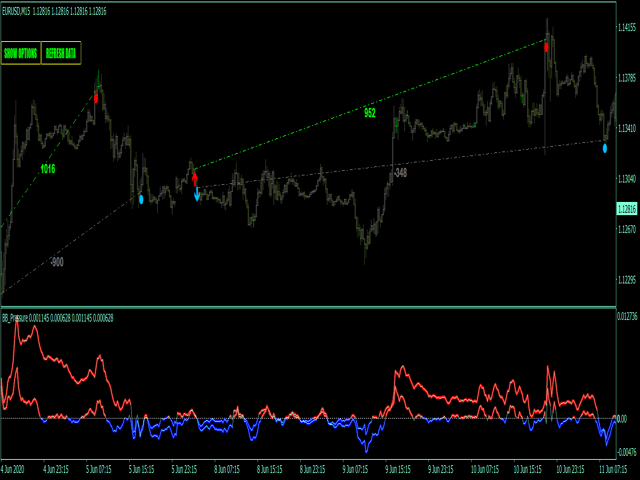
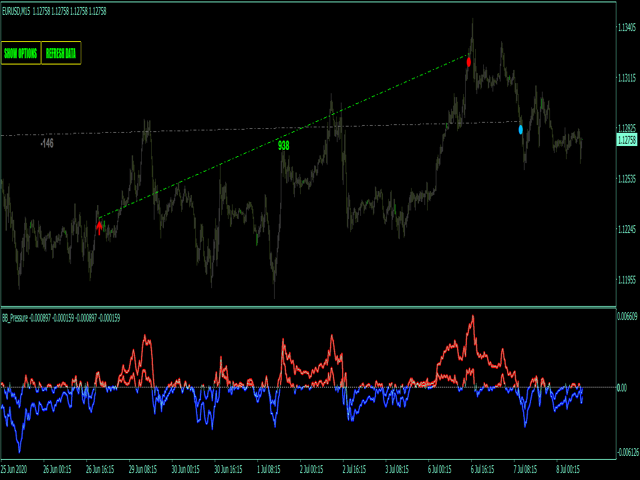
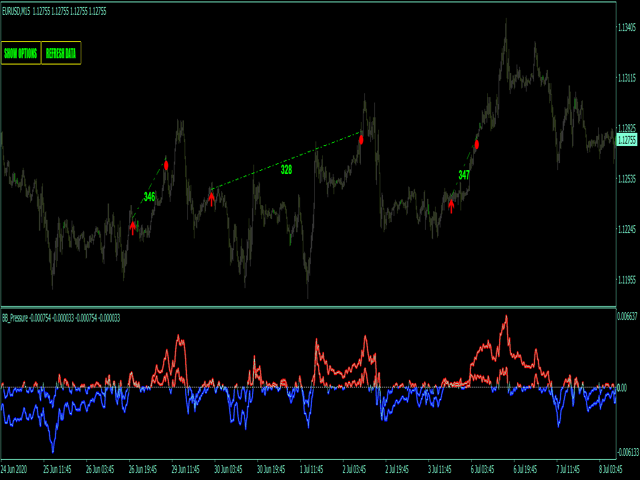
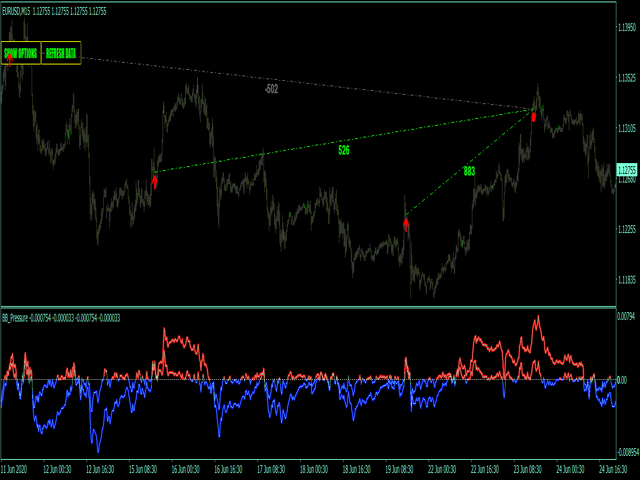
Bull bear pressure indicator - is the manual system which defines bull/bear market. When lines is above zero level - market is strong bullish, and when lines below zero level - market is bearish. First line represents global trend and second one are smoothed and shows local market's mood.
Main inputs are :
- MainPeriod- main indicator's period for global trend calculation;
- SignalPeriod - period for smoothed and shows local market's trend;
Main Indicator's Features
- Signals are not repaint,non-late or disappear(exept cases when system recalculates all history datas,refreshing main settings or Metatrader refreshes new incomming datas);
- Every signal comes at the open of new bar(system uses only confirmed signals);
- Indicator has Alerts, Mail and Push notifications(allow to trade out of PC, from smartphone/mobile app);
- Possible to disable arrow strategy and use only indicator.
Recommendations for trading
- Scalping timeframes: M5-H1 range;
- Volatility pairs like EURUSD, GBPUSD, USDCAD, USDJPY, NZDUSD, AUDUSD, GOLD, Crypto;