Bull bear pressure indicator
- Indicadores
- Versión: 1.20
- Actualizado: 22 septiembre 2022
- Activaciones: 5

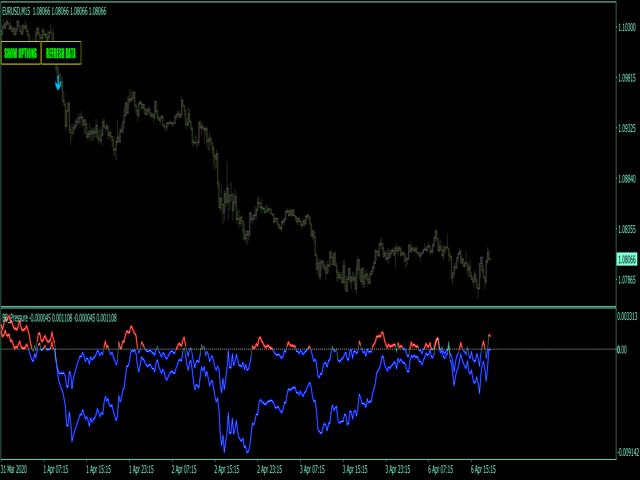
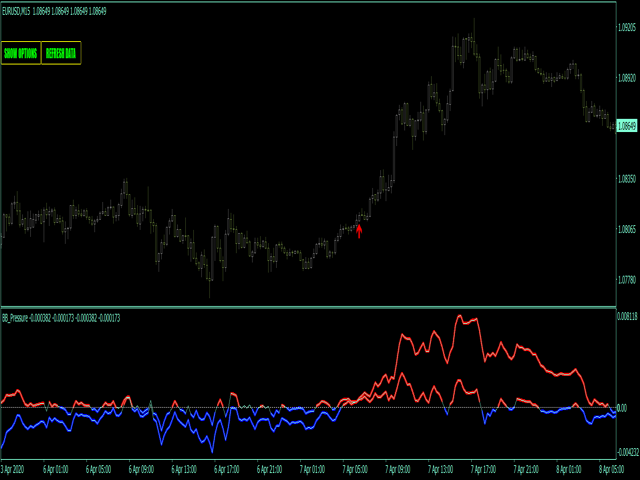
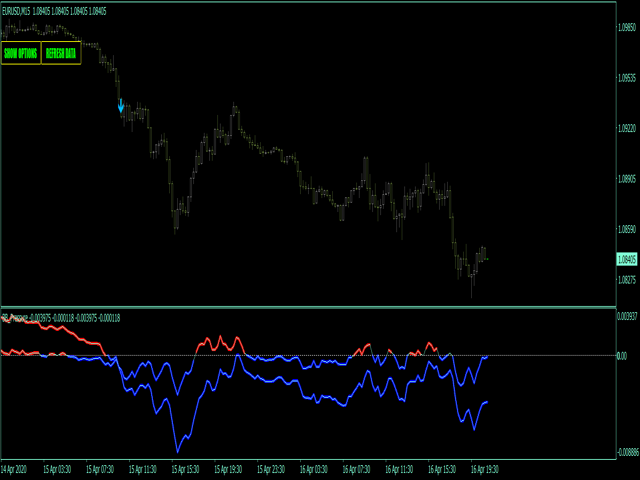
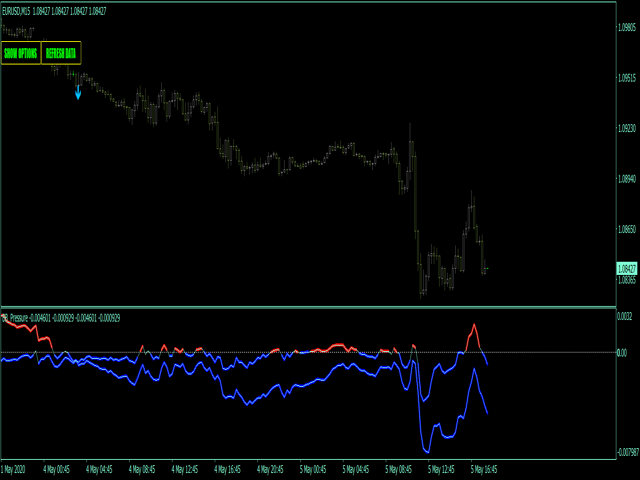
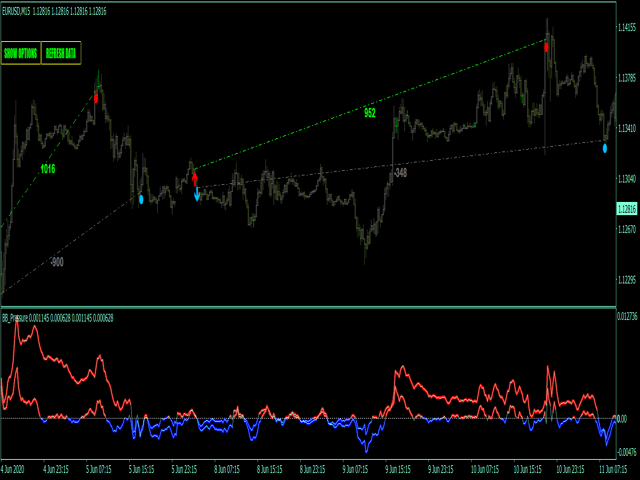
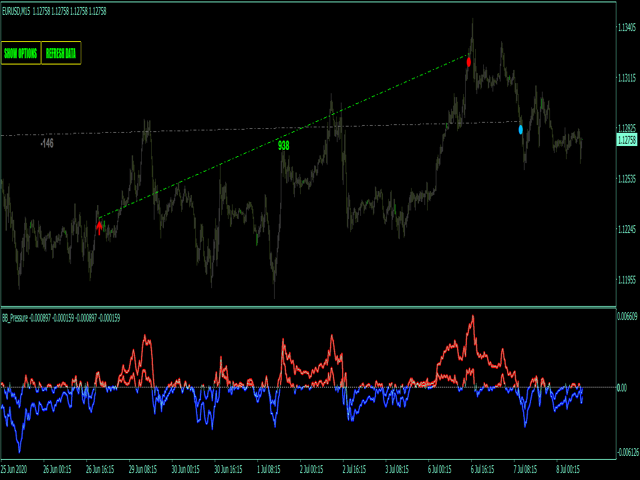
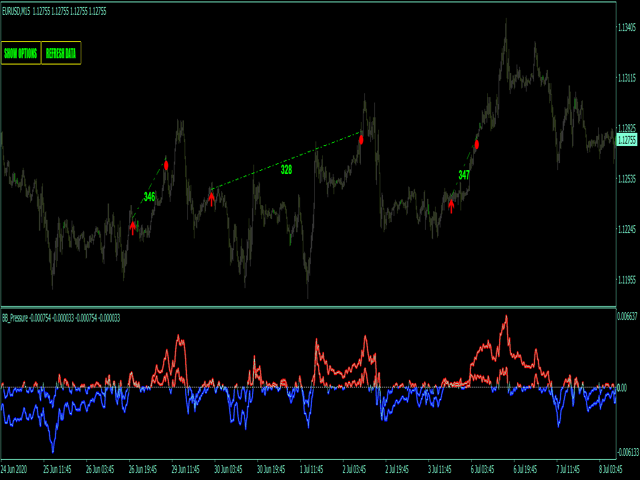
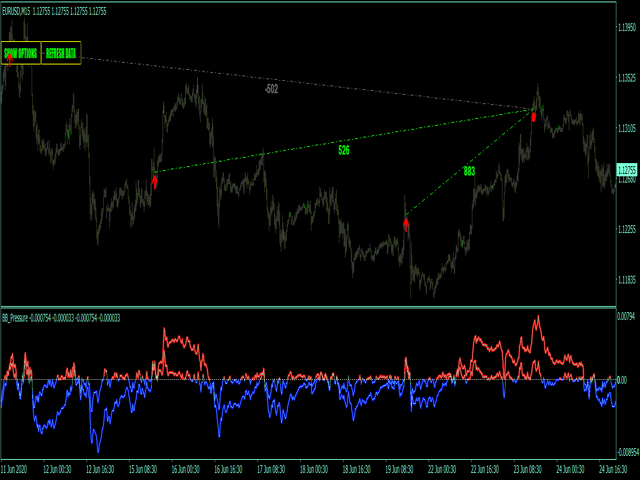
Indicador de presión alcista/bajista - es el sistema manual que define el mercado alcista/bajista. Cuando las líneas están por encima del nivel cero, el mercado es fuertemente alcista, y cuando las líneas están por debajo del nivel cero, el mercado es bajista. La primera línea representa la tendencia global y la segunda está suavizada y muestra el estado de ánimo del mercado local.
Las entradas principales son :
- MainPeriod- periodo del indicador principal para el cálculo de la tendencia global;
- SignalPeriod - periodo para suavizar y mostrar la tendencia del mercado local;
Características del indicador principal
- Las señales no se repintan, no se retrasan ni desaparecen (excepto en los casos en que el sistema recalcula todos los datos históricos, actualiza la configuración principal o Metatrader actualiza los nuevos datos entrantes);
- Cada señal viene en la apertura de la nueva barra (el sistema utiliza sólo las señales confirmadas);
- Indicador tiene alertas, correo electrónico y notificaciones Push (permiten el comercio fuera de la PC, desde el teléfono inteligente / aplicación móvil);
- Posibilidad de desactivar la estrategia de flecha y utilizar sólo el indicador.
Recomendaciones para el comercio
- Scalping marcos de tiempo: Rango M5-H1;
- Pares de volatilidad como EURUSD, GBPUSD, USDCAD, USDJPY, NZDUSD, AUDUSD, GOLD, Crypto;