Acceleration Force Meter Indicator
- 지표
- 버전: 4.10
- 업데이트됨: 22 9월 2022
- 활성화: 5

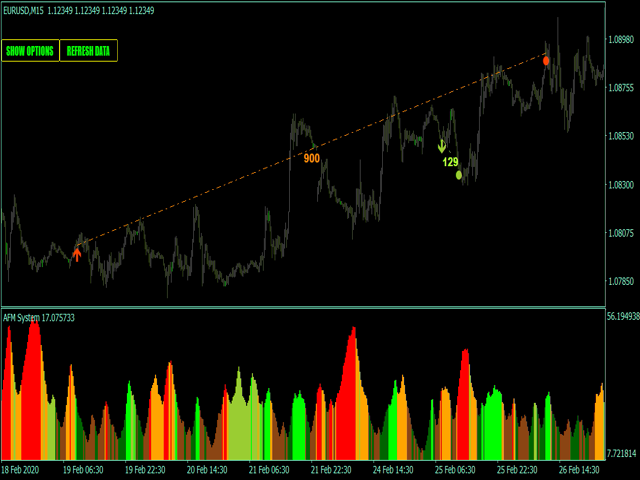
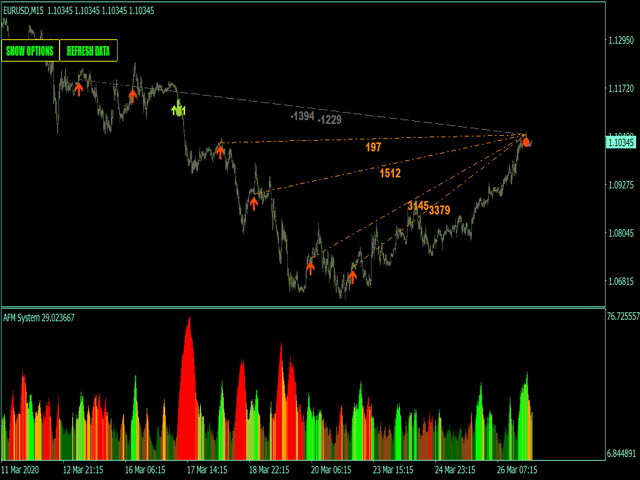
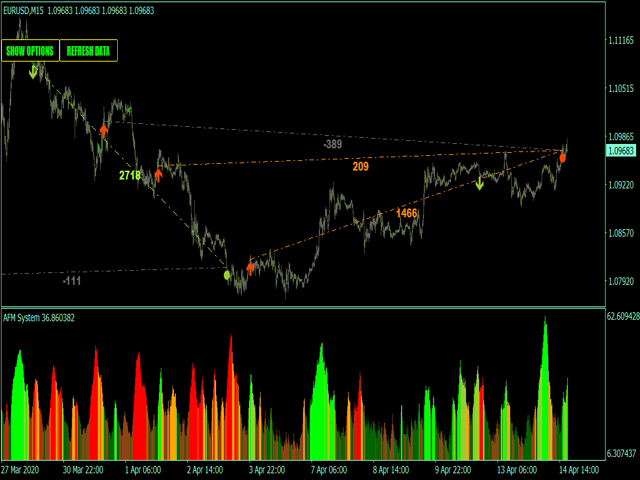
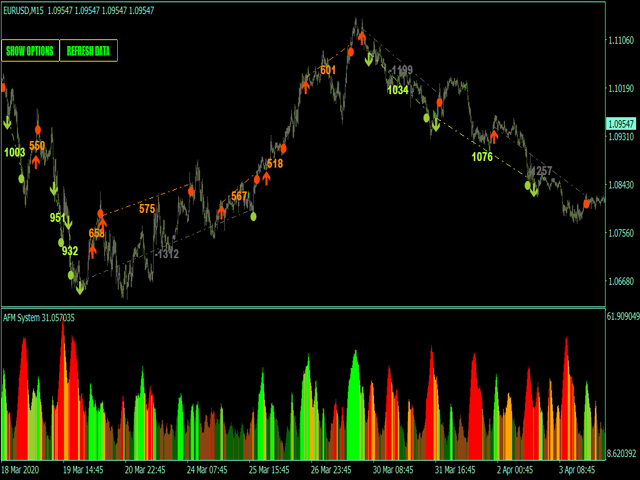
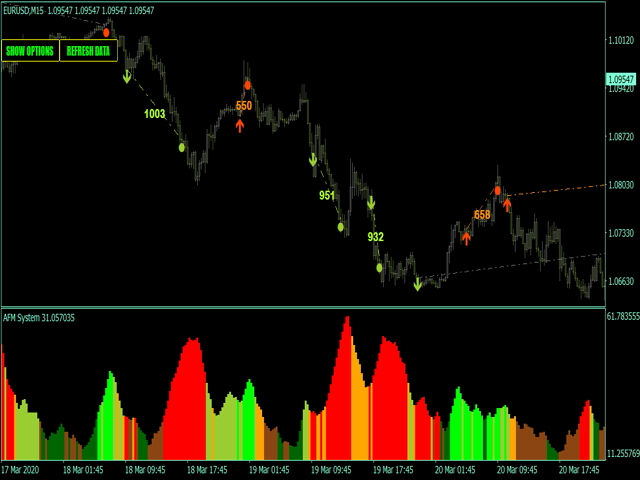
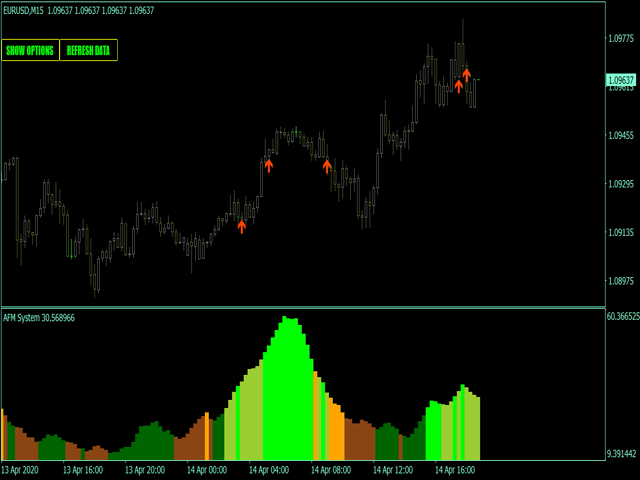
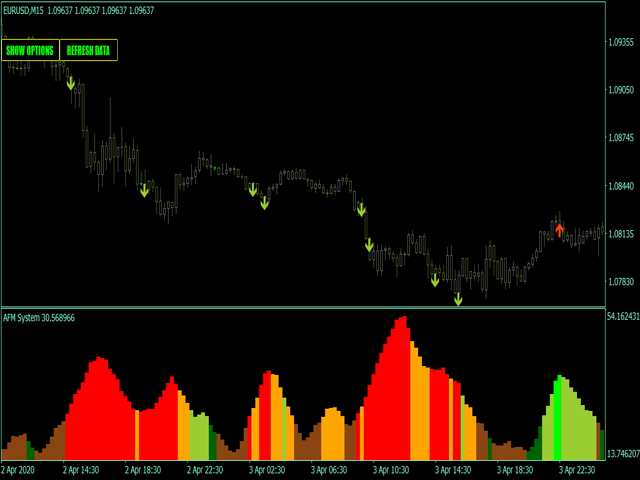
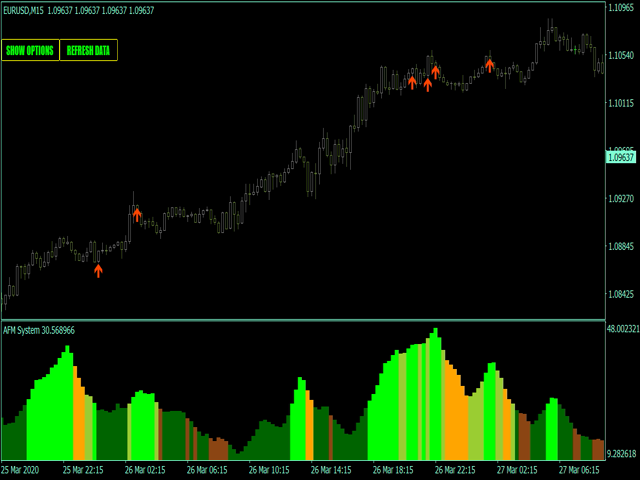
Acceleration Force Meter Indicator - is a trend system that join market in trend phase and after trend pull-back. AFM indicator - is the system that watchs market phases from flat to extreme volatility and prefers to enter in market when it's active, more volatility, ignoring most flat places.
This is 100% complete trading system including enter and exit points. It works well with profitable trades - maximizing take profit targets(analysis of recent market volatility, its pips range to adapt current profit targets), also it works with loosings choosing most suitable exit point with minimal loss. Just have a bit patience and system possibly will make you happy.
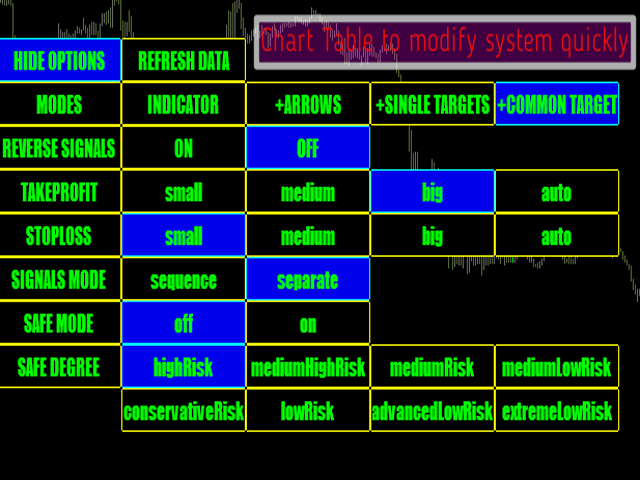
Main Indicator's Features
- Signals are not repaint,non-late or disappear;
- Every signal comes at the open of new bar(system uses only confirmed signals);
- Indicator has Alerts, Mail and Push notifications(allow to trade out of PC, from smartphone/mobile app);
- System is 100% autoadaptive no need manual adjusting. Just set up and start trading.
Recommendations for trading
- 5-60 min timeframes is the best choice;
- Volatility / Trend pairs(EURUSD,GBPUSD,USDCHF,GBPJPY etc..) with small swaps, Gold and Crypto markets;