High Low indicator for MT4
- 지표
-
Renaud Herve Francois Candel
 ITC SOFTWARE is a technology company based in the United States since 2010.
🟠🔴 The company develops financial software and indicators for different trading platforms:
-Metatrader 4 and Metatrader 5
-TradingView
-NinjaTrader - 버전: 1.70
- 업데이트됨: 2 7월 2023
- 활성화: 5
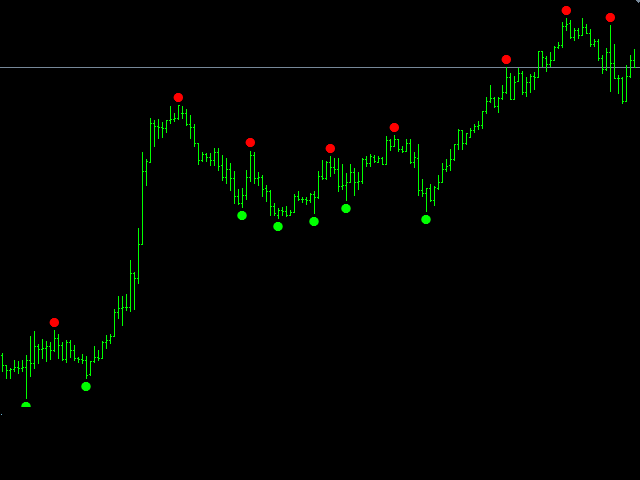
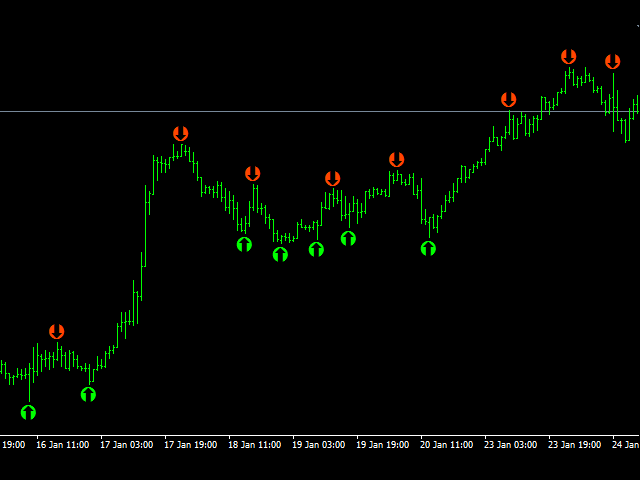
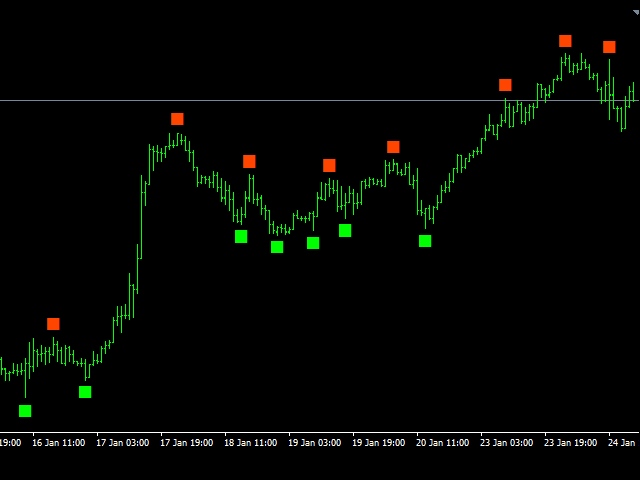
HighLow Arrow Indicator
HighLow Arrow is a simple indicator to be used to signal major lows and major highs in your chart.
This indicator is not intended to be used to trade alone but more as an alert that a turning point might be forming.
In this case the HighLow Arrow indicator signals that a new high or a new low is forming and that traders can prepare for seeking new signals.
The formation of the High or the Low is confirmed after 2 bars have been closed. In the meantime, the alert can be cancelled at any time.
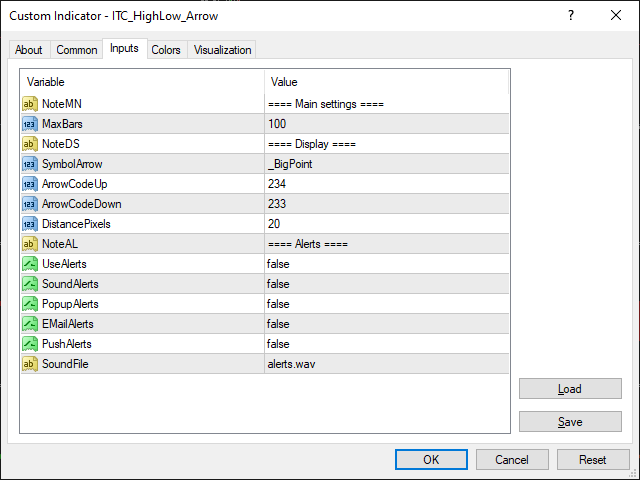
Inputs of the indicator are:
- MaxBars: number of bars to be calculated by the indicator
- SymbolArrow: choice of symbol to be used to display the arrows
- ArrowCodeUp: char code of Windings font to display Up arrow (Please select the _Custom in the SymbolArrow drop down list to use this char code)
- ArrowCodeDown: char code of Windings font to display Down arrow (Please select the _Custom in the SymbolArrow drop down list to use this char code)
- Distance: distance between arrow and candle
- UseAlerts (true/false): generate alerts (at the close of the bar). It is required to set this value to true if you want to receive alerts.
- PopupAlerts (true/false): to enable alerts of type Popup window
- EmailAlerts (true/false): to enable alerts of type Email
- PushAlerts (true/false): to enable alerts of type Push Notification
- SoundAlerts (true/false): to enable alerts of type Sound
- SoundFile: file to be used for sound alerts
It can be used with any class of assets: Forex, Stocks, Indices, Futures, Commodities and Cryptos.
Other indicators for MT4:
We developed more than 60 indicators and utilities for Metatrader 4 and Metatrader 5.
Indicators for MT5:
All our indicator are developed both for MT4 and MT5.
List of all our indicators:
👉 You can get the complete list of our indicators visiting our profile page.

Very good indicator for reversals. Just have to be patient and wait for confirmation. Author is very responsive to any questions.