FX Sniper Yellow indicator for MT4
- 지표
-
Renaud Herve Francois Candel
 ITC SOFTWARE is a technology company based in the United States since 2010.
🟠🔴 The company develops financial software and indicators for different trading platforms:
-Metatrader 4 and Metatrader 5
-TradingView
-NinjaTrader - 버전: 1.50
- 업데이트됨: 2 7월 2023
- 활성화: 5
FX Sniper Yellow Indicator
FX Sniper Yellow is an exclusive leading indicator to trade Forex with your Metatrader trading platform.
FX Sniper Yellow is able to analyze market participants behavior and to predict changes in the price direction even before movement starts.
Most indicators are lagging indicators and are useless. FX Sniper Yellow is a unique leading indicator.
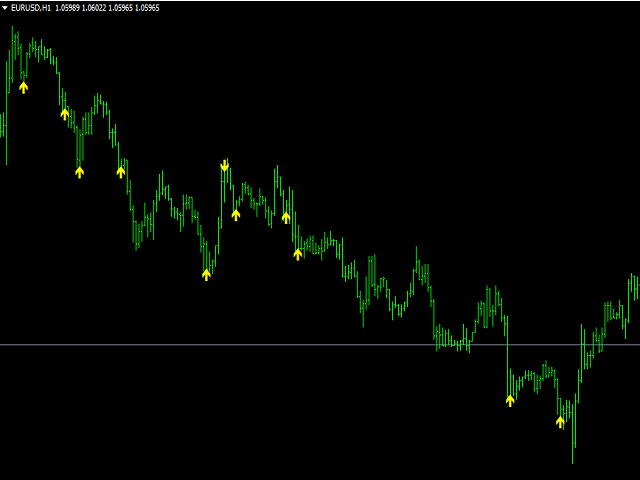
The indicator displays arrows in your chart (please see screenshot attached) showing the probable direction of price action.
FX Sniper Yellow never repaints. Once candle is closed signal is confirmed and arrow will never disappear.
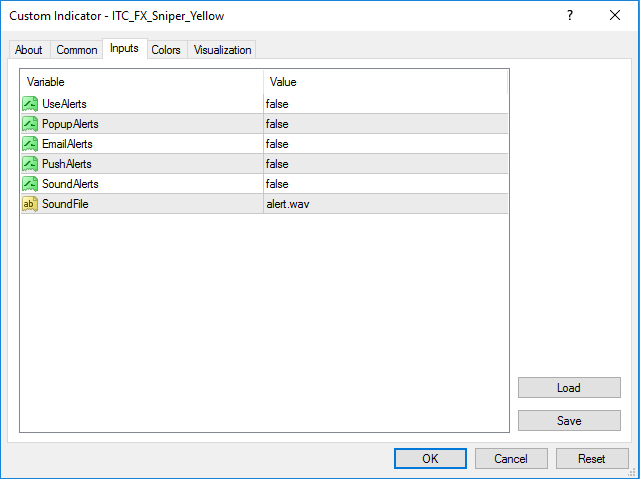
Inputs of the indicator are:
- UseAlerts (true/false): to enable alerts
- PopAlerts (true/false): to enable alerts of type Popup window
- EmailAlerts (true/false): to enable alerts of type Email
- PushAlerts (true/false): to enable alerts of type Push Notification
- SoundAlerts (true/false) to enable alerts of type Sound
- SoundFile: file to be used for sound alerts
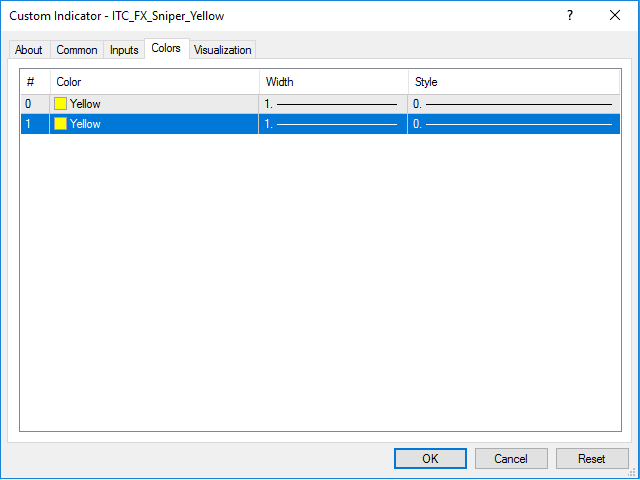
Size and color of the arrows can be setup in the Color tab of the indicator.
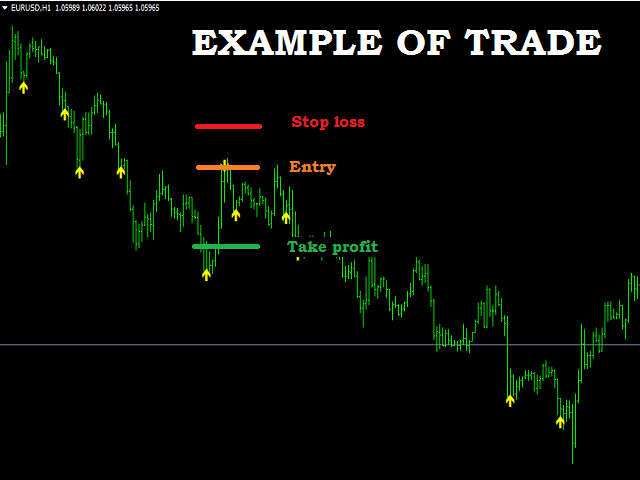
Trading rules:
- Enter trade at opening of next candle in the direction of the signal (SELL/BUY)
- Place stop at the top (SELL) or bottom (BUY) of the signal candle or use stop based on ATR
- Take profit with reward / risk of 2:1 or 3:1
- You can filter entry signals to only go with the trend. We recommend therefore to use Trend Direction UD Indicator
- Filtering signals with the trend is optional. This is not mandatory.
The indicator can be used with any time frame.
It can be used to trade Forex, Stocks, Indices, Futures and Cryptos.
Other indicators for MT4:
We developed more than 60 indicators and utilities for Metatrader 4 and Metatrader 5.
Indicators for MT5:
All our indicator are developed both for MT4 and MT5.
List of all our indicators:
👉 You can get the complete list of our indicators visiting our profile page.