Smart Channel 5
- 지표
-
Zhou Bing
 Programmer focused on simplicity and usability. I learned to think algorithmically thanks to MQL. I am creating and modifying code according to my trader friend's needs and requests. And we decided to share some of these with You!
 - 버전: 1.0
- 활성화: 5
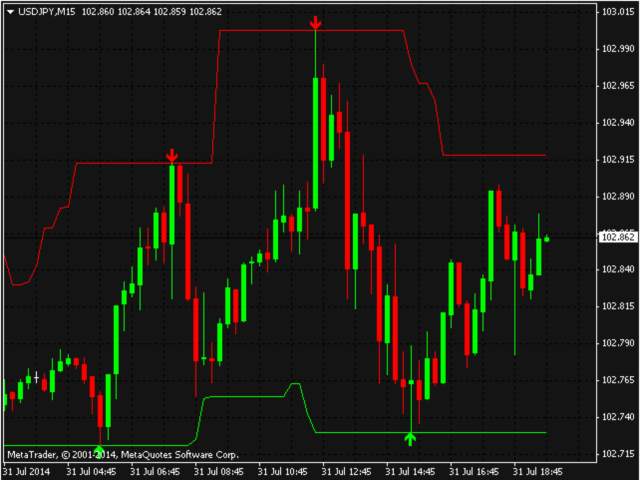
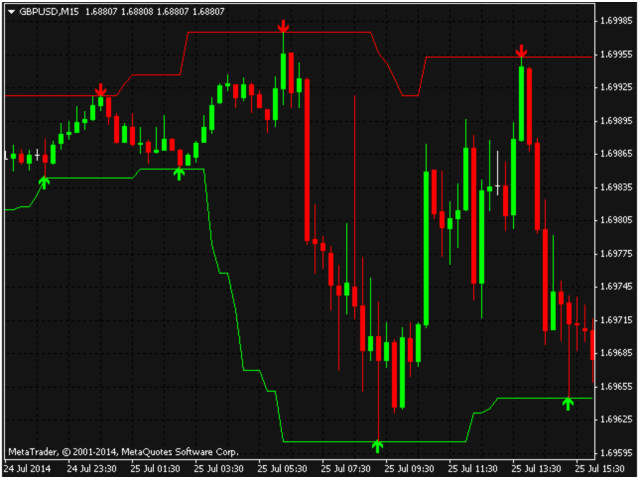
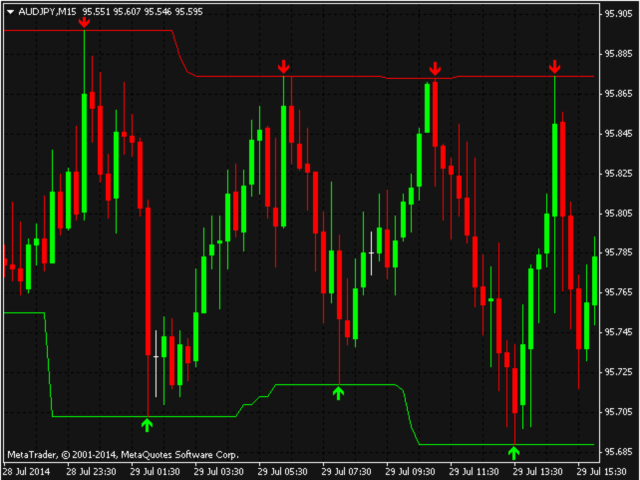
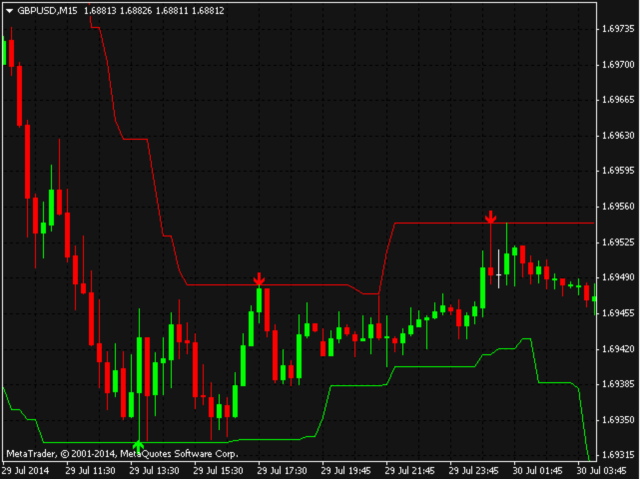
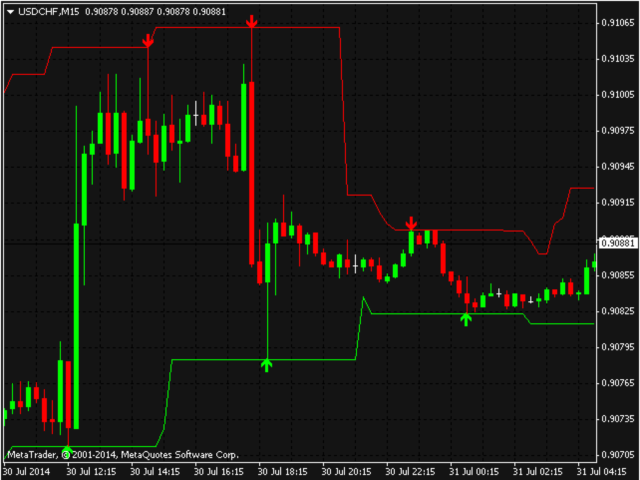
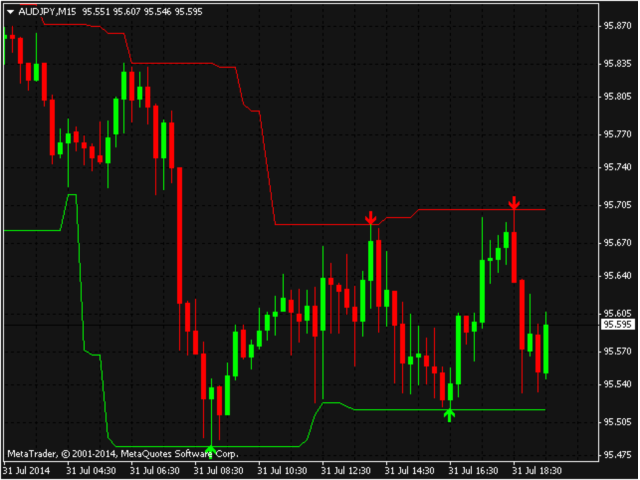
This simple, yet powerful indicator is very good way to determine actual S/R levels. It's main purpose is making your overview on markets much better.It has built-in arrow signal system, which should be used along with MT indicators for best results.Just try it.
Recommended MT indicators to use along:
- Bollinger Bands (default)
- RSI (period 3, levels 10/90)