Gap MT5
- 지표
-
Dmitry Fedoseev
 Новый вариант эксперта exp_iCustom - exp_iCustomNew в маркете: https://www.mql5.com/ru/market/product/5660
 - 버전: 1.1
- 활성화: 5
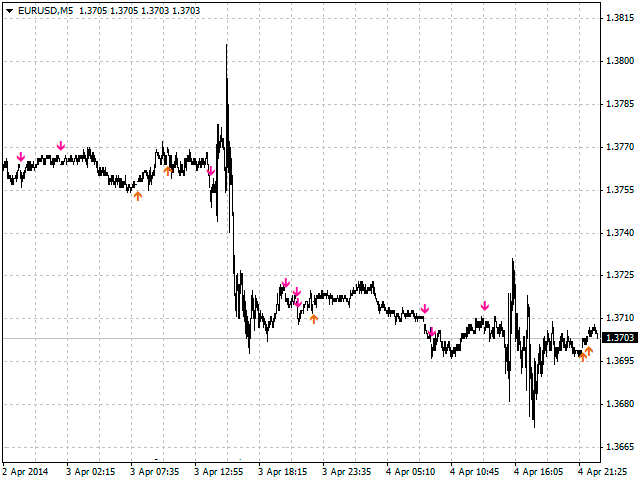
Gap indicator (pattern #23) from Encyclopedia of Chart Patterns by Thomas N. Bulkowski.
Parameters:
- Alerts - show alert when an arrow appears
- Push - send a push notification when an arrow appears (requires configuration in the terminal)
- GapSize - minimum gap size in points
- ArrowType - a symbol from 1 to 17
- ArrowVShift - vertical shift of arrows in pixels
- Auto5Digits - automatic multiplication of GapSize by 10 when working with 5 and 3 digit quotes.
Note. Arrows appear at the opening of a new bar based on analysis of formed bars and do not disappear.
It cannot be guaranteed that the indicator recognizes the patterns exactly as implied by the author.
Recommended optimization parameters: PeriodBars.