Asynchronous Trend
- 지표
- 버전: 1.0
- 활성화: 5

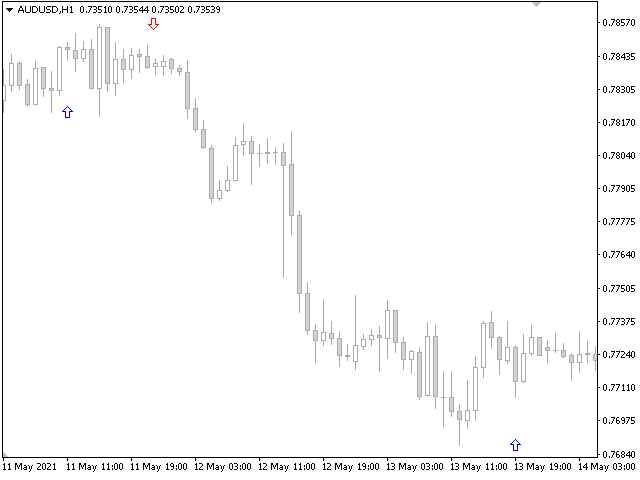
Asynchronous Trend - this will be the final signal that an uptrend or downtrend has begun or has exhausted itself. This is a great addition to any strategy. Trading based on trend indicators is the simplest and often the most effective. The tool does not take up much space on the chart and does not overload the terminal. You can find many different versions of this tool on the internet, but one of the most effective is the no-redraw version, which you can buy here. The indicator allows you to track a steady price movement in a certain direction.
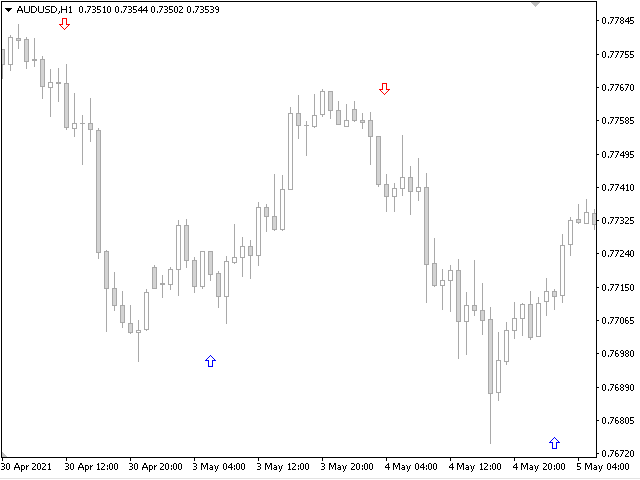
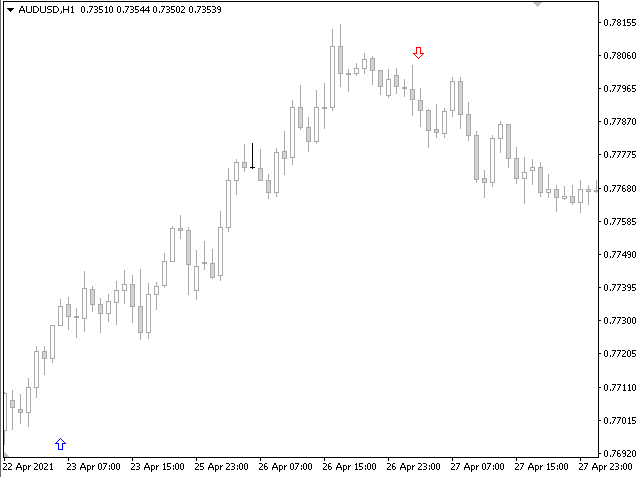
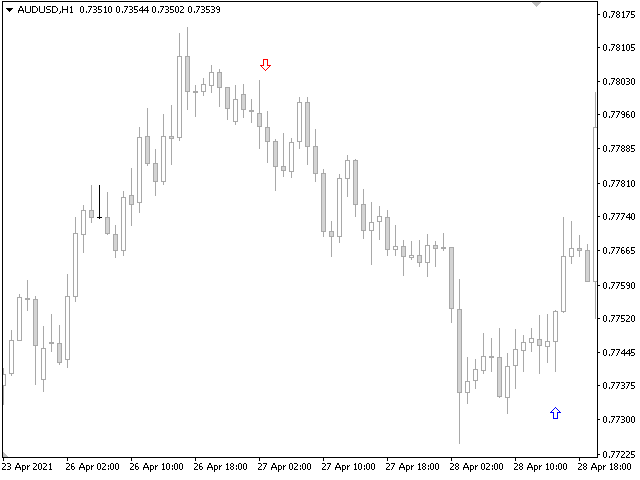
Please note that the line moves quite smoothly, without sharp jumps and fluctuations. Asynchronous Trend removes market noise and provides an objective picture of the market.
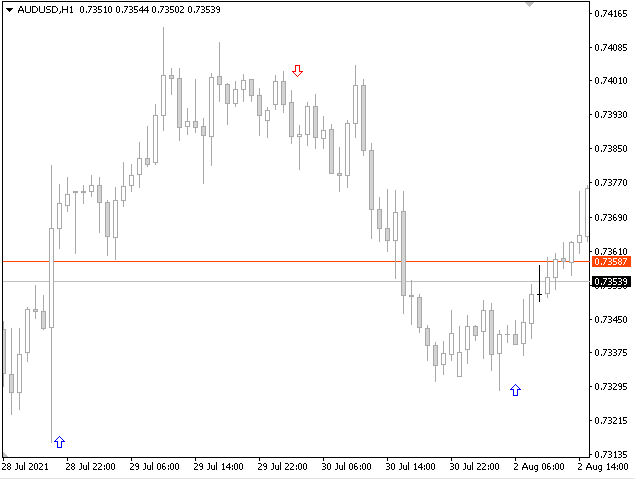
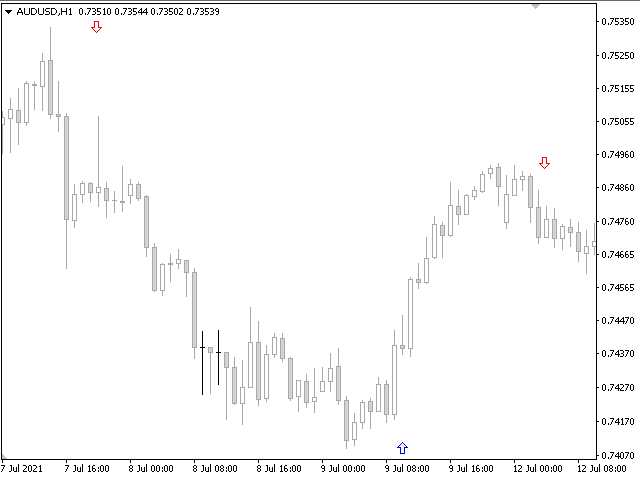
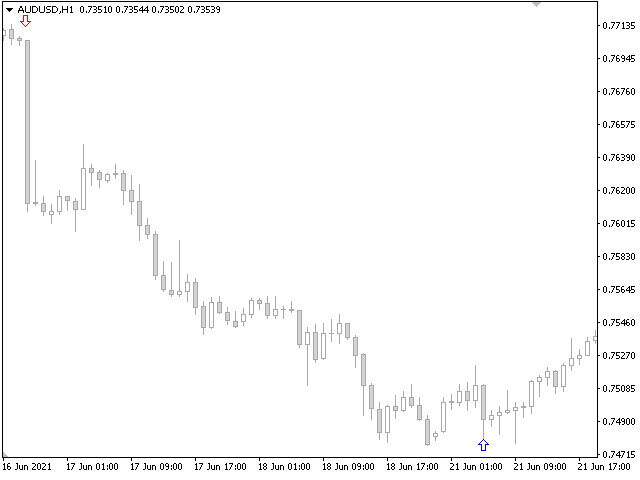
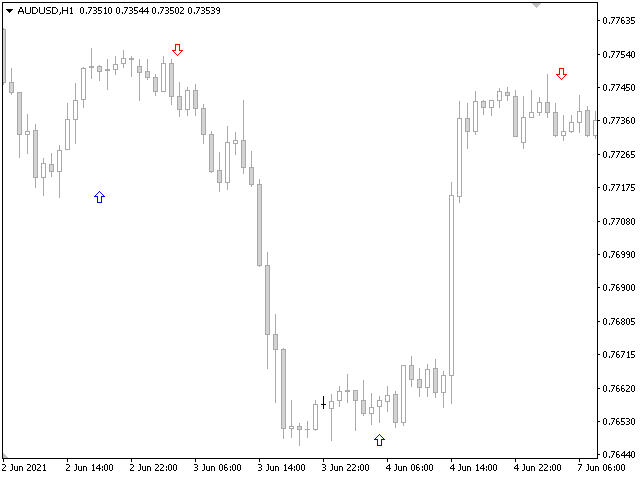
In this case, the movement itself can be downward, upward or sideways, when the market movement does not have a pronounced direction. Using the signal search algorithm, the indicator generates signals in the form of arrows. Flexible settings allow you to receive more accurate signals for opening positions. You can quickly understand what kind of trend is currently developing in the market. If you correctly identify the beginning of a trend, the result of the transaction is usually positive. If you use a live binary options chart as a base, the chances of success are even higher.