BazeZone
- 지표
-
Stefan Van Dockum
 I'm a full time IT teacher on a university. In my spare time I daytrade using various kinds of tools. Now and then I code some indicators/EA's and recently begun to release them for the public in the market.
 - 버전: 1.0
- 활성화: 5
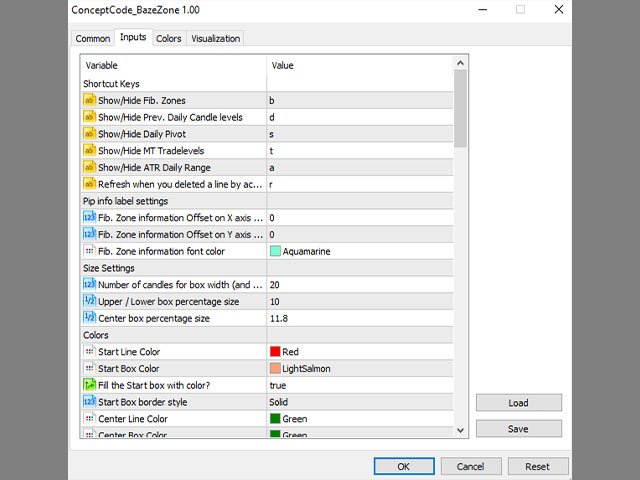
Baze Zone is a configurable combination of tools/levels (MT4 version also available at MT4 section):
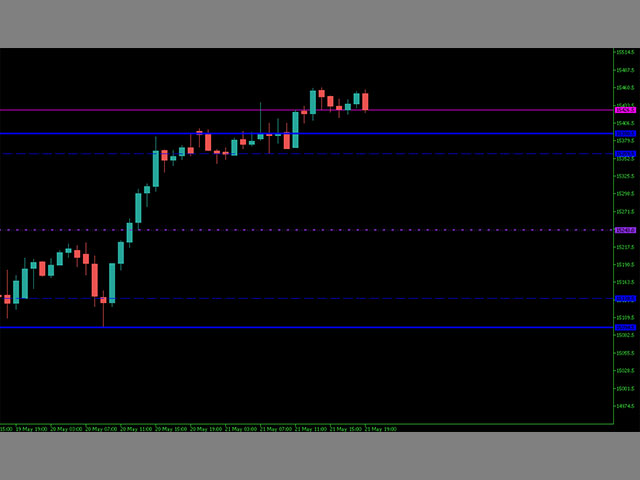
- Fib levels, 14, 23,50
- Fib Extension 27,61
- Pivot Points
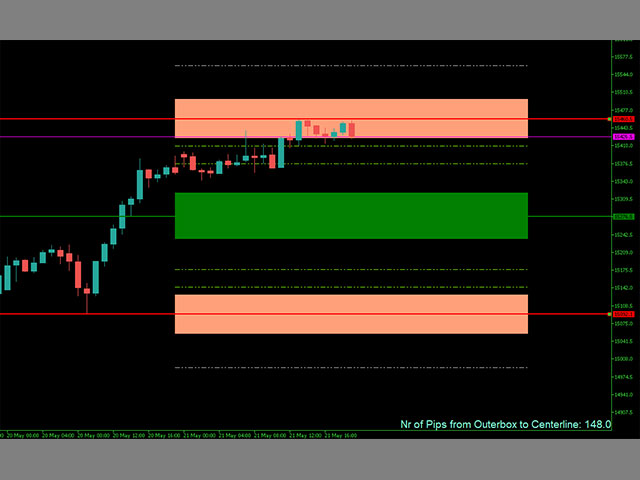
- Adds boxes to indicate range 'breakout'
- ATR Range
- Prev Daily Candle Range
- Shortcut keys to hide/show the lines (configurable)
In short, use this tool to add some extra zones to you fib tool. And use the extra's in combination with the shortcut keys to keep your chart clean.
You can drag the lines for the Fib Levels.
The name of the tool comes from one of the character of your favorite SciFi movies.. and also refers to some 'base'/fundamental levels.