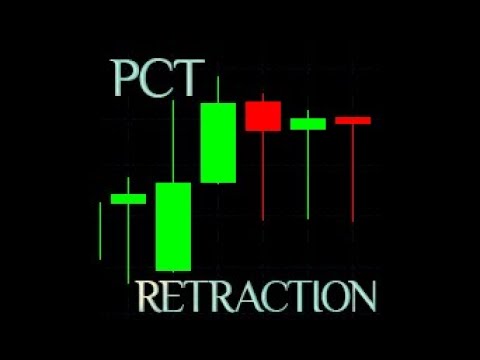
Pct Retraction Indicador de Retracao MT5
- 지표
- 버전: 1.9
- 업데이트됨: 19 8월 2022
- 활성화: 5

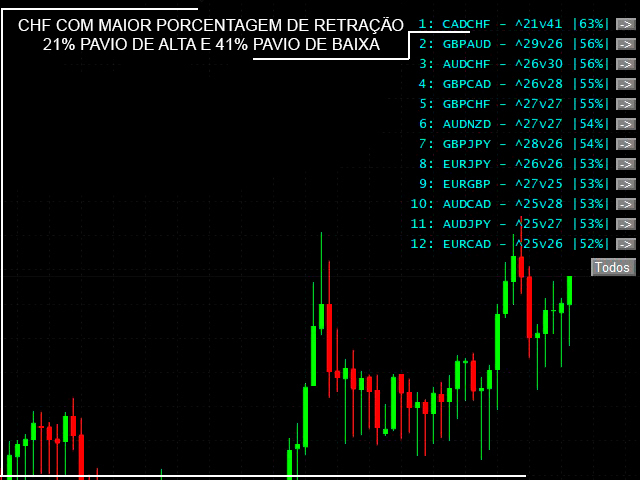
Developed to assist in binary options retracement operations, this indicator will show the assets with the best retracement percentages!
How it works:
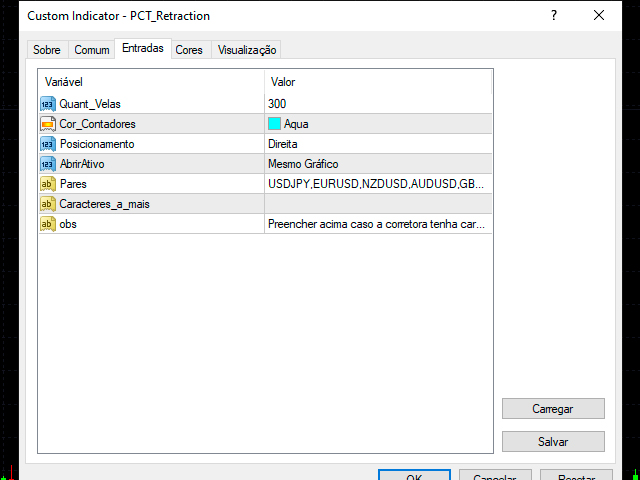
The indicator will calculate the total length of each candle from low to high, the total of the body and total of shadows (up and down) and calculate a total shadows percentage of various configurable assets. The counter is updated with each new candle.
ATENTION: Demo on the estrategy tester is not functional to show multiple assets.