Indexes MT5
- 유틸리티
-
Pavel Verveyko
 Writing scripts, indicators, EAs on MQL5 and MQL4.
Fast, Reliable, And High-Quality.
For all questions, please contact personal messages. - 버전: 1.1
- 업데이트됨: 22 6월 2021
- 활성화: 5
The stocks that make up the index are one of the drivers of the movement. Analyzing the financial performance of all elements of the index, we can assume further development of the situation.
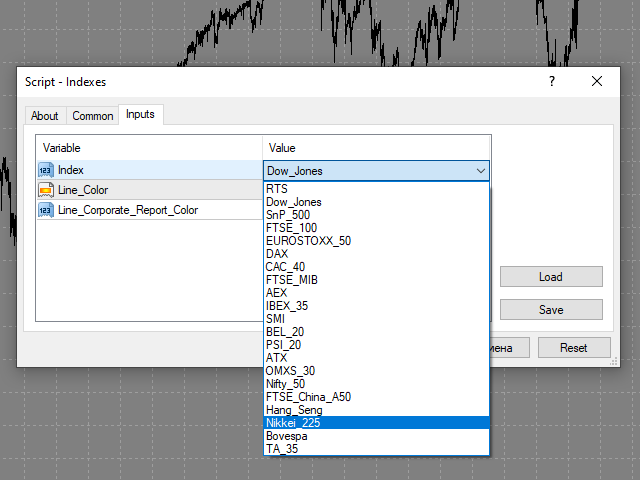
The program (script) displays corporate reports of shares that are part of the index selected in the settings.
"Indexes" cannot be tested in the tester (since there is no way to get information from the Internet).
Information is downloaded from the site investing.com:
- Report Date
- Earnings per share (EPS)
- Income (Revenue)
- market capitalization
The principle of operation:
- Searches for information about corporate reports of shares that are part of the index selected in the settings.
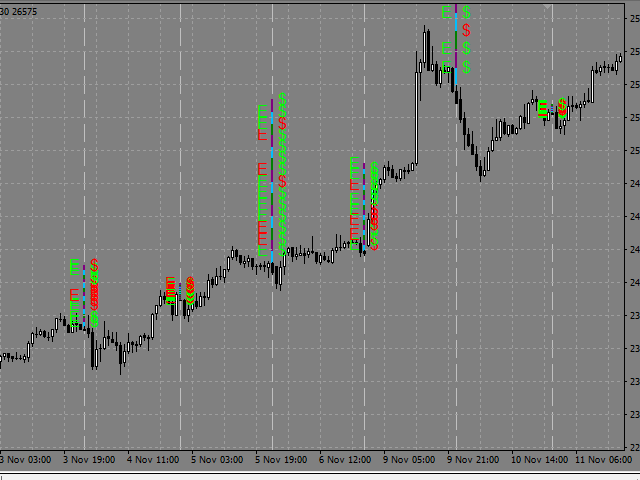
- While searching for information, the background of the graph changes color to blue.
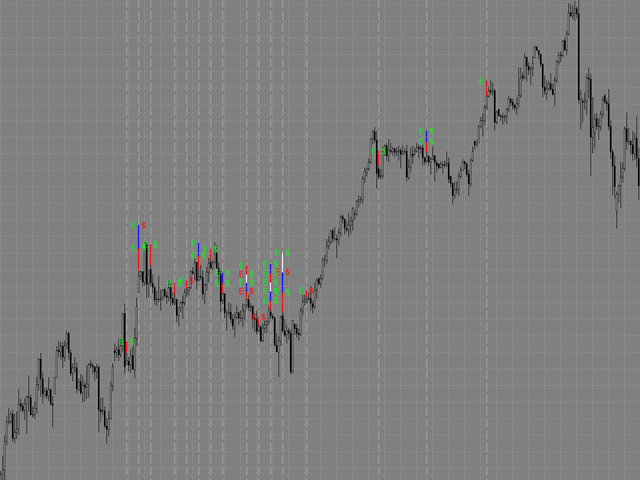
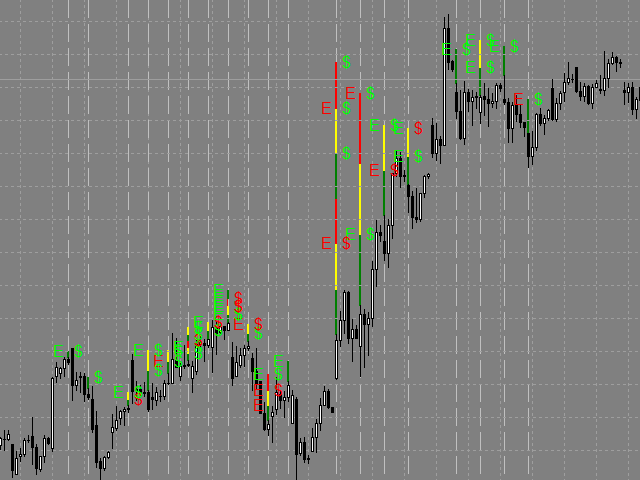
- Plotting vertical lines corresponding to dates of the published corporate reports. The tooltip of each of the lines contains data on the appropriate corporate report.
- The E and $ marks are assigned to vertical lines:
- if EPS value exceeds the forecast, the green E mark is used,
- if expectations are not met, the red one is used;
- if Revenue exceeds the forecast, the green $ mark is used,
- if expectations are not met, the red one is used.
- There can be several corporate reports in one day (displayed in different colors and higher than the previous one).
- The program works in Russian and English.
- In the settings, you can change the color of the lines.
Before launching :
- Add URL https://investing.com/earnings-calendar/Service/getCalendarFilteredData to the list of allowed URLs. Options -> Expert Advisors -> enable "Allow WebRequest for listed URL".
- As well as the URL to the indexes that you plan to use:
- RTS (Russia) https://ru.investing.com/indices/rtsi-components
- Dow_Jones (USA) https://ru.investing.com/indices/investing.com-united-states-30-components
- SnP (USA) https://ru.investing.com/indices/investing.com-us-500-components
- FTSE_100 (Great Britain) https://ru.investing.com/indices/investing.com-uk-100-components
- EUROSTOXX_50 (The European Union) https://ru.investing.com/indices/eu-stoxx50-components
- DAX (Germany) https://ru.investing.com/indices/germany-30-components
- CAC_40 (France) https://ru.investing.com/indices/france-40-components
- FTSE_MIB (Italy) https://ru.investing.com/indices/investing.com-italy-40-components
- AEX (Netherlands) https://ru.investing.com/indices/netherlands-25-components
- IBEX_35 (Spain) https://ru.investing.com/indices/spain-35-components
- SMI (Switzerland) https://ru.investing.com/indices/switzerland-20-components
- BEL_20 (Belgium) https://ru.investing.com/indices/bel-20-components
- PSI_20 (Portugal) https://ru.investing.com/indices/psi-20-components
- ATX (Austria) https://ru.investing.com/indices/atx-components
- OMXS_30 (Sweden) https://ru.investing.com/indices/omx-stockholm-30-components
- Nifty_50 (India) https://ru.investing.com/indices/s-p-cnx-nifty-components
- FTSE_China_A50 (China) https://ru.investing.com/indices/ftse-china-a50-components
- Hang_Seng (Hong Kong) https://ru.investing.com/indices/hang-sen-40-components
- Nikkei_225 (Japan) https://ru.investing.com/indices/japan-ni225-components
- Bovespa (Brazil) https://ru.investing.com/indices/bovespa-components
- TA_35 (Israel) https://ru.investing.com/indices/ta25-components
The program and all the information used in it depend on the site investing.com and they work as long as it is possible to get information programmatically from the specified links.