Indexes MT5

The stocks that make up the index are one of the drivers of the movement. Analyzing the financial performance of all elements of the index, we can assume further development of the situation.
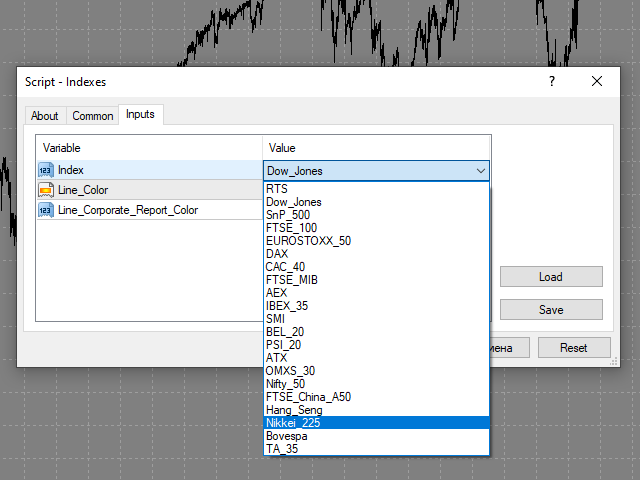
The program (script) displays corporate reports of shares that are part of the index selected in the settings. 

    "Indexes" cannot be tested in the tester (since there is no way to get information from the Internet).


    Information is downloaded from the site investing.com:

    • Report Date
    • Earnings per share (EPS)
    • Income (Revenue)
    • market capitalization


    The principle of operation:

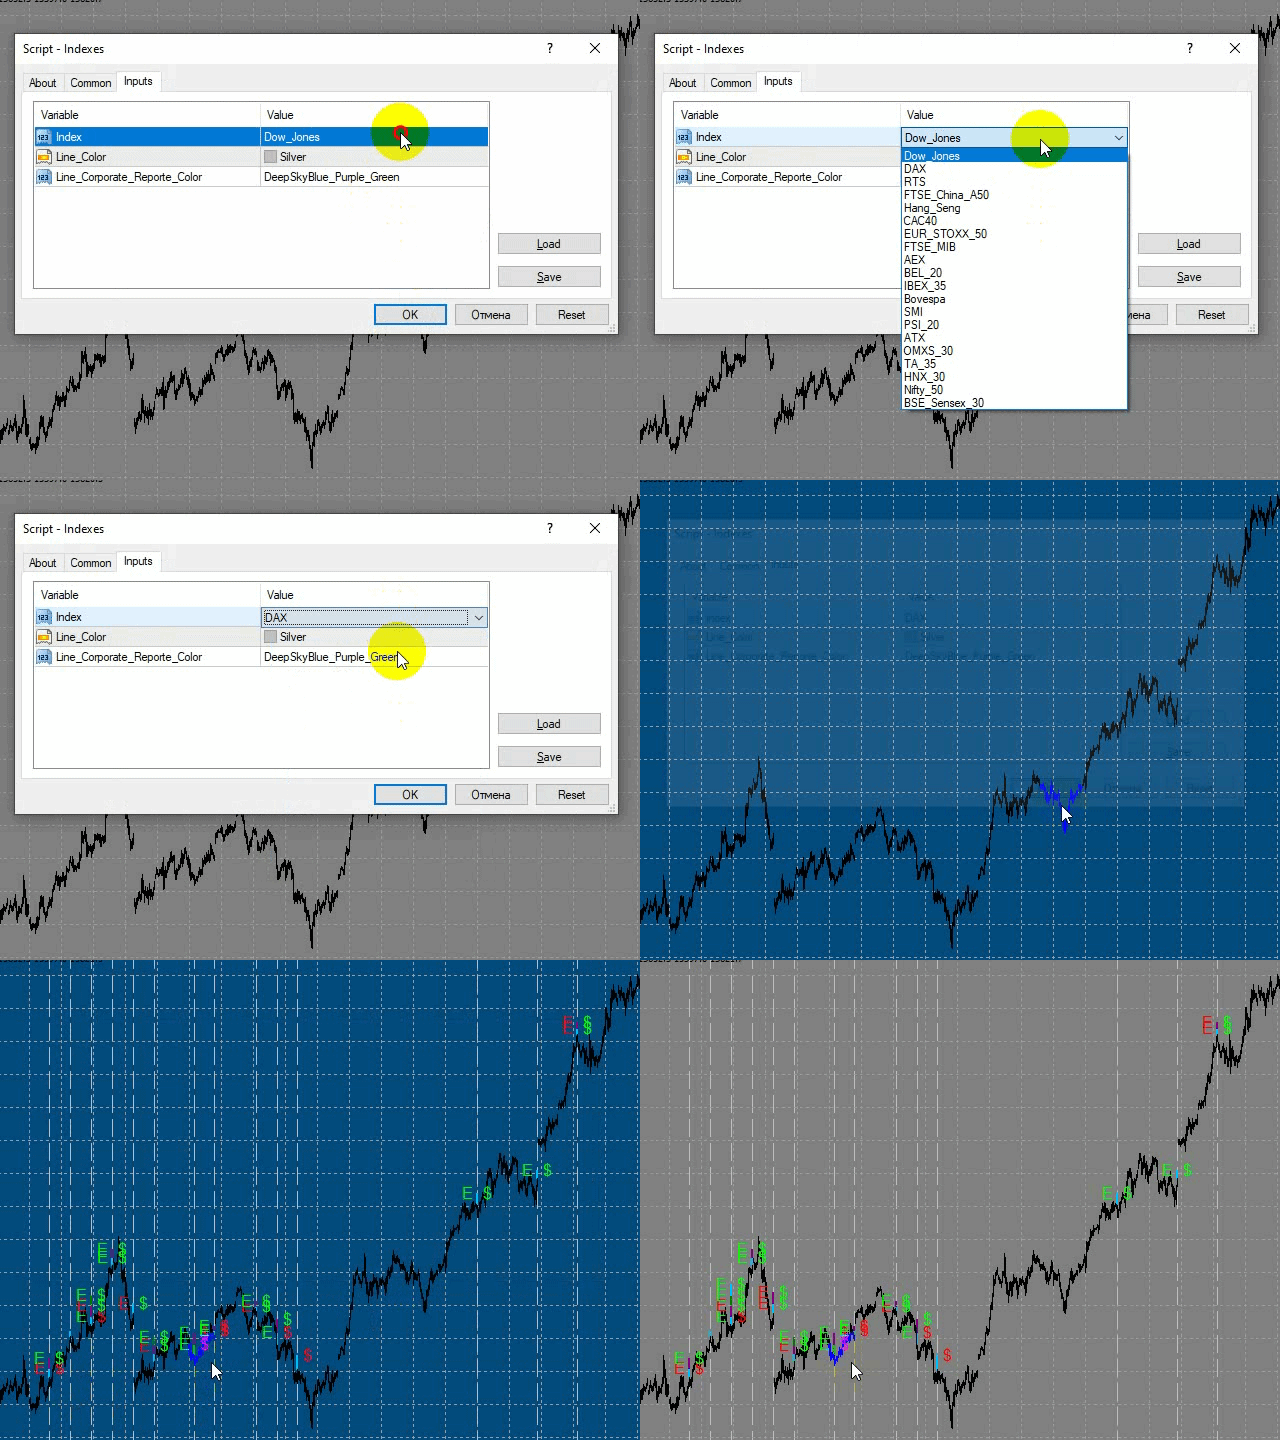
    • Searches for information about corporate reports of shares that are part of the index selected in the settings.
    • While searching for information, the background of the graph changes color to blue.
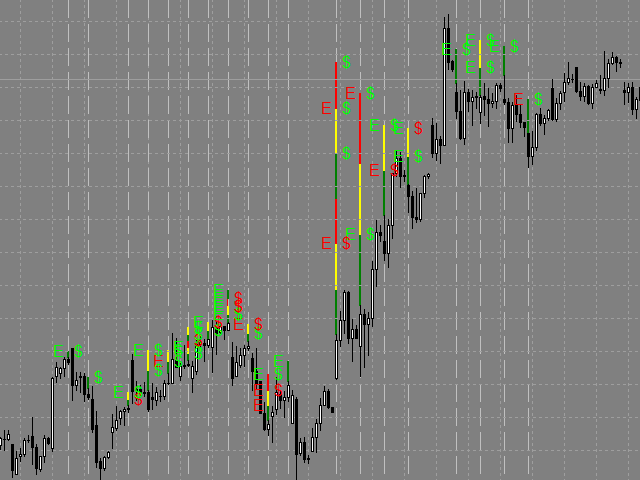
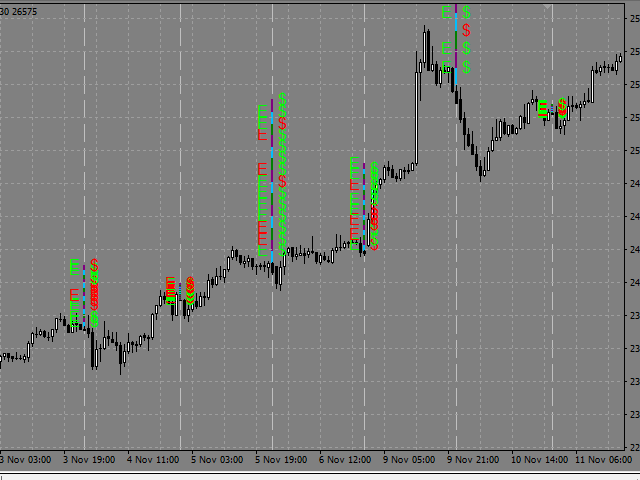
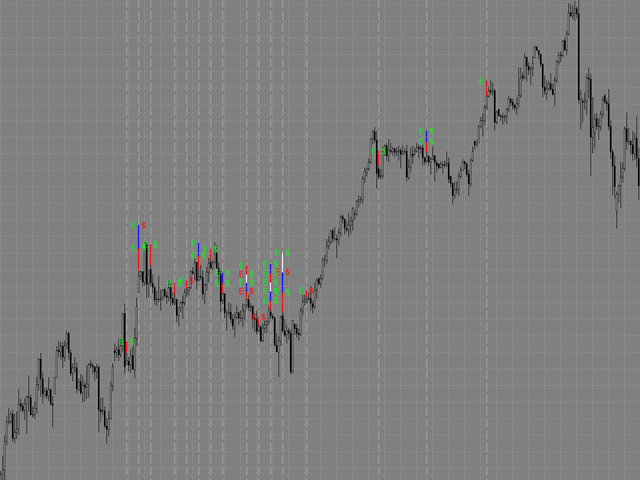
    • Plotting vertical lines corresponding to dates of the published corporate reports. The tooltip of each of the lines contains data on the appropriate corporate report.
        • The E and $ marks are assigned to vertical lines:
        • if EPS value exceeds the forecast, the green E mark is used,
        • if expectations are not met, the red one is used;
        • if Revenue exceeds the forecast, the green $ mark is used,
        • if expectations are not met, the red one is used.
    • There can be several corporate reports in one day (displayed in different colors and higher than the previous one).
      • The program works in Russian and English.
      • In the settings, you can change the color of the lines.


      Before launching :

        The program and all the information used in it depend on the site investing.com and they work as long as it is possible to get information programmatically from the specified links.
        For more convenience, assign a hotkey to the script: right-click "Indexes" in the Navigator window -> Set hotkey -> select a suitable combination.


        推荐产品
        CRT Fibo OTE Scanner MT5 is a multi-symbol CRT scanning and chart-visualization tool for MetaTrader 5. It detects active CRT-style setups, draws CRTH/CRTL zones, supports OTE entry Fibonacci and custom target Fibonacci layers, and provides optional context filters such as pivot BOS, PDH/PDL, weekly high/low, Asian sweep, killzone timing, HTF bias, displacement and FVG confirmation. This product is a chart utility and scanner. It does not open, modify, or close trades automatically. Full Product
        If you wish to draw Support and Resistance lines, view: daily market opening, classical pivot levels, Fibonacci pivot levels, trend lines, Fibonacci levels, the remaining time to candle closing, and current spread. If you seek to place your orders with the exact lot that meets your desired stop loss risk. If you wish to do all this and more with just one click, then this is the perfect tool to use. This tool will allow you to feel more relaxed when deciding to open orders, as well as predicting
        Bitcoin Robot Grid MT5
        MQL TOOLS SL
        4.59 (46)
        Bitcoin Robot Grid MT5 is an intelligent trading system designed to automate BTCUSD trading using the grid trading strategy. This method takes advantage of market fluctuations by placing a structured series of buy and sell orders at predefined price levels. The robot continuously monitors market conditions and executes trades according to its preset parameters, allowing for consistent market engagement without the need for manual intervention. Bitcoin Robot Grid is the perfect solution for trad
        测试版发布 Telegram to MT5 Signal Trader 即将进入正式的 Alpha 版本。一些功能仍在开发中,您可能会遇到一些小错误。如果您遇到问题,请反馈,您的意见将帮助我们改进软件。 Telegram to MT5 Signal Trader 是一款强大的工具,能够将 Telegram 频道或群组的交易信号自动复制到您的 MetaTrader 5 账户。 支持公开和私人频道,可将多个信号提供者连接至一个或多个 MT5 账户。软件优化、高效、稳定,精准控制每笔复制交易。 界面简洁,仪表盘美观,图表交互性佳,导航直观。您可以管理多个信号账户,自定义每个提供者的设置,并实时监控所有操作。 系统需求 由于 MQL 限制,EA 需要配合 PC 端应用与 Telegram 通信。 安装程序可通过官方 安装指南 获取。 核心功能 多提供者支持: 从多渠道复制信号至多个 MT5 帐户 高级信号识别: 关键词、模式和标签全面自定义 逐提供者控制: 可启用/禁用特定信号类型、平仓策略等 灵活风险管理: 固定手数、固定金额、余额/权益百分比、部分平仓设置 可定制 SL/TP: 覆盖信号
        # RSI Pro Alert - 高级RSI指标 一款功能强大的专业级RSI指标,具备智能警报、定时快照和多维度通知功能,助您精准把握市场机会! --- ## 核心特性 ### 智能信号识别 - **精准交叉检测** :自动识别RSI穿越超买/超卖水平的关键时刻 - **状态跟踪机制** :实时监控市场状态变化(超买/超卖/中性) - **首次加载通知** :指标加载时立即报告当前市场状态 ### 多维度警报系统 - **弹窗警报** :MT5原生弹窗提醒 - **声音警报** :支持自定义买入/卖出提示音 - **文件通知** :自动生成带时间戳的警报日志文件 - **冷却机制** :可自定义警报间隔,避免频繁打扰 ### 定时快照功能 - **定期报告** :可设置15分钟/30分钟/60分钟等间隔自动生成市场快照 - **完整信息** :快照包含RSI值、价格、状态、交易建议等完整信息 - **历史记录** :所有快照自动保存,便于复盘分析 ### 个性化定制 - **自定义水平** :支持调整超买(默认70)和超卖(默认30)
        QXS Market Scanner
        Netlux Digital Kft.
        QuantXMarketScanner is a multi assets indicator for MT5 - Mathematical model based on 7 custom moving averages indicators  - Adaptable on Currencies, Stocks and Crypto - Automatic setup, self optimized About QuantXsystem Products: –         Simple installation & integration into MT5   –         Unlimited License after purchase (for one user) –         Automatic pattern recognition to identify the best timing and price levels. –         Trading indicators are displayed directly and automaticall
        Darwin Assistant
        Ramzi Abuwarda
        隆重推出革命性的 MT5 指标 DARWIN Assistant   - 您通往成功交易世界的终极门户! DARWIN Assistant   采用精确和专业知识设计,采用特殊策略运行,利用先进技术指标(RSI、随机指标、CCI 和趋势)的力量,涵盖所有时间范围。准备好迎接非凡的交易体验吧,因为这个尖端指标为您提供最准确的入场信号,使您能够以无与伦比的信心驾驭市场。 借助 DARWIN Assistant   ,您可以访问关键指标的全面分析,并经过精心校准,以发现最有利可图的交易机会。告别不确定性,迎接明智决策的新时代。释放 RSI、随机指标、CCI 和趋势的力量,因为它们在 DARWIN Assistant   中无缝融合,以前所未有的方式描绘出一幅生动的市场动态图景。 由于 DARWIN Assistant   密切关注每个时间范围,因此可以轻松深入了解市场趋势和模式的世界。无论您喜欢短期的兴奋还是长期的战略投资,这个卓越的指标都能满足您的交易风格,为您提供市场潮起潮落的整体视图。 DARWIN Assistant   的准确性是其成功的基石。在广泛的研究和开发的支持下,该
        Naked Forex Big Shadow indicator for MT5
        Renaud Herve Francois Candel
        5 (1)
        Naked Forex Big Shadow Indicator Big Shadow Indicator is a pattern recognition indicator for Forex, Stocks, Indices, Futures, Commodities and Cryptos. When you have a Big Shadow on your chart then this is a strong signal meaning that you might be ahead of a reversal. You can take other elements (momentum, trend, volatility, price action, fundamentals) to build a complete strategy and confirm your entries. Beware that you might not make money just following the arrows generated by the pattern re
        MetaHelper
        Volodymyr Tseibei
        This indicator automatically calculates and displays classic pivot points on your chart, helping identify key support and resistance levels for the current trading session. Features: · Plots Pivot (PP), Resistance 1-2 (R1, R2), and Support 1-2 (S1, S2) levels · Includes current close price line for reference · Color-coded lines: Blue for pivot, Red for resistances, Green for supports · Automatic calculation based on previous day's high, low, and close · Continuous lines across the chart for e
        MercariaPattern1-2-3 відстежує рух ціни, знаходить трьоххвильові структури 1-2-3 та підсвічує момент, коли сценарій підтверджується пробоєм ключового рівня. MercariaPattern1-2-3 tracks price movement, detects three-leg 1-2-3 structures and highlights the moment when the scenario is confirmed by a key level breakout. Індикатор збирає локальні свінги в компактну фігуру 0–1–2–3 , чекає підтвердженого пробою та будує стрілку входу з готовими рівнями SL/TP. The indicator combines local swings into a
        ️ UMNi-CMND Remote MT5 / MT4 Command System UMNi-CMND is the remote command layer of the UMNi ecosystem, built to deliver structured control, governed actions, and real-time operator interaction with your trading systems. Positioned as the execution and control layer , it extends beyond monitoring — allowing you to send commands, manage trades, and interact with your trading environment directly through Telegram. KEY FEATURES • Remote command execution via Telegram • Trade
        Neowave Chart Plotter
        Bahador Baradari
        5 (1)
        This Expert Advisor is applicable to plot wave charts as per the NeoWave  method (Neely Extension of Wave Theory).  NeoWave is a scientific, objective and revolutionary style of Elliott Wave Theory that was invented by Glenn Neely in 1990 in the “Mastering Elliott Wave” book. To start analyzing with this method, we need a particular chart called the Wave Chart or Cash Data chart . This is the first step for a good wave analysis. To draw this chart, Highs and Lows should be plotted in the order t
        Inverted_Chart_EA Utility Expert Advisor Inverted_Chart_EA creates and maintains a mirror-inverted chart of any symbol and timeframe. It automatically generates a custom instrument (e.g. US30_INV ) and keeps its price history updated in real time, with bars mirrored around a chosen pivot. This utility gives traders a new way to analyze the market from a different perspective by flipping the chart upside down. Why use an inverted chart? Highlight hidden patterns – price formations that look ordin
        BOT NOTIF - 6 - DUAL MODE - BB is a Notifier-type Expert Advisor (EA) specifically designed to monitor market saturation points (Overbought/Oversold) with high accuracy through a three-layer filter: RSI, Wick Validation (Candle Tail), and Bollinger Bands. This bot does not execute automated trades (Auto-Trade); instead, it acts as a smart assistant that sends visual signals and comprehensive Telegram notifications, including real-time chart screenshots. It is ideal for traders seeking price reve
        FX Levels Premium indicator for MT5
        Renaud Herve Francois Candel
        Fx Levels Premium Indicator Support and Resistance are important concepts in trading. Fx Levels Premium was created to easily draw important levels of support and resistance for the active trader. The indicator will give you all important levels (support/resistance) to watch for a wide range of assets. Trading without these levels on your chart is like driving a car for a long journey without a roadmap. You would be confused and blind. Support and resistance levels should be used as guideline
        ZigZag SMC Premium MT5
        Kallebe Lins De Oliveira Santos
        If you are looking for precision in identifying strategic tops and bottoms, the ZigZag SMC/SMT Indicator for MT5 is the tool that will contribute to your technical analysis. Developed based on the advanced concepts of Smart Money Concepts (SMC) and Smart Money Trap (SMT), it offers an insight into market behavior, helping you make decisions. What will you find in this indicator? Automatic identification of strategic tops and bottoms Based on institutional strategies Ideal for analyzing liqu
        Engulfing with EMAs Indicator Unlock the power of advanced candlestick pattern detection with the Engulfing with EMAs Indicator , a cutting-edge tool designed for MetaTrader 5. This futuristic indicator combines the precision of engulfing pattern analysis with the trend-following strength of Exponential Moving Averages (EMA 21 and EMA 50), empowering traders to identify high-probability setups across all currency pairs and timeframes. Key Features: Comprehensive Engulfing Detection : Detects b
        FBoFinder
        Andrii Voliuvach
        For those who trade false breakouts (FBo) levels. The False Breakout Finder (FBoFinder) service was written primarily for trading stocks and their CFDs on daily charts. It will search for you for various false breakouts of extremes on hundreds and thousands of instruments from the Watchlist, which will save you in the long run many hours of daily routine selection of securities before the market opens. In the process of enumerating instruments, securities with a ban on trading are ignored. If a
        PropFirm AI Management is an Expert Advisor for MetaTrader 5 designed to assist traders operating under prop firm evaluation conditionsas well as independent personal trading. It integrates a generative AI pipeline with a structured multi-timeframe analysis engine, automated risk controls, and real-time position management — working within the specific constraints of funded account rules. How It Works PropFirm AI Management operates on a continuous timer cycle. On each tick, it evaluates a seque
        Meta Trend PRO MT5
        Roman Podpora
        5 (1)
        元趋势专业版     — 是一款趋势跟踪工具,它能消除交易中的猜测成分,并显示市场已经做出决定的位置。该指标能够识别趋势、趋势线和结构发生变化的关键点,并突出显示价格回升的区域,以便主要参与者进行建仓。 您不仅能看到价格走势,还能理解其背后的逻辑。所有信号均在K线收盘后记录,不会重绘,并保存在图表上,让您能够自信地分析形势并做出决策。交易目标(止盈)也会显示出来。 为了确保您对该指标的有效性完全有信心,我们为您提供自动统计数据。 每次方向改变后,该指标还会显示止损位及其智能渐进移动(Move SL),这至关重要。     减少   风险   按位置。 止损/止盈/风险回收 右侧内置面板显示当前全球趋势方向的市场入场点,并显示这些信号的历史数据。 任何时间范围/工具 该指标适用于所有时间间隔 -     从 M1 到 MN,也适用于所有仪器。 全球趋势统计 这有助于更好地理解。     最有利可图的机会究竟在哪里形成   以及如何根据真实的历史数据提取更多收入。 信号强度水平 并非所有反转信号都具有相同的强度,该指标充分考虑了这一点。这使您能够立即了解走势的强度并过滤掉微弱的信号。 SH
        Short Description Swing Timing Breakout EA is a smart Expert Advisor for MetaTrader 5 that combines trend filtering, momentum timing, and dynamic risk management to capture high-probability swing and breakout opportunities. Full Description Swing Timing Breakout EA is a professional trading robot designed for MetaTrader 5, suitable for traders who want a balance between automation, control, and disciplined risk management. This EA uses a trend-following and momentum confirmation approach ,
        Magic EA MT5
        Kyra Nickaline Watson-gordon
        Magic EA is an Expert Advisor based on Scalping, Elliot Waves and with filters such as RSI, Stochastic and 3 other strategies managed and decided with the robot smartly. Large number of inputs and settings are tested and optimized and embedded in the program thus inputs are limited and very simple. Using EA doesn't need any professional information or Forex Trading Knowledge. EA can trade on all symbols and all time frames, using special and unique strategies developed by the author. The EA w
        Gold EA: Proven Power for 1-Minute Gold Trading Transform your trading with our Gold EA, meticulously crafted for 1-minute charts and delivering over 2000% growth in 5 years from just $100-$1000 . No Martingale, No AI Gimmicks : Pure, time-tested strategies with robust money management, stop loss, and take profit for reliable performance across multiple charts. Flexible Trading Modes : Choose Fixed Balance for safe profits, Mark IV for bold growth, or %Balance for high rewards—combine Mark IV an
        适用于MT5平台的“WPR双均线指标”,无重绘。 - WPR本身就是短线交易的最佳震荡指标之一。 - “WPR双均线指标”允许您查看WPR震荡指标的快慢均线。 - 该指标能够帮助您及早发现价格回调。 - 此指标的参数设置非常简单,适用于任何时间周期。 - 您可以在图片中看到买入和卖出的入场条件。 - 通过 PC 和移动设备接收 WPR MAs 交叉警报。 买入信号示例: (1) - 如果快均线向上穿过慢均线,且WPR值低于-50:开立买单。 (2) - 一旦WPR值进入超买区域,高于-20:平仓。 卖出信号示例: (1) - 如果快均线向下穿过慢均线,且WPR值高于-50:开立卖单。 (2) - 一旦 WPR 值低于 -80 进入超卖区域:平仓卖单。 点击这里查看高质量的交易机器人和指标! 这是仅在 MQL5 网站上提供的原创产品。
        Gold instrument scanner is the chart pattern scanner to detect the triangle pattern, falling wedge pattern, rising wedge pattern, channel pattern and so on. Gold instrument scanner uses highly sophisticated pattern detection algorithm. However, we have designed it in the easy to use and intuitive manner. Advanced Price Pattern Scanner will show all the patterns in your chart in the most efficient format for your trading. You do not have to do tedious manual pattern detection any more. Plus you
        关于指标 该指标基于金融工具收盘价的蒙特卡罗模拟。按照定义,蒙特卡罗是一种统计技术,用于通过基于之前观察的结果的随机数来模拟不同结果的概率。 它是如何工作的? 该指标通过基于历史数据模拟随时间变化的随机价格变动,为证券生成多个价格情景。每次模拟试验使用随机变量来有效地模拟未来在给定时间范围内的市场波动,重点在 收盘价 的波动。 蒙特卡罗模拟的优势 - 蒙特卡罗模拟通过在多种可能的未来情景下进行测试,有助于分析不同交易策略的风险。 - 它有助于确定策略在不同市场条件下的表现,包括罕见的极端事件(尾部风险)。 - 与依赖单点预测不同,蒙特卡罗提供了具有相关概率的潜在结果范围。这有助于理解盈利或亏损的可能性。 对于希望基于不同结果的概率而不是绝对预测来管理风险的交易者来说,蒙特卡罗是一个有用的工具。
        Overview Mirror Signals Service EA (Text only)   is a powerful monitoring Expert Advisor that automatically sends   real-time Telegram notifications   for all important trade events on your MetaTrader 5 account. It is engineered specifically for   signal providers ,   trade-copier operators ,   auditors ,   educators , and   professional trading services   that require immediate, detailed, and reliable reporting. Everything from   entries, exits, SL/TP changes, comment changes, trailing sto
        PREngulfing
        Slobodan Manovski
        PR EA - 吞没形态交易系统 自动识别吞没形态,均线确认信号 PR EA是一款MetaTrader 5专家顾问,专门用于识别并交易看涨/看跌吞没形态,并通过移动平均线过滤确认信号。优化适用于30分钟图表,同时兼容M15和H1时间框架。 核心功能: 形态识别 - 精准检测有效的吞没K线形态 趋势确认 - 238周期SMA过滤器(参数可调) 风险管理 - 自定义止损、止盈 + 可选追踪止损 时间框架优化 - 专为M30图表设计(兼容M15/H1) 仓位控制 - 同一时间仅持有一个仓位 推荐设置: 最佳表现:M30时间框架 不建议使用:高于H1的时间框架 自定义选项: 可调整交易手数 灵活设置止损/止盈值 追踪止损功能 均线周期调节 点差过滤,避免低效执行 适合以下交易者: 偏好自动K线形态交易 需要均线确认的反转策略 波段交易(30分钟-1小时图表) 规则明确的交易系统 "通过均线确认的吞没形态交易信号" MT5专用 • 需MetaTrader 5平台 • 兼容所有经纪商
        多时间周期RSI指标 使用我们直观的RSI指标,释放多时间周期分析的强大功能! 在一个图表上全面了解不同时间周期的市场动量。我们的多时间周期RSI指标允许您在五个可自定义的时间周期中以一致的周期跟踪相对强弱指数(RSI),使您能够做出更明智的交易决策。 主要特点: 同步多时间周期视图: 在一个图表上同时监控多达五个不同时间周期的RSI,无需在窗口之间切换。 可自定义时间周期: 定义您喜欢的时间周期以适应您的交易策略,从M1到MN。 统一的RSI周期: 在所有选定的时间周期中保持一致的RSI计算周期,以便进行直接比较。 清晰的视觉表示: 轻松识别超买/超卖情况以及多个市场周期中的动量变化。 增强的决策制定: 发现时间周期之间的背离和趋同,提供对市场趋势的更深入洞察。 用户友好的界面: 简单直观的设置,可立即使用。 为什么选择我们的多时间周期RSI? 该指标是寻求改善市场分析的交易者不可或缺的工具。通过提供跨各种时间周期的RSI的整体视图,您可以更好地理解资产的潜在强度或弱点,并预测潜在的价格变动。无论您是日内交易者、波段交易者还是长期投资者,该指标都将显著提高您的分析能力。
        CRT Alert
        Austin John Ifeanyi Ogbormeh
        实时 CRT 警报,助你更聪明地交易! CRT Alert EA 专为使用蜡烛区间理论(CRT)的交易者设计。该工具可监控多个时间周期的价格行为,并在第三根蜡烛形成时及时发送警报,助您把握交易时机。 主要功能: 实时警报 多时间框架监控(1分钟到月线) 自定义设置 支持 MT5 手机与桌面推送 更多功能即将上线 使用方式: 1️⃣ EA 根据 CRT 理论监测三根连续蜡烛 2️⃣ 当出现有效形态时,触发警报 3️⃣ 您会收到桌面与手机的通知 无自动交易,您拥有完全控制权! Telegram 联系我: @osteeen4x 自动交易功能即将推出,支持低周期 orderflow 触发。如需根据您自己的策略定制自动交易,请联系我。 关于 CRT 理论,可参考 X 上的: @Romeotpt
        该产品的买家也购买
        Farmed Hedge Yield Farming | All Markets (Manual - Hybrid - Semi/Automated EA) MULTI-ASSET SUPPORT Trade any asset available on your broker - Forex: Major, Minor, Exotic pairs - Crypto: BTC, ETH, XRP, SOL, BNB - Stocks: Apple, Tesla, Amazon, Google, etc. - Commodities: Gold, Silver, Oil, Gas - Indices: US30, NAS100, SPX500, DAX40 - Any CFD your broker offers VERIFIED TRADING RESULTS - Farmed Hedge Yield Axi Copy:  https://www.mql5.com/en/signals/2356376 - Farmed Hedge Yield Exn Copy:   https:/
        Quant AI Agents is NOT AN Expert Advisor. Quant AI Agents   is a   multi-agent AI trading framework   that turns natural-language strategy prompts into live.  WANT THE SAME RESULTS AS MY LIVE SIGNAL?   Use the exact same brokers I do:   IC MARKETS , IC TRADING   .  Unlike the centralized stock market, Forex has no single, unified price feed.  Every broker sources liquidity from different providers, creating unique data streams. Other brokers can only achieve trading performance equivalent to 60
        YuClusters
        Yury Kulikov
        4.93 (43)
        Attention: You can view the program operation in the free version  YuClusters DEMO .  YuClusters is a professional market analysis system. The trader has unique opportunities to analyze the flow of orders, trade volumes, price movements using various charts, profiles, indicators, and graphical objects. YuClusters operates on data based on Time&Sales or ticks information, depending on what is available in the quotes of a financial instrument. YuClusters allows you to build graphs by combining da
        MT5 Trading Deck
        Manuel Michiels
        5 (2)
        One button. One trade. MT5 Trading Deck is a hotkey trading panel for MetaTrader 5 that turns the platform into a keyboard-driven execution cockpit. Stop loss, take profit and lot size are pre-calculated for every key; the moment you press, a market order is live on the broker. A complete technical user manual is attached in the product Comments section. It documents every input parameter, the full hotkey map, the recommended Stream Deck XL layout, and the advanced workflows for Pre-Limit orders
        HINN Lazy Trader
        ALGOFLOW OÜ
        5 (2)
        The core idea: using the user interface, you configure the parameters the chart must meet before entering a position (or positions), choose which entry models to use, and set the rules for when trading and planning should end. Lazy Trader  handles the rest: it  takes over all the routine chart watching and execution! full description  :: 3 key videos [1] ->  [2]   ->  [3] What can it do? - Understands Larry Williams market structure - Understands swing market structure by Michael Huddleston
        Gamma Edge Pro MT5 — GexBot Classic API Integration Gamma Edge Pro   brings institutional-grade   Gamma Exposure (GEX) data   directly onto your MetaTrader 5 chart — the same data used by professional options traders to anticipate price magnets, hedging flows, and dealer positioning. Powered by the   GexBot Classic API , this indicator automatically maps options market data from US-listed instruments onto any   MT5 CFD instrument   — Forex pairs, Gold, indices, and more — with intelligent price
        Unlimited Trade Copier Pro MT5 is a tool to copy trade remotely to multiple MT4, MT5 and cTrader accounts at different computers/locations over internet. This is an ideal solution for you if you are a signal provider and want to copy your trades to other receivers globally on your own rules. One provider can copy trades to multiple receivers and one receiver can get trade from multiple providers as well. The provider can even set the subscription expiry for each receiver, so that receiver will n
        Crystal Trade Manager – Advanced MT5 Risk and Trade Control Utility Overview Crystal Trade Manager (CTM) is a professional MetaTrader 5 utility designed for risk management, trade automation, and instant execution control. It provides traders with an integrated system for protecting equity, managing daily drawdowns, controlling lot sizes, and applying automation features such as automatic SL/TP, break-even, and trailing stop. The tool is suitable for manual traders, prop-firm challenge particip
        EA price is reduced to 50% discount for limited time period. Spot vs Future Arbitrage EA for MT5 Spot vs Future Arbitrage EA is an automated Expert Advisor designed for MetaTrader 5 that operates using price differences between Gold spot and Gold futures instruments. The strategy opens positions on both instruments simultaneously to take advantage of temporary differences between spot and futures prices. Requirements The trading account must provide both Gold spot and Gold futures instruments
        ******************************* ***************** ********************** ***************** ********************** ************************* GoldMine Train 是一款针对黄金的趋势交易策略 EA。 操作员确定主要趋势方向并指示Train前进。 Train 将在该方向连续买入/卖出, 手数取决于账户余额和预设的杠杆比率。 当操作员改变趋势方向时,Train将停止并锁定利润。 用户可以使用图表上的按钮轻松选择趋势方向。 ******************************* ***************** ********************** ***************** ********************** *************************
        Mentfx Mmanage mt5
        Anton Jere Calmes
        4.25 (8)
        The added video will showcase all functionality, effectiveness, and uses of the trade manager. Drag and Drop Trade Manager. Draw your entry and have the tool calculate the rest. Advanced targeting and close portions of a trade directly available in tool (manage trades while you sleep). Market order or limit order on either side with factored spread. Just draw the entry, the tool does the rest. Hotkey setup to make it simple. Draw where you want to enter, and the stop loss, the tool calculates al
        Introduction Our system is more than just a tool—it’s your personal guide in the dynamic trading landscape. Expertly developed and optimized using advanced strategies, this groundbreaking predictor gives traders a powerful edge. It’s not just about the features; it’s about a trading journey that stands out from the crowd. Get ready for an enhanced trading experience like never before! What It Does Next Candle Prediction: Imagine gaining insights into the market’s next move before it happens. Our
        Reward Multiplier is a semi-automatic trade manager based on pyramid trading that opens additional orders with the running profit of your trades to maximize return exponentially without increasing the risk. Unlike other similar EAs, this tool shows potential profit/loss and reward to risk ratio before even entering the first trade! Download Demo here  (starting lot is fixed at 0.01) Guide + tips here MT4 version   here You only open the first order. When your trade goes into profit RM opens a ne
        Trading Chaos Expert
        Gennadiy Stanilevych
        5 (11)
        世界上没有本软件的同等产品,它代表一个覆盖交易信号的通用交易 "控制台",自动入场,设置止损和止盈,还有在单一窗口里同时进行多交易尾随终止。EA 的 "三次点击" 直观控制,确保在不同计算机上全方位使用所有功能,包括平板电脑。 与附加的信号指标交互来标记图标,给出实际市场的全貌,EA 令您做出正确的选择,以及在大多数情况下成为胜者一方。内置资金管理算法, 还有自动计算手数, 虚拟订单交易, 以及一些其它从崩溃账户里挽救交易者的 "诀窍"。它不是一个 "黑盒子"。而是一个深思熟虑的交易员的不可或缺的助理, 至少要尝试一次它的动作。 注,在面板上形成的 EA 不能在策略测试员中测试。可以在您的模拟账户里以实时模式检查它, 您可以下载本 EA 的免费版 - 混沌交易 EA 演示 。 EA 表现为一个面板,带有内置功能的交易机器人的,自动基于交易者可直观检查的交易信号入场,完全按照比尔·威廉姆斯的策略“混沌交易:第二版”和“新贸易维度”。在单独的窗口里,EA 识别价格走势的导向,用于指定品种和时间帧的全自动交易模式,也可以多品种并发。 它同时分析 MetaTrader 5“市场观察”窗口中显示
        ENGLISH VERSION TICK CHART SERVICE - Professional Tick Chart Service
        一款专业的订单与风险管理工具,专为希望精确控制风险、仓位大小以及交易管理的交易者而设计。 该智能交易系统旨在帮助交易者实现系统化、纪律化的交易方式,提供全面的订单管理、风险计算和持仓管理功能。 EA 功能 自动手数计算 根据设定的风险百分比,基于 账户余额(Balance)或净值(Equity) 自动计算下单手数。 风险回报管理系统(Risk–Reward) 支持基于 风险回报比(R:R) 的交易管理方式, 帮助交易者在风险与收益之间保持一致和可控的比例关系。 市价单与挂单支持 全面支持: 市价订单 挂单类型(Buy Limit、Buy Stop、Sell Limit、Sell Stop) 手动部分平仓(3 个级别) 提供 3 个可自定义的手动部分平仓级别 ,灵活管理持仓规模。 自动保本系统(Breakeven) 自动将止损移动至保本位置。 适用于 所有已开仓位 。 自动部分平仓系统 自动管理持仓的部分平仓操作。 适用于 所有已开仓位 。 快捷键支持 通过 可自定义的快捷键 快速执行关键交易管理功能。 为系统化风险管理而设计 专为注重 一致性、纪律性以及基于规则的风险管理 的交易
        News Trader Pro is a unique robot that allows you to trade the news by your predefined strategy. It loads every piece of news from several popular Forex websites. You can choose any news and preset the strategy to trade it, and then News Trader Pro will trade that news by selected strategy automatically when the news comes. News release gives opportunity to have pips since the price usually has big move at that time. Now, with this tool, trading news becomes easier, more flexible and more exciti
        The new version of  MirrorSoftware 2021  has been completely rewriten and optimized.  This version requires to be loaded only on a single chart because  it can detect all actions on every symbol and not only the actions of symbol where it is loaded. Even the  graphics and the configuration mode  have been completely redesigned. The MirrorSoftware is composed of two components (all components are required to work):  MirrorController  (free indicator): This component must be loaded into the MASTER
        Virtual Grid MT5
        Volodymyr Hrybachov
        用於半自動交易的實用程序。應用動態水平來設置經紀人不可見的止損、止損、止盈和追踪止損。適合與任何經紀人合作,包括具有 FIFO 要求的美國經紀人。 MT4 版顧問鏈接 可以使用按鈕或線條打開交易。為了讓顧問沿著這條線開倉:在圖表上畫一條線並重命名。當價格穿過它時,EA 將執行相應的命令。 OPEN_SELL - 開一個賣單 CLOSE_SELL - 關閉所有賣單 OPEN_BUY - 未結買單 CLOSE_BUY - 關閉所有買單 命令執行後,寫註釋“OK”,該行只執行一次命令。 該圖表顯示有關收到的利潤、當前未平倉頭寸(訂單數量、手數和利潤)、開倉訂單按鈕、執行速度和滑點的信息。 選項: MAGIC_NUMBER - 幻數; LOT_SIZE_MULTIPLY - 平均訂單的手數乘數; MIN_GRID_STEP - 平均訂單之間的最小步長; GRID_PRICE_STEP - 打開平均訂單前的最小步長; STOPLOSS - 一籃子訂單的止損; TAKEPROFIT - 一籃子訂單的獲利; TRAILING_STOP - 追踪期間的最低利潤; TRAILING_S
        The  Easy Strategy Builder (ESB)  is a " Do It Yourself " solution that allows you to create a wide range of the automated trading strategies without any line of codes. This is the world’s easiest method to automate your strategies that can be used in STP, ECN and FIFO brokers. No drag and drop is needed. Just by set conditions of your trading strategy and change settings on desired values and let it work in your account. ESB has hundreds of modules to define unlimited possibilities of strategi
        GRID for MT5
        Volodymyr Hrybachov
        GRID for MT5 是一種方便的工具,適用於那些使用訂單網格進行交易的人,專為在外匯金融市場上進行快速而舒適的交易而設計。 MT5 的 GRID 有一個可定制的面板,其中包含所有必要的參數。適合有經驗的交易者和初學者。與任何經紀商合作,包括有 FIFO 要求的美國經紀商 - 首先,關閉之前打開的交易。訂單網格可以是固定的——訂單以固定的步長開倉,或者有動態的開倉水平——以更好的價格開倉,它只適用於市價單。 GRID for MT5 交易面板具備開倉、平倉和追踪訂單功能。訂單由一籃子關閉,可以是單向 - 僅買入或賣出,或雙向買入和賣出。要平倉,可以使用止損、止盈、盈虧平衡和追踪止損功能。止損和止盈可以設置為餘額的百分比。具有最短持倉時間和新訂單開倉最小間隔(秒)功能。 MT4 版本: https://www.mql5.com/en/market/product/46234 選項: MULTIDIRECTIONAL_MODE - 同時關閉雙向訂單,如果為 true - 關閉一籃子訂單,如果為 false - 買入和賣出訂單分別關閉; MIN_HOLDING_SEC - 最小持
        1.   记录每一个Tick交易的价格数据。     数据文件内容:“Tick时间”、“ASK价格”、“BID价格”、“SPREAD价差”、“Tick报价数量”。 2.   同时,生成一个1分钟周期的报价数据文件。     1min数据文件内容:“ASK时间”、“ ASK OPEN价格 ”、“ASK HIGH 价格”、“ASK LOW 价格”、“ASK CLOSE 价格”、 “ BID 时间”、“BID OPEN价格 ”、“ BID HIGH 价格”、“ BID LOW 价格”、“ BID CLOSE 价格”、 “Tick报价数量”。 3. 每天将所有报价数据保存在一个文件中,方便使用者进行数据分析和数据整理。 4.这个EA程序,任何时刻加载到MT5图表中,就可以直接开始价格数据的记录。确保记录下市场中出现的每一个报价。 5.文件存储位置:MQL4/Files/
        Mt5BridgeBinary
        Leandro Sanchez Marino
        我自动其商业策略的使用二进制 MT5 和我们 Mt5BridgeBinary 我发送的命令其二进制账户和我名单: 开始使用这种方式容易! 专家顾问也容易形成、优化和实现抗寒试验; 还在测试中我们可以预测其长期盈利能力,所以我们创造了 Mt5BridgeBinary 连接其最佳战略二进制文件。 特点: 它可以使用很多战略如我所愿。 (专家顾问)。 他不需要额外的程序。 随函附上我方- EA 没有导入的时限。 它可以想象所有的公开行动。 他只需要执行我们 EA 只在一个图形采取所有的订单。 -它不需要复杂的配置,以使我们的就业工作。 输入参数: 电子邮件: 有关其电子邮件帐户的二进制文件。 -标记: 代码访问它生成的二进制来操作。 -数量操作: 该合同价值。 位置警报: 会启用/禁用警报作业时开放。 -小组菲尔斯滕: 它显示所有打开的行动。 注: -期限的合同: 请参阅《资产指数来了解这笔总额中,最小和最大期限的合同。 - Volatile 性质指标不能在德国、法国、西班牙、新加坡、澳大利亚、意大利和卢森堡。
        FiboPlusWaves MT5
        Sergey Malysh
        5 (1)
        FiboPlusWave Series products Ready-made trading system based on Elliott waves and Fibonacci retracement levels . It is simple and affordable. Display of the marking of Elliott waves (main or alternative option) on the chart. Construction of horizontal levels, support and resistance lines, a channel. Superposition of Fibonacci levels on waves 1, 3, 5, A Alert system (on-screen, E-Mail, Push notifications).    Features: without delving into the Elliott wave theory, you can immediately open one of
        Xrade EA
        Yao Maxime Kayi
        Xrade EA is an expert advisor as technical indicator. For short period trade it's the best for next previsions of the trend of the market. +--------------------------------------------------------------------------------------- Very Important Our robot(data anylizer) does'nt take a trade procedure. If using only our robot you must take positions by yoursels +--------------------------------------------------------------------------------------- The technical indiator provide for a given sma
        Grid MT5
        Volodymyr Hrybachov
        5 (1)
        用於半自動交易、訂單管理的實用程序也可用於恢復賬戶上無利可圖的頭寸。它具有通過重疊無利可圖的訂單來減少賬戶回撤的功能。它可以處理手動訂單、從面板打開的訂單或由另一個“EA 交易”打開的訂單。它具有最少的參數,易於配置,可處理任意數量的訂單。對於測試,請使用策略測試器中的可視化模式。 MT4 版本 https://www.mql5.com/en/market/product/56492 選項: START_LOT - 初始手數; LOT_MULTIPLIER - 訂單網格中的手數乘數; MAX_LOT - 最大手數; STEP_ORDERS - 訂單網格步驟; STEP_MULTIPLIER - 階步倍增因子,如果 = -1 則不使用; MAX_STEP - 最大階網格步長; OVERLAP_ORDERS - 從哪個訂單啟用訂單重疊功能; OVERLAP_PIPS - 關閉無利可圖訂單的最小利潤點數; STOPLOSS, TAKEPROFIT - 止損和止盈點數,如果 = -1 未使用; BREAKEVEN_STOP, BREAKEVEN_STEP - 盈虧平衡水平和步長,如果
        News: IDEA 2.0 is out with lot of features, like telegram bot notifications and Limits order! Check the changelog at bottom of page (*). Hi all, here you can find my Expert Advisor, called IDEA  (Intelligent Detection & managEr Algorithm) . In short, with this software you can: Have   a clear view of market status , with an indication of current trend. Simply add symbols you want to monitor to your market watch, and IDEA will notify you if some of them are in trend; Have an   automatic lots ca
        Oracle
        Denis Sotnikov
        5 (2)
        Эксперт - торговый помощник, созданный по одноимённой торговой стратегии Оракул в сотрудничестве с ее автором Нео. Определяет на графиках в автоматическом режиме разворотные импульсные модели и строит по ним Вилки Нео - авторский инструмент, позволяющий определять циклы движения цены и указывающий на ожидаемую цель TakeProfit . Поиск ведется на всех заданных периодах графиков одновременно с фильтрацией совпадений. Осуществляется фильтрация неверных Вилок с указанием кода ошибки. Утилита имеет
        SystemLiveMxPips
        Harold Alonso Hernandez
        Automatice sus estrategias comerciales con nuestra sencilla herramienta de creación de estrategias "similar a un rompecabezas".   Cree fácilmente estrategias que operen por usted en modo de piloto automático.   También puede cargar estrategias creadas por otras personas, como la clásica   Estrategia Martingala,   para usarla como muestra para su propia estrategia. Características clave Cree su estrategia a través de funciones simples de arrastrar y soltar, sin necesidad de conocimientos de pro
        Binance Full Trader
        Arash Rezaeian
        2 (1)
        Binance Full Trader is developed for connection to your Binance account and get data, draw price charts and trade easily with any strategy by an indicator. A user-friendly interface has developed for it and has tried to give access to the necessary information such as open orders and wallet balances. ·        There are two sample indicators (one for trade signal and another for price) that you can download it from these links: https://drive.google.com/file/d/1w2CGuu3rArWKMhS9LkepT9zhVkGR1AO7/vie
        作者的更多信息
        Gold n XAU MT5
        Pavel Verveyko
        The trading system is designed to work with gold on time periods: 30M, 1H. The indicator allows you to adjust to the market situation. Parameters for 1H :   PERIOD=9F ,   FILTER=300 .   Parameters for  30M :   PERIOD=22B ,   FILTER=450 .     A small adjustment to a specific broker is allowed .   If you change the amount of history displayed, you may also need to adjust the parameters. The indicator is not redrawn.     "Gold n XAU" uses different rules for entering a trade and different rules
        Length Movement
        Pavel Verveyko
        5 (1)
        Measures the length of the selected movement in points, shows the duration of the movement, as well as the speed of movement.   Outputs the average value of each dimension. It is designed to calculate the expected target based on typical market movements. The intended goal will provide information about the ratio of the stop size to the possible profit and will allow you not to open positions with a small expected profit. It will also help you determine the point at which it is more logical to c
        Ichimoku Map MT5
        Pavel Verveyko
        Ichimoku Map (instant look at the markets) - built on the basis of the legendary Ichimoku Kinko Hyo indicator. The task of the Ichimoku Map is to provide information about the market strength on the selected time periods and instruments, from the point of view of the Ichimoku indicator. The indicator displays 7 degrees of buy signal strength and 7 degrees of sell signal strength. The stronger the trend, the brighter the signal rectangle in the table. The table can be dragged with the mouse. The
        Turn
        Pavel Verveyko
        The indicator shows the market turning points (entry points). Reversals allow you to track rebound/breakout/testing from the reverse side of the lines of graphical analysis or indicators. Reversals can be an independent signal. The indicator allows you to determine reversals taking into account the trend and without it. You can choose a different period for the movement preceding the reversal, as well as the volatility coefficient. When plotting reversals, the indicator takes into account volati
        The indicator allows you to quickly switch from one instrument to another, from one time period to another using the keyboard or buttons on the monitor. Each command can be assigned a hot key from 0-9, a-Z (case-insensitive) and VK_OEM_COMMA ("<" on the keyboard) and VK_OEM_PERIOD (">" on the keyboard). This can help you to operate the maximum number of instruments that are available at your broker, analyze more instruments/periods in less time. This product cannot be tested in the tester , beca
        Ratio TP SL
        Pavel Verveyko
        5 (1)
        This indicator allows you to measure the profitability of each specific transaction (the ratio of Stop and Profit). The indicator allows you to adjust the ratio by step size and number of steps. You can build an unlimited number of ratios to compare the risks from different movements. Note: in MT4, the number of horizontal lines in a single ratio cannot exceed 32. Building a line : click the " Ratio " button and draw a line (mouse click - the first point of the line, where the mouse is release
        Corporate Report
        Pavel Verveyko
        5 (1)
        The script displays info about the share's corporate reports and dividends. The data is downloaded from   investing.com : Report date Profit per share (EPS) Revenue Market capitalization Amount of dividends Date of payment of dividends Dividend income The product cannot be tested in the tester (since it is not possible to receive data from the Internet). Before launching:  Add 2   URL   https://ru.investing.com/earnings-calendar/Service/getCalendarFilteredData  and   https://ru.investing.com/di
        Channel FTF
        Pavel Verveyko
        The Envelopes indicator determines the presence of a trend or flat. It has 3 types of signals, shows the probable retracement levels and levels of the possible targets. The Fibonacci coefficients are used in the indicator's calculations. Signals (generated when touching the lines or rebounding from lines): Trend - the middle line of the Envelopes has a distinct inclination; the lines below the channel's middle line are used for buy trades, the lines above the middle line and the middle line itse
        Mr Big
        Pavel Verveyko
        The indicator shows and highlights the chart candles, which are formed as a result of large players entering the market in large volumes. Such candles can also be formed after achieving a certainty on the market, when most of the participants hold positions in the same direction. The movement is likely to continue in that direction after such candles. The indicator highlights the significant candles from the existing ones on the chart; The indicator allows identifying the trends based on candles
        Splash
        Pavel Verveyko
        The indicator identifies the most suitable moment for entering the market in terms of market volatility, when the market has the strength to move (the signal is indicated by an arrow under the candle). For each of the signals, the presence of trends on the current and higher timeframes is determined, so that the signal is in the direction of the majority of positions opened on the market (denoted near the signal by abbreviations of timeframes with a trend present). The signal appears after the c
        The indicator displays the key support and resistance levels on the chart. The significance of these levels lies in that the price may reverse or strengthen the movement when passing such levels, since they are formed as a consequence of the natural reaction of market participants to the price movement, depending on which positions they occupied or did not have time to occupy. The psychology of the level occurrence: there always those who bought, sold, hesitated to enter or exited early. If the
        This indicator is a multitimeframe trading strategy. It has the levels for stop loss, take profit and entry point. The order level can also be set manually. The indicator uses the regularity of the market, which manifests itself on all instruments, and does not require adjustment of the parameters. The strategy uses a proprietary approach to determining: trend, volatility, hierarchy of timeframe significance, the size of the history period (the number of candles), which is important for making a
        Trend Sync
        Pavel Verveyko
        5 (1)
        The indicator shows the trend of 3 timeframes: higher timeframe; medium timeframe; smaller (current) timeframe, where the indicator is running. The indicator should be launched on a chart with a timeframe smaller than the higher and medium ones. The idea is to use the trend strength when opening positions. Combination of 3 timeframes (smaller, medium, higher) allows the trend to be followed at all levels of the instrument. The higher timeframes are used for calculations. Therefore, sudden change
        The indicator detects important peaks and troughs (extremes) on the chart. These points can be used to plot support/resistance levels and trend lines, as well as any other graphical analysis. These points can serve as reference points for setting trading orders. The indicator does not redraw . Settings: Size_History  - the size of the calculated history. Num_Candles_Right  - number of candles to the right of the peak or trough. Num_Candles_Left  - number of candles to the left of the peak or
        Running along Lines
        Pavel Verveyko
        3 (2)
        The indicator draws support and resistance lines on an important part of the chart for making decisions. After the trend line appears, you can trade for a breakout or rebound from it, as well as place orders near it. Outdated trend lines are deleted automatically. Thus, we always deal with the most up-to-date lines. The indicator is not redrawn . Settings: Size_History  - the size of the calculated history. Num_Candles_extremum  - the number of candles on each side of the extremum. Type_Arrow
        Key Volumes
        Pavel Verveyko
        1 (1)
        The indicator shows key volumes confirmed by the price movement. The indicator allows you to analyze volumes in the direction, frequency of occurrence, and their value. There are 2 modes of operation: taking into account the trend and not taking into account the trend (if the parameter Period_Trend = 0, then the trend is not taken into account; if the parameter Period_Trend is greater than zero, then the trend is taken into account in volumes). The indicator does not redraw . Settings History_S
        Catch Impulse
        Pavel Verveyko
        This trading system is based on market impulses of varying complexity.   To generate a signal, the indicator uses the moments when the direction of the pulse and the necessary section of the trend coincide. The indicator also takes into account the current market volatility. Stop_loss tags can be set with the parameter "0" or "1", then Stop_Loss will take into account market volatility.   Take_Profit tags can be set with the parameter "0", then Take_Profit will take into account market volatil
        Indexes
        Pavel Verveyko
        The stocks that make up the index are one of the drivers of the movement. Analyzing the financial performance of all elements of the index, we can assume further development of the situation. The program (script) displays corporate reports of shares that are part of the index selected in the settings.   "Indexes" cannot be tested in the tester (since there is no way to get information from the Internet). Information is downloaded from the site investing.com: Report Date Earnings per share (E
        Fibo World
        Pavel Verveyko
        The indicator builds a graphical analysis based on the Fibonacci theory. Fibo Fan is used for the analysis of the impulses and corrections of the movement. Reversal lines (2 lines at the base of the Fibonacci fan) are used to analyze the direction of movements. The indicator displays the of 4 the target line in each direction. The indicator takes into account market volatility. If the price is above the reversal lines, it makes sense to consider buying, if lower, then selling. You can open posi
        The indicator determines the state of the market: trend or flat. The state of the market is determined by taking into account volatility. The flat (trading corridor)is displayed in yellow. The green color shows the upward trend. The red color shows the downward trend. The height of the label corresponds to the volatility in the market. The indicator does not redraw . Settings History_Size   - the amount of history for calculation. Period_Candles  - the number of candles to calculate the indicat
        The indicator plots flexible support and resistance levels (dots). A special phase of movement is used for construction. Levels are formed dynamically, that is, each new candle can continue the level or complete it. The level can provide resistance or support to the price even where it is no longer there. Also, support and resistance levels can change roles. The importance of levels is affected by: the amount of time the level is formed and the number of touches. The significance of these lev
        The indicator is a trading system for short-term trading. Scalper Assistant helps to determine the direction of the transaction, and also shows the entry and exit points. The indicator draws two lines (possible points for opening positions). At the moment of the breakdown of the upper line up (and when all trading conditions are met), an up arrow appears (a buy signal), as well as 2 goals. At the moment of the breakdown of the lower line down (and when all trading conditions are met), a down ar
        Gold n XAU
        Pavel Verveyko
        The trading system is designed to work with gold on time periods: 30M, 1H. The indicator allows you to adjust to the market situation. Parameters for 1H :   PERIOD=9F ,   FILTER=300 .   Parameters for  30M :   PERIOD=22B ,   FILTER=450 .   A small adjustment to a specific broker is allowed .   If you change the amount of history displayed, you may also need to adjust the parameters. The indicator is not redrawn.     "Gold n XAU" uses different rules for entering a trade and different rules fo
        The indicator builds "psychological levels": levels of round numbers and intermediate levels of round numbers. Round numbers play an important role in forming support and resistance levels. There is a pattern in which the decline or growth of the price can stop at round numbers. The level whose price ends at 0 is the level of a round number of the first order. Intermediate level, this is the level between two round levels, for example, between 10 and 20 this is level 15. In the " Num_Zeros "
        Ichimoku Map
        Pavel Verveyko
        Ichimoku Map (instant look at the markets) - built on the basis of the legendary Ichimoku Kinko Hyo indicator. The task of the Ichimoku Map is to provide information about the market strength on the selected time periods and instruments, from the point of view of the Ichimoku indicator. The indicator displays 7 degrees of buy signal strength and 7 degrees of sell signal strength. The stronger the trend, the brighter the signal rectangle in the table. The table can be dragged with the mouse. The
        The indicator displays a stock chart of a non-standard type, in which the price and time have the same value. The usual chart of Japanese candlesticks does not take into account all the information that the time analysis can give. Renko charts do not use all the information that price can give in relation to time. The "Chart Price and Time" indicator takes into account price and time equally and shows the predominance of price or time. Taking into account price and time equally gives an idea
        The indicator tracks sharp volatility (moments when the market has shown increased activity and movement may occur), on the selected instruments and time periods. The information is displayed as colored rectangles. Thus, it is possible to assess at a glance which tool should be given priority attention. The indicator will be useful for scalpers when they need a quick reaction or for traders working with a large number of instruments. The indicator does not redraw. The indicator displays 8 degree
        Alert Creator
        Pavel Verveyko
        The Alert Creator indicator is designed to create alerts for selected conditions. You can select one or several indicators for the notification. If several conditions are selected, the alert is triggered when all the selected conditions are met. The signals can be configured separately for buying and separately for selling. Example, a buy alert: the closing price is above the moving average, the RSI is below 20. (In this example, 2 indicators are used to generate an alert: MA and RSI) At the
        Trend Arithmetic
        Pavel Verveyko
        The indicator determines the strength of the trend and its possible reversal points, based on the author's arithmetic approach . Each new peak or trough is a trend development. Such peaks and troughs are numbered so that the strength of the trend development can be seen. Attempts to change the trend are also numbered. This gives an understanding of a possible change in the direction of the trend. Indicator signals are generated when trying to change the trend . In the settings, it is possible
        Level Predictor
        Pavel Verveyko
        该指标绘制可能成为未来显着支撑位和阻力位的潜在水平。 该线越长,在该水平击穿后价格反转或价格变动增加的可能性就越高。 随着电平形成概率的降低,线的长度减小。 该指标不需要调整。 在设置中,您可以更改指示器的设计。 " Line_Length "按钮放置在图表上以调整线的长度(为了便于感知指标)。 所选的" Line_Length "设置将为每个时间段和仪器保存。 " Line_Length "按钮可以用鼠标拖动。 当悬停在按钮的左边缘时,它会用选定的颜色突出显示,按下时,数字会减少,指示线会缩短。 当您将鼠标悬停在按钮的右边缘时,它会以选定的颜色突出显示,按下时,数字会增加,指示线会延长。 _________________
        筛选:
        无评论
        回复评论