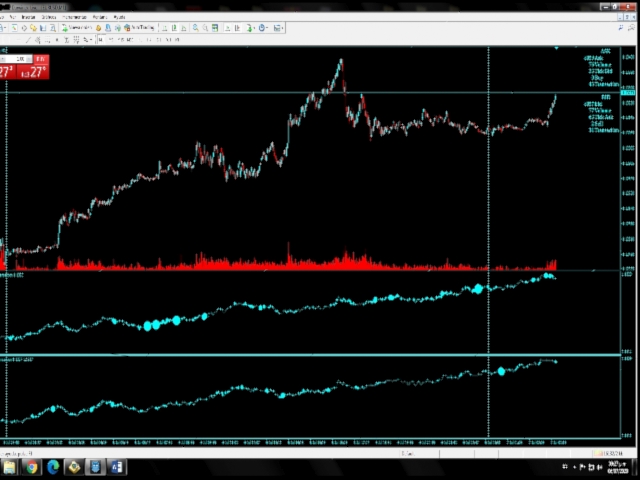
Tick Bid Transaction
- 지표
- 버전: 1.0
- 활성화: 5

Este indicador Tick Bid Transaction identifica las ventas que ofrece tu Broker. Relaciona el volumen “no real” y los Ticks de la demanda de un cierto modo, luego el algoritmo marca con un punto donde se realiza una transacción, según el tamaño del punto significa que la venta es mayor o menor o, hubo muchas ventas al mismo tiempo lo que nos dice que si el punto es muy grande es muy probable que el Activo baje como así también si hay una cierta acumulación de puntos de diferentes tamaños. Este indicador tiene que ser usado con el indicador Tick Ask Transaction que es lo mismo viceversa (volumen “no real” y los Ticks de la oferta) para que este completo y ver las compras. A veces marca con una estrella roja si los Ticks aumentan pero el volumen no o, si hubo una desconexión a internet, si no fue una desconexión se puede interpretar que hasta ahí llego la acumulación de las ventas. Es un indicador que no trabaja con historial sino sobre la acción del precio por eso es que no se puede testear en el Strategy Tester.