Price Action release

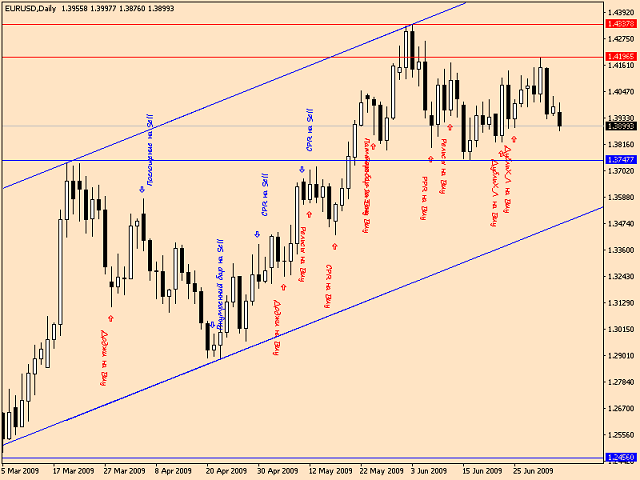
Indicator patterns Price Action. The indicator uses in its work 12 patterns, a trend channel and horizontal price lines (support and resistance lines). You can work both by channel and lines, or simply by patterns. Some patterns are customizable. Below is a small manual.


Period of candles: Set the period on which the indicator will work.

                                            Parameters of information on the chart

Consider trend and horizontal lines ?: The indicator can work on trend and horizontal price lines, or simply on patterns.

Do not take into account the trend and horizontal lines, but show them ?: The indicator will not take into account the trend and horizontal lines, but show them on the chart. If both parameters are set to “false”, only patterns will be shown on the graph.

Hide objects in the list of objects ?: When you call the window of the list of objects, objects, depending on the parameter, will appear in the list or not.

Delete objects from the chart at the end of the work ?: When removing the indicator from the chart, the indicator will clean up after itself, i.e. remove graphs, lines, arrows, fonts, etc.

Delete objects when new ones arrive ?: It means, the indicator will delete old objects of the same value from the chart when a new object appears. For example, when a new pin bar appears, the old pin bar of the same direction is deleted.

Enable alert ?: Enables or disables the alert window when a pattern is found.

                                        - Price line parameters -

The number of bars of the first point for the lines: The indicator draws horizontal price lines for the maximums and minimums of candles for a certain period, set in the indicator settings. Only 6 lines; 3 at the highs and 3 at the lows.

 The number of bars of the second point for the lines: Same as for the first.

The number of bars of the third point for the lines: Same as for the first.

Indent from lines: Indent patterns from horizontal lines. For example; if the pin-bar closed above or below 10 points (as indicated in the settings) from the line, then the pattern will be shown in the terminal, if less than 10, then the pin-bar will not be shown.

                                             - Channel parameters -

Number of bars in the first point channel: As for horizontal lines, the trend channel is built on the highs and lows of the candles for a certain period specified in the settings. The channel is built on two maxima and one minimum or two minima and one maximum.

Number of bars in the second point channel: Same as for the first one.

The channel width is more than the number of points: If the channel width is less than the points specified in the settings, the channel will not be redrawn.

                                                              Candle combinations

The display of all patterns can be turned on and off, you can combine them of your choice, you can generally leave one pattern in operation. Some patterns have their own settings.

 Inner bar

The difference in shadows is less than N points: The inner bar pattern implies that it is completely, along with the shadows, inside the previous bar. But according to the new trends of the system there are some assumptions, for example, a shadow, it may somewhat go beyond the shadow of the previous candle. This parameter "N" points just this adjusts.

Pin Bar

The nose is longer than the rest of the candle N times. the nose is longer than the body and the opposite shadow, taken together, as many times as specified in the settings; (for example, 2.3 two point three tenths, as indicated by default).

Rails

The bodies of candles are more than N points: The bodies of candles are combinations of rails, must be greater than or equal to the points specified in the parameters; (for example 66 as specified by default).

The difference in the height of bodies is less than N points: The prices for closing or opening neighboring candles should not exceed the size specified in the settings; (for example, 17 items, as specified by default).

Shadows fewer bodies N times: Ie shadows should be less than as many times as specified in the settings; (for example, 1, as indicated by default, 1 time, which means that they will be equal to or less than bodies).

For the same example, other patterns are configured.

Parameters where points are indicated are configured exactly in points and not in pips!
추천 제품
Auto Fibo Pro m
DMITRII GRIDASOV
"Auto FIBO Pro" Crypto_Forex 지표 - 거래에 유용한 보조 도구입니다! - 지표는 자동으로 Fibo 수준과 로컬 추세선(빨간색)을 계산하여 차트에 배치합니다. - Fibonacci 수준은 가격이 반전될 수 있는 주요 영역을 나타냅니다. - 가장 중요한 수준은 23.6%, 38.2%, 50%, 61.8%입니다. - 역전 스캘핑이나 존 그리드 거래에 사용할 수 있습니다. - Auto FIBO Pro 지표를 사용하여 현재 시스템을 개선할 수 있는 기회도 많습니다. - Info Spread Swap Display가 있습니다. 현재 Spread와 Swap이 부착된 외환 쌍을 표시합니다. - 디스플레이에는 계정 잔액, 자본 및 마진도 표시됩니다. - 차트의 어느 모서리에서나 Info Spread Swap Display를 찾을 수 있습니다. 0 - 왼쪽 상단 모서리, 1 - 오른쪽 상단, 2 - 왼쪽 하단, 3 - 오른쪽 하단. 여기를 클릭하여 고품질 트레이딩 로봇과
Rainbow Price Visualizer
Vincent Jose Proenca
Rainbow Price Visualizer v1.21 See where the market really breathes. Turns your MT4 chart into an ultra-precise heatmap that highlights price zones favored by big players. Why it matters 300 price levels at 0.2‑pip resolution — microscopic detail. 8 visual themes (Rainbow, Fire, Ocean…) for instant readibility. Smart opacity: low noise fades, real zones pop. Lightweight rendering with automatic cleanup. Fully customizable: saturation, opacity, resolution, history depth. Bands project into the f
Antabod Gamechanger
Rev Anthony Olusegun Aboderin
*Antabod GameChanger Indicator – Transform Your Trading!*   Are you tired of chasing trends too late or second-guessing your trades? The *Antabod GameChanger Indicator* is here to *revolutionize your trading strategy* and give you the edge you need in the markets!   Why Choose GameChanger? *Accurate Trend Detection* – GameChanger identifies trend reversals with *pinpoint accuracy*, ensuring you enter and exit trades at the optimal time.   *Clear Buy & Sell Signals* – No more guesswork! T
Trend Ray
Andriy Sydoruk
The indicator shows the potential trend direction by cyclical-wave dependence. Thus, all the rays of the intersection will be optimal rays, in the direction of which the price is expected to move, taking into account the indicator period. Rays can be used as a direction for potential market movement. But we must not forget that the approach must be comprehensive, the indicator signals require additional information to enter the market.
VR Cub
Vladimir Pastushak
VR Cub 은 고품질 진입점을 얻는 지표입니다. 이 지표는 수학적 계산을 용이하게 하고 포지션 진입점 검색을 단순화하기 위해 개발되었습니다. 지표가 작성된 거래 전략은 수년 동안 그 효율성을 입증해 왔습니다. 거래 전략의 단순성은 초보 거래자라도 성공적으로 거래할 수 있다는 큰 장점입니다. VR Cub은 포지션 개시 지점과 이익 실현 및 손절매 목표 수준을 계산하여 효율성과 사용 편의성을 크게 높입니다. 간단한 거래 규칙을 이해하려면 아래 전략을 사용한 거래 스크린샷을 살펴보세요. 설정, 세트 파일, 데모 버전, 지침, 문제 해결 등은 다음에서 얻을 수 있습니다. [블로그] 다음에서 리뷰를 읽거나 작성할 수 있습니다. [링크] 버전 [MetaTrader 5] 진입점 계산 규칙 포지션 개설 진입점을 계산하려면 VR Cub 도구를 마지막 최고점에서 마지막 최저점까지 늘려야 합니다. 첫 번째 지점이 두 번째 지점보다 빠른 경우, 거래자는 막대가 중간선 위에서 마감될 때까지 기다립니다
Alpha Trend sign has been a very popular trading tool in our company for a long time. It can verify our trading system and clearly indicate trading signals, and the signals will not drift. Main functions: Based on the market display of active areas, indicators can be used to intuitively determine whether the current market trend belongs to a trend market or a volatile market. And enter the market according to the indicator arrows, with green arrows indicating buy and red arrows indicating se
Super Reversal Pattern
Parfait Mujinga Ndalika
Super Reversal Pattern Indicator Unlock the power of advanced pattern recognition with our Super Reversal Pattern Indicator. Designed for traders seeking precision and reliability, this indicator identifies one of the most effective reversal patterns in technical analysis, offering a significant edge in your trading strategy. Key Features: Non-Repainting Accuracy: Enjoy the confidence of non-repainting technology. Once a Super Reversal Pattern is detected, it remains static, providing consiste
Koala Supply Demand
Ashkan Hazegh Nikrou
5 (3)
MetaTrader 4용 Koala 공급 수요 지표 소개 (긍정적이든 부정적이든 귀하의 리뷰나 피드백을 공유하여 다른 트레이더가 귀하의 경험을 통해 이익을 얻을 수 있도록 해주세요.) : 코알라 공급 및 수요 지표에 오신 것을 환영합니다. 이 지표는 끊임없는 공급 및 수요 지역을 식별하기 위해 설계되었습니다. 이 지표는 트레이더가 시장을 지역 영역으로 볼 수 있도록 도와주며 가격이 어떻게 강력한 지역을 존중하는지 확인할 수 있습니다. 또한 이 지표는 지역 내에서 형성된 가격 행동 신호를 보여줄 수도 있습니다.  코알라 트레이딩 솔루션 채널 에 가입하여 모든 코알라 제품에 대한 최신 소식을 확인하십시오. 가입 링크는 다음과 같습니다: https://www.mql5.com/en/channels/koalatradingsolution https://www.mql5.com/en/blogs/post/755700 !중요 : 이 제품에는 무료 전문가 고문 (EA)가 포함되어 있습니다. 구매 후
FREE
MT4용 Crypto_Forex 지표 "3 Black Crows 패턴", 리페인트 없음, 지연 없음. - "3 Black Crows 패턴" 지표는 가격 변동 거래에 매우 효과적입니다. - 이 지표는 차트에서 하락세 "3 Black Crows" 패턴을 감지합니다. 차트에 빨간색 화살표 신호가 나타납니다(그림 참조). - PC, 모바일 및 이메일 알림 기능을 제공합니다. - 형제 지표인 상승세 "3 White Soldiers 패턴" 지표도 이용 가능합니다(아래 링크 참조). - "3 Black Crows 패턴" 지표는 지지/저항선과 함께 사용하기에 매우 좋습니다. 여기를 클릭하여 고품질 트레이딩 로봇과 지표를 확인하세요! 이 제품은 MQL5 웹사이트에서만 제공되는 오리지널 상품입니다.
Laser Trend
Nicolas Zouein
The trend is your friend! This is what this indicator is all about. Follow this famous saying and be safe. Characteristics: Buy/Sell signals fixed on the close of a bar. Works on all symbols and all timeframes. Clear visual market trend laser line, Buy/Sell signal arrows, market strength meter, TP1 & TP2 boxes. Visual signals when to enter, when to exit the market. No repainting. Compatible with Flexible EA for trading automation. (Ask for a free set file optimized to perform 2010-2018) Parame
Crypto_Forex 지표 "Morning Star pattern" for MT4. - 지표 "Morning Star pattern"은 가격 액션 거래에 매우 강력한 지표입니다. 다시 칠할 필요 없고 지연도 없습니다. - 지표는 차트에서 강세 Morning Star 패턴을 감지합니다. 차트에 파란색 화살표 신호가 있습니다(그림 참조). - PC, 모바일 및 이메일 알림이 있습니다. - 또한 형제인 약세 "Evening Star pattern" 지표도 사용할 수 있습니다(아래 링크를 따라가세요). - 지표 "Morning Star pattern"은 지지/저항 수준과 결합하기에 매우 좋습니다. 여기를 클릭하여 고품질 트레이딩 로봇과 지표를 확인하세요! 이것은 이 MQL5 웹사이트에서만 제공되는 오리지널 제품입니다.
Indicator. "Indicator wave or Indicator Ma". Using 23 standard indicators and the author's algorithm, the levels of purchases (from 0 to +100) and sales (from 0 to -100) are calculated. Then, using the calculated levels, the "Wave Indicator" draws a wave with 21 moving averages. The wave number is equal to the averaging period of the calculated levels. Waves # 1 - 7 Fast Moving Averages Waves from No. 8 -14 moving averages Waves from No. 15-21 slow moving averages Looking at the figures drawn
The indicator detects and displays 3 Drives harmonic pattern (see the screenshot). The pattern is plotted by the extreme values of the ZigZag indicator (included in the resources, no need to install). After detecting the pattern, the indicator notifies of that by a pop-up window, a mobile notification and an email. The indicator highlights the process of the pattern formation and not just the complete pattern. In the former case, it is displayed in the contour triangles. After the pattern is com
Mirror
Stanislav Korotky
This indicator predicts rate changes based on the chart display principle. It uses the idea that the price fluctuations consist of "action" and "reaction" phases, and the "reaction" is comparable and similar to the "action", so mirroring can be used to predict it. The indicator has three parameters: predict - the number of bars for prediction (24 by default); depth - the number of past bars that will be used as mirror points; for all depth mirroring points an MA is calculated and drawn on the ch
Trendiness Index
Libertas LLC
5 (3)
"The trend is your friend" is one of the best known sayings in investing, because capturing large trendy price movements can be extremely profitable. However, trading with the trend is often easier said than done, because many indicators are based on price reversals not trends. These aren't very effective at identifying trendy periods, or predicting whether trends will continue. We developed the Trendiness Index to help address this problem by indicating the strength and direction of price trend
Trend Scanner
Vladimir Kalendzhyan
4.33 (6)
By purchasing this indicator, you have the right to receive a free copy of one of   my other indicator's or advisor’s!  (All future updates are included. No limits) . To get it , please contact me by  mql5 message ! The Trend Scanner trend line indicator displays the trend direction and its changes. The indicator works on all currency pairs and  timeframes. The indicator simultaneously displays multiple readings on the price chart: the support and resistance lines of the currency pair, the exist
KT Renko Patterns MT4
KEENBASE SOFTWARE SOLUTIONS
2.33 (3)
KT Renko Patterns는 렌코 차트를 벽돌 하나하나 분석하여, 전 세계 다양한 금융 시장에서 트레이더들이 자주 사용하는 유명한 차트 패턴들을 찾아냅니다. 시간 기반 차트와 비교하면, 렌코 차트는 시각적으로 단순하고 깔끔하여 패턴 중심의 트레이딩이 훨씬 쉽게 가능합니다. KT Renko Patterns에는 다양한 렌코 패턴이 포함되어 있으며, 이 중 상당수는 Prashant Shah의 저서 『Profitable Trading with Renko Charts』에서 자세히 설명되어 있습니다. KT Renko Patterns 인디케이터를 기반으로 한 100% 자동화된 EA는 여기에서 이용할 수 있습니다 - KT Renko Patterns EA . 기능 소개 최대 8개의 명확한 렌코 패턴을 거래할 수 있어, 혼동 없이 신뢰도 높은 트레이딩이 가능합니다. 객관성을 제공하기 위해 각 패턴에는 손절선과 피보나치 목표가 함께 제공됩니다. KT Renko Patterns는 각 패턴의 정
"Adjustable Fractals Pro"는 프랙탈 지표의 고급 버전으로, 매우 유용한 거래 도구입니다! - 알다시피 표준 프랙탈 mt4 지표에는 설정이 전혀 없습니다. 이는 거래자에게 매우 불편합니다. - Adjustable Fractals Pro는 이 문제를 해결했습니다. 필요한 모든 설정이 있습니다. - 지표의 조정 가능한 기간(권장 값 - 7 이상). - 가격의 고점/저점으로부터의 조정 가능한 거리. - 프랙탈 화살표의 조정 가능한 디자인. - Info Spread Swap Display가 있습니다. 현재 스프레드와 외환 페어의 스왑을 첨부된 위치에 표시합니다. - 디스플레이에는 계정 잔액, 자본 및 마진도 표시됩니다. - 차트의 어느 모서리에서나 Info Spread Swap Display를 찾을 수 있습니다. 0 - 왼쪽 상단 모서리, 1 - 오른쪽 상단, 2 - 왼쪽 하단, 3 - 오른쪽 하단. - 표시기에는 모바일 및 PC 알림 기능이 내장되어 있습니다. 여기를
FreqoMaster
Stanislav Korotky
The main idea of this indicator is rates analysis and prediction by Fourier transform. The indicator decomposes exchange rates into main harmonics and calculates their product in future. The indicator shows 2 price marks in history, depicting price range in the past, and 2 price marks in future with price movement forecast. Buy or sell decision and take profit size are displayed in a text label in the indicator window. The indicator uses another indicator as an engine for calculations - FreqoMet
Indicador Taurus All4
Fabio Oliveira Magalhaes
Taurus All4 Taurus All4 is a high-performance indicator, it will tell you the strength of the trend, and you will be able to observe the strength of the candle. Our indicator has more than 4 trend confirmations. It is very simple and easy to use. Confirmation Modes Candle Trend Confirmations: When the candle switches to light green the trend is high. When the candle switches to light red the trend is reverting down. When the candle changes to dark red the trend is low. Trendline Trend Confirm
Spread and Close MT4
Alexander Denisovich Jegorov
Spread & Candle Close Timer Indicator for MT4  Optimize your trading with this lightweight and efficient indicator, designed to display the real-time spread and candle close countdown directly on your MT4 chart. Features: Live Spread Monitoring – Instantly see market conditions. Candle Close Timer – Stay prepared for the next price movement. Simple & Non-Intrusive Design – No unnecessary settings, just clear and accurate data. Ideal for scalpers, day traders, and those who need real-time exec
Infinity Trend Pro
Yaroslav Varankin
1 (1)
This is a trend indicator without redrawing Developed instead of the binary options strategy (by the color of the Martingale candlestick) Also works well in forex trading When to open trades (binary options) A signal will appear in the place with a candle signaling the current candle It is recommended to open a deal for one candle of the current timeframe M1 and M5 When a blue dot appears, open a deal up When a red dot appears, open a trade down. How to open trades on Forex. When a signal is rec
PZ Support Resistance
PZ TRADING SLU
3.33 (3)
Unlock key market insights with automated support and resistance lines Tired of plotting support and resistance lines? This is a multi-timeframe indicator that detects and plots supports and resistance lines in the chart with the same precision as a human eye would. As price levels are tested over time and its importance increases, the lines become thicker and darker, making price leves easy to glance and evaluate. [ Installation Guide | Update Guide | Troubleshooting | FAQ | All Products ] Boos
Distinctive
Tatiana Savkevych
Distinctive is a forex trending arrow indicator for identifying potential entry points. I like it, first of all, because it has a simple mechanism of work, adaptation to all time periods and trading tactics. Created on the basis of a regression channel with filters. Plotting the Lawrence indicator signals on a price function chart using a mathematical approach. How it works - when the price breaks out in the overbought / oversold zone (channel levels), a buy or sell signal is generated. Everyt
ZhiBiCCI MT4
Qiuyang Zheng
[ZhiBiCCI] indicators are suitable for all cycle use, and are also suitable for all market varieties. [ZhiBiCCI] Green solid line is a reversal of bullish divergence. The green dotted line is a classic bullish divergence. [ZhiBiCCI] The solid line to the red is a reverse bearish divergence. The red dotted line is a classical bearish divergence. [ZhiBiCCI] can be set in the parameters (Alert, Send mail, Send notification), set to (true) to send instant signals to the alarm window, email, insta
Chart Patterns Detect 15 patterns (Ascending Triangle, Descending Triangle, Rising Wedge, Falling Wedge, Bullish Flag, Bearish Flag, Bullish Rectangle, Bearish Rectangle Symmetrical triangle, Head and Shoulders, Inverted Head and Shoulders, Triple top, Triple Bottom, Double Top, Double Bottom) Use historical data to calculate the probability of each pattern to succeed (possibility to filter notification according to the chance of success) gives graphic indication about the invalidation level and
Supply Demand WTC
Stefano Cocconi
Check My Product Contact me to discover all my services  Supply and demand zones are one of the most basic things a beginner forex trader learns. These zones are so important, price reacts off of them even after years since they first developed. And with the supply and demand zones indicator, a forex trader might not need to worry about drawing all these historical zones one after the other. The supply and demand zone indicator accurately draws the supply and demand zones of a currency pair o
RenkoMaStoch
Sergey Deev
1 (1)
The indicator displays renko bars on a chart, uses them to plot the fast and slow moving average and Stochastic, as well as it provides buy/sell signals: a buy signal is generated when the fast moving is above the slow one, and the signal line of Stochastic crosses the lower level from bottom up; a sell signal is generated when the fast moving is below the slow one, and the signal line of Stochastic crosses the upper level from top to bottom; Renko is a non-trivial price display method. Instead
QuantumEdge Trader
Hossam Ali Ahmed Ali
QuantumEdge Trader v1.0 AI-Powered Precision Signals for Serious Traders QuantumEdge Trader is a smart and reliable indicator that delivers accurate BUY and SELL signals using advanced market analysis and trend detection. Designed for M1 to M60 timeframes, it's ideal for scalping and intraday strategies. --- Key Features: No Repaint – Signals never change after appearing Smart trend filters to reduce noise Adjustable sensitivity and alerts Perfect for XAUUSD, EURUSD, and m
Auto Optimized RSI
Davit Beridze
5 (2)
Auto Optimized RSI: 전문가용 시장 적응형 시스템 대부분의 트레이더가 실패하는 이유는 역동적인 시장에서 고정된 도구를 사용하기 때문입니다. 모든 차트에서 70/30과 같은 고정된 RSI 레벨을 사용하는 것은 수학적 오류입니다. 논리적 근거가 없는 단순한 "마법 화살표"를 찾고 계신다면, 이 지표는 적합하지 않습니다. 본 도구는 '최적화만이 트레이딩 생존의 유일한 열쇠'임을 이해하는 전문가들을 위해 설계되었습니다. 일반적인 지표들은 당신이 거래하는 종목이나 타임프레임을 고려하지 않습니다. Auto Optimized RSI 는 다릅니다. 과거 데이터를 기반으로 내부 시뮬레이션을 수행하여, 최근 시장에서 가격이 실제로 반전되었던 정확한 레벨을 찾아냅니다. 이것은 추측이 아니라 계산입니다. 기술적 우위: 자가 적응형 로직: 현재 시장 변동성에 따라 매수/매도 구역을 자동으로 재계산합니다. 수학적 검증: 승률(Win Rate), 드로다운(Drawdown), 평균 손익 등의 퍼포
이 제품의 구매자들이 또한 구매함
Scalper Inside PRO
Alexey Minkov
4.74 (69)
Scalper Inside PRO – Since 2020. An exclusive indicator that utilizes an innovative algorithm to swiftly and accurately determine the market trend. The indicator automatically calculates opening, closing, and profit levels, providing detailed trading statistics. With these features, you can choose the most appropriate trading instrument for the current market conditions. Additionally, you can easily integrate your own arrow indicators into Scalper Inside Pro to quickly evaluate their statistics
Gann Made Easy
Oleg Rodin
4.83 (162)
Gann Made Easy 는 mr.의 이론을 사용하여 최고의 거래 원칙을 기반으로 하는 전문적이고 사용하기 쉬운 Forex 거래 시스템입니다. W.D. 간. 이 표시기는 Stop Loss 및 Take Profit Levels를 포함하여 정확한 BUY 및 SELL 신호를 제공합니다. PUSH 알림을 사용하여 이동 중에도 거래할 수 있습니다. 구매 후 거래 방법 안내 및 유용한 추가 지표를 무료로 받으시려면 저에게 연락주세요! 아마도 Gann 거래 방법에 대해 이미 여러 번 들었을 것입니다. 일반적으로 Gann의 이론은 초보자 거래자뿐만 아니라 이미 거래 경험이 있는 사람들에게도 매우 복잡한 것입니다. Gann의 거래 방식은 이론적으로 적용하기 쉽지 않기 때문입니다. 나는 그 지식을 연마하고 Forex 지표에 최고의 원칙을 적용하기 위해 몇 년을 보냈습니다. 표시기는 적용하기가 매우 쉽습니다. 차트에 첨부하고 간단한 거래 권장 사항을 따르기만 하면 됩니다. 지표는 지속적으로 시장 분석
M1 Sniper
Oleg Rodin
5 (22)
M1 SNIPER 는 사용하기 쉬운 거래 지표 시스템입니다. M1 시간대에 맞춰 설계된 화살표 지표입니다. 이 지표는 M1 시간대 스캘핑을 위한 단독 시스템으로 사용할 수 있으며, 기존 거래 시스템의 일부로도 사용할 수 있습니다. 이 거래 시스템은 M1 시간대 거래용으로 특별히 설계되었지만, 다른 시간대에도 사용할 수 있습니다. 원래는 XAUUSD와 BTCUSD 거래를 위해 이 방법을 설계했지만, 다른 시장 거래에도 유용하다는 것을 알게 되었습니다. 이 지표의 신호는 추세 방향과 반대로 거래될 수 있습니다. 저는 지표의 신호를 활용하여 양방향으로 거래할 수 있도록 돕는 특별한 거래 기법을 알려드립니다. 이 방법은 특별한 동적 지지선과 저항선 가격 영역을 활용하는 것을 기반으로 합니다. 구매하시면 M1 SNIPER 화살표 지표를 바로 다운로드하실 수 있습니다. 또한, 아래 스크린샷에 표시된 Apollo Dynamic SR 지표는 M1 SNIPER 도구를 사용하는 모든 사용자에게 무료로
GoldRush Trend Arrow Signal
Kirk Lee Holloway
5 (2)
GoldRush 트렌드 화살표 신호 GoldRush 트렌드 화살표 신호 지표는 XAU/USD 시장에서 고속 단기 스캘핑 트레이더를 위해 설계된 정밀한 실시간 트렌드 분석을 제공합니다. 1분 시간대에 특화되어 설계된 이 도구는 명확한 진입점을 표시하는 방향성 화살표를 제공하여 스캘퍼들이 변동성이 높은 시장 환경에서도 자신 있게 거래할 수 있도록 합니다. 이 지표는 PRIMARY 및 SECONDARY 경고 화살표로 구성됩니다. PRIMARY 신호는 추세 방향의 변화를 나타내는 흰색과 검은색 방향성 화살표이며, SECONDARY 신호는 PRIMARY 화살표가 지시하는 방향을 확인하고 잠재적인 거래 진입점을 표시하는 파란색과 빨간색 화살표입니다. 참고: 추세 방향이 변경된 후 PRIMARY 경고 화살표가 단 하나만 표시될 경우, 다수의 SECONDARY 파란색/빨간색 화살표가 표시될 수 있음을 유의해야 합니다. SECONDARY 신호는 신호 기준을 충족하는 어떤 캔들 이후에도 표시
PRO Renko System
Oleg Rodin
5 (30)
PRO Renko System 은 RENKO 차트 거래를 위해 특별히 고안된 매우 정확한 거래 시스템입니다. 이것은 다양한 거래 상품에 적용될 수있는 보편적 인 시스템입니다. 체계는 효과적으로 당신에게 정확한 반전 신호에 접근을 주는 소위 시장 소음을 중화합니다. 이 표시기는 사용하기가 매우 쉽고 신호 생성을 담당하는 매개 변수가 하나만 있습니다. 당신은 쉽게 당신의 선택의 어떤 무역 계기에 공구를 적응시킬 수 있고 renko 막대기의 크기. 나는 항상 당신이 내 소프트웨어로 수익성있게 거래 할 수 있도록 추가 지원을 제공 할 준비가되어 있습니다! 나는 당신에게 행복하고 수익성있는 거래를 기원합니다! 구매 후 저에게 연락하십시오! 내 렌코 차트 생성기를 보내드립니다. 또한 내 개인 권장 사항 및 시스템의 다른 모듈을 무료로 공유 할 것입니다!
Market Makers
Mohamed Hassan
5 (4)
After purchase, contact me privately to receive 1 month of free testing with EA Forex Proton! This advanced MT4 trading robot automatically executes signals from any MT4 indicator, including Market Makers. The latest version also includes AI integration, allowing each trade signal to be analyzed using Artificial Intelligence. Live Signal with EA Forex Proton: Click here Market Makers is a powerful price action trading system designed to identify high-probability Buy and Sell opportunities based
Advanced Supply Demand
Bernhard Schweigert
4.91 (300)
현재 40% 할인! 초보자나 전문 트레이더를 위한 최고의 솔루션! 이 보조지표는 우리가 다수의 독창적 기능과 새로운 공식을 통합한 독특하고 고품질이며 저렴한 거래 도구입니다. 이 업데이트를 통해 이중 시간대를 표시할 수 있습니다. 더 높은 TF를 표시할 수 있을 뿐만 아니라 차트 TF와 더 높은 TF 모두를 표시할 수 있습니다: 중첩 영역 표시. 모든 Supply Demand 트레이더들이 좋아할 것입니다. :) 중요한 정보 공개 Advanced Supply Demand의 잠재력을 극대화하려면 다음을 방문하십시오. https://www.mql5.com/ko/blogs/post/720245   진입 또는 목표의 명확한 트리거 포인트를 정확히 찾아냄으로 해서 거래가 어떻게 개선될지 상상해 보십시오. 새로운 알고리즘을 기반으로 매수자와 매도자 간의 잠재적인 불균형을 훨씬 더 쉽게 분간할 수 있습니다. 왜냐하면 가장 강한 공급영역과 가장 강한 수요 영역과 과거에 어떻게 진행 되었는지를(이전
Cyclic Impulse
Vitalyi Belyh
차트를 구조화하고 주기적인 가격 변동을 식별하는 기술 지표입니다. 모든 차트에서 작업할 수 있습니다. 다양한 유형의 알림. 그래프 자체에도 추가 화살표가 있습니다. 역사를 재구성하지 않고, 촛불을 닫는 작업에 임한다. M5 이상에서 권장되는 TF입니다. 사용 및 구성이 쉬운 매개변수입니다. 매개변수가 다른 2개의 지표를 사용하는 경우, 다른 지표 없이 해당 지표만 사용할 수 있습니다. 2개의 입력 매개변수가 있습니다 주기성과 신호 지속 시간 이 2개의 매개변수는 차트 구조의 처리와 관련이 있습니다. Cyclicity - 역전 주기가 얼마나 자주 바뀌는지 조절하고 주기를 매끄럽게 합니다. Signal duration - 최소 숫자에서는 가격 움직임의 충격을 감지하고, 최대 숫자에서는 장기적 추세 움직임을 감지합니다.. --------------------------------
NAM Divergences
NAM TECH GROUP, CORP.
5 (1)
MT4 Multi-timeframe Divergence and Overbougt/Oversold detection indicator. Features - Fully customizable on chart control panel, provides complete interaction. - Hide and show control panel wherever you want. - Real time information about non-capitalized divergences. - Real time information about overbougt / oversold situations. - Real time information about regular divergences. - Real time information about hidden divergences. - Oscillators available for divergences detection: AO, RSI, CCI, MA
Auto Optimized Parabolic RSI: 고급 3D 모멘텀 엔진 대부분의 개인 투자자용 보조지표는 시장의 변동성이 변하는 순간 무용지물이 되는 정적인 입력값에 의존하기 때문에 실패합니다. Auto Optimized Parabolic RSI는 자체적인 수학적 우위를 지속적으로 재계산하여 "보조지표 노후화" 문제를 해결하며, 기관급 퀀트 트레이딩의 적응력을 귀하의 MT5 터미널에 직접 제공합니다. 핵심 이점: 맞춤형 인메모리 3D 최적화   표준 자동 최적화 도구들은 일반적인 보조지표 호출로 터미널에 과부하를 일으켜 MT5 플랫폼을 멈추게 하는 경우가 많습니다. 이 도구는 이러한 병목 현상을 완전히 우회합니다. 맞춤형 네이티브 RAM 기반 계산기로 구축된 내부 엔진은 차트를 로드하거나 타임프레임을 변경할 때마다 빛처럼 빠른 3D 그리드 검색을 실행합니다. RSI 기간(주기), SAR 스텝(가속도) 및 SAR 최대치(속도 제한)를 동시에 스캔하여 플랫폼 지연 없이 수만 개의
Advanced Currency Strength28 Indicator
Bernhard Schweigert
4.91 (657)
현재 40% 할인 초보자 또는 전문가 트레이더를 위한 최고의 솔루션! 이 지표는 우리가 독점 기능과 새로운 공식을 통합했기 때문에 독특하고 고품질이며 저렴한 거래 도구입니다. 단 하나의 차트로 28 Forex 쌍의 통화 강도를 읽을 수 있습니다! 새로운 추세 또는 스캘핑 기회의 정확한 트리거 포인트를 정확히 찾아낼 수 있기 때문에 거래가 어떻게 개선될지 상상해 보십시오. 사용 설명서: 여기를 클릭  https://www.mql5.com/en/blogs/post/697384 그것이 첫 번째, 원본입니다! 쓸모없는 지망생 클론을 사지 마십시오. 더 스페셜  강력한 통화 모멘텀을 보여주는 하위 창의 화살표 GAP가 거래를 안내합니다! 기본 또는 호가 통화가 과매도/과매도 영역(외부 시장 피보나치 수준)에 있을 때 개별 차트의 기본 창에 경고 표시가 나타납니다. 통화 강도가 외부 범위에서 떨어질 때 풀백/반전 경고. 교차 패턴의 특별 경고 추세를 빠르게 볼 수 있는 다중 시간
Dynamic Scalper System
Vitalyi Belyh
5 (1)
" Dynamic Scalper System " 지표는 추세 파동 내에서 스캘핑 방식으로 거래하도록 설계되었습니다. 주요 통화쌍 및 금에서 테스트되었으며, 다른 거래 상품과의 호환성이 가능합니다. 추가적인 가격 변동 지원을 통해 추세에 따라 단기 포지션 진입 신호를 제공합니다. 지표의 원리 큰 화살표는 추세 방향을 결정합니다. 작은 화살표 형태의 스캘핑 신호를 생성하는 알고리즘은 추세 파동 내에서 작동합니다. 빨간색 화살표는 상승 방향을, 파란색 화살표는 하락 방향을 나타냅니다. 민감한 가격 변동선은 추세 방향으로 그려지며, 작은 화살표의 신호와 함께 작용합니다. 신호는 다음과 같이 작동합니다. 적절한 시점에 선이 나타나면 진입 신호가 형성되고, 선이 있는 동안 미결제 포지션을 유지하며, 완료되면 거래를 종료합니다. 권장되는 작업 시간대는 M1~H4입니다. 화살표는 현재 캔들에 형성되며, 다음 캔들이 이미 시작되었더라도 이전 캔들의 화살표는 다시 그려지지 않습니다. 입력 매개
Advanced Currency IMPULSE with ALERT
Bernhard Schweigert
4.9 (490)
현재 40% 할인!! 초보자 또는 전문가 트레이더를 위한 최고의 솔루션! 이 지표는 우리가 독점 기능과 비밀 공식을 통합했기 때문에 독특하고 고품질이며 저렴한 거래 도구입니다. 단 하나의 차트로 28개 통화 쌍 모두에 대한 경고를 제공합니다. 새로운 추세 또는 스캘핑 기회의 정확한 트리거 포인트를 정확히 찾아낼 수 있기 때문에 거래가 어떻게 개선될지 상상해 보십시오! 새로운 기본 알고리즘을 기반으로 구축되어 잠재적인 거래를 훨씬 더 쉽게 식별하고 확인할 수 있습니다. 이는 통화의 강세 또는 약세가 가속되는지 여부를 그래픽으로 표시하고 가속 속도를 측정하기 때문입니다. 자동차의 속도계처럼 생각하면 됩니다. 가속화할 때 Forex 시장에서 동일한 일이 분명히 더 빠르게 발생합니다. 즉, 반대 방향으로 가속화되는 통화를 페어링하면 잠재적으로 수익성 있는 거래를 식별한 것입니다. 통화 모멘텀의 수직선과 화살표가 거래를 안내합니다! 역동적인 Market Fibonacci 23 레벨은
Currency Strength Wizard
Oleg Rodin
4.85 (59)
통화 강도 마법사는 성공적인 거래를 위한 올인원 솔루션을 제공하는 매우 강력한 지표입니다. 표시기는 여러 시간 프레임의 모든 통화 데이터를 사용하여 이 또는 해당 외환 쌍의 힘을 계산합니다. 이 데이터는 특정 통화의 힘을 확인하는 데 사용할 수 있는 사용하기 쉬운 통화 지수 및 통화 전력선의 형태로 표시됩니다. 필요한 것은 거래하려는 차트에 표시기를 부착하는 것뿐입니다. 표시기는 거래하는 통화의 실제 강세를 보여줍니다. 지표는 또한 추세와 거래할 때 유리하게 사용할 수 있는 구매 및 판매 거래량 압력의 극한값을 보여줍니다. 지표는 또한 피보나치에 기반한 가능한 대상을 보여줍니다. 표시기는 PUSH 알림을 포함한 모든 유형의 알림을 제공합니다. 구매 후 연락주세요. 나는 당신과 거래 팁을 공유하고 당신에게 무료로 훌륭한 보너스 지표를 줄 것입니다! 나는 당신에게 행복하고 유익한 거래를 기원합니다!
Apollo SR Master
Oleg Rodin
5 (2)
Apollo SR Master는 지지/저항 구간에서의 거래를 더욱 쉽고 안정적으로 만들어 주는 특수 기능을 갖춘 지지/저항 지표입니다. 이 지표는 지역 가격의 고점과 저점을 감지하여 시간 지연 없이 실시간으로 지지/저항 구간을 계산합니다. 새롭게 형성된 저항 구간을 확인하기 위해 지표는 해당 저항 구간을 실제 매도 또는 매수 신호로 활용할 수 있음을 나타내는 특수 신호를 표시합니다. 이 경우, 저항 구간의 강도가 높아지고, 따라서 저항 구간에서의 성공적인 거래 가능성도 높아집니다. 이것이 바로 이 지표의 핵심 아이디어입니다. SR 존은 손절매와 이익실현을 더욱 쉽게 할 수 있도록 해줍니다. 신호 방향에 따라 SR 존 위 또는 아래 공간을 손절매로 활용할 수 있습니다. 또한, 반대쪽 SR 존은 잠재적 이익실현 영역으로 활용할 수 있습니다. 또한 Apollo SR Master 지표를 사용하는 모든 사용자에게 "Apollo Price Action System" 지표를 무료로 제공합니다.
Scalping Lines System - 은 M1-H1 시간 프레임에서 금(XAUUSD) 자산을 거래하기 위해 특별히 설계된 스캘핑 트레이딩 시스템입니다. 추세, 변동성, 과매수/과매도 시장 분석 지표를 하나의 오실레이터로 통합하여 단기 신호를 식별합니다. 신호선의 주요 내부 매개변수는 사전 설정되어 있습니다. "Trend Wave Duration"은 이동평균선 추세를 사용하여 추세 방향으로 일련의 신호 지속 시간을 조절하고, "Apply Smoothing to Signal Line"은 신호선 생성 방식을 조정하는 매개변수로, 수동으로 조정할 수 있습니다. 시가에서 신호선을 계산할 때는 차트가 다시 그려지지 않습니다. 다른 가격대에서는 신호 화살표가 깜빡일 수 있습니다. 신호는 캔들 마감 후에 나타나며, 다양한 알림 유형을 사용할 수 있습니다. 권장 시간 프레임: M1, M5, M15, M30, H1. 이 지표는 원래 금 거래를 위해 설계되었지만, 스프레드가 낮은 변동성이
지진계 Marketquake Detector. Description in English : https://www.mql5.com/en/market/product/113869?source=Site+Market+Product+Page#description How to use the Seismograph : https://www.mql5.com/en/market/product/113869#!tab=comments&page=2&comment=52806941 Create an EA : https://www.mql5.com/en/market/product/113869#!tab=comments&page=3&comment=52816509 어떤 방식으로 거래하든 유동성이 낮은 시장에 진입하는 것을 피하고 싶을 것입니다.- 지진계는 시장 랠리 전에 시장에 진입할 수 있는 적절한 시기를 도와줄 것입니다. 그러나 바쁠 시장 시간에 진입을 확인했음에도 불구하고 많은 사람들이 유동성이 부족한 시
Trend Screener
STE S.S.COMPANY
4.79 (95)
트렌드 표시기, 트렌드 트레이딩 및 필터링을 위한 획기적인 고유 솔루션, 하나의 도구 안에 내장된 모든 중요한 트렌드 기능! Forex, 상품, 암호 화폐, 지수 및 주식과 같은 모든 기호/도구에 사용할 수 있는 100% 다시 칠하지 않는 다중 시간 프레임 및 다중 통화 표시기입니다. 기간 한정 특가: 지원 및 저항 스크리너 지표는 단 250 달러에 평생 제공됩니다. (원래 가격 65 달러) (제안 연장) Trend Screener는 차트에 점이 있는 화살표 추세 신호를 제공하는 효율적인 지표 추세 추종 지표입니다. 추세 분석기 표시기에서 사용할 수 있는 기능: 1. 트렌드 스캐너. 2. 최대 이익 분석이 있는 추세선. 3. 추세 통화 강도 측정기. 4. 경고가 있는 추세 반전 점. 5. 경고가 있는 강력한 추세 점. 6. 추세 화살표 Trend Screener Indicator가 있는 일일 분석 예, 일일 신호 성능...등은 여기에서 찾을 수 있습니다.   여기를 클릭하십시오.
Atomic Analyst
Issam Kassas
5 (5)
우선적으로 언급할 점은이 거래 지표가 다시 그리지 않고 지연되지 않으며 이를 통해 수동 및 로봇 거래 모두에 이상적이라는 점입니다. 사용자 매뉴얼: 설정, 입력 및 전략. Atomic Analyst는 가격의 강도와 모멘텀을 활용하여 시장에서 더 나은 이점을 찾는 PA Price Action Indicator입니다. 고급 필터를 장착하여 잡음과 거짓 신호를 제거하고 거래 잠재력을 높이는 데 도움이 됩니다. 복잡한 지표의 다중 레이어를 사용하여 Atomic Analyst는 차트를 스캔하고 복잡한 수학적 계산을 간단한 신호와 색상으로 변환하여 초보 트레이더가 이해하고 일관된 거래 결정을 내릴 수 있도록합니다. "Atomic Analyst"는 새로운 및 경험이 풍부한 트레이더를위한 종합적인 거래 솔루션입니다. 프리미엄 지표와 최고 수준의 기능을 하나의 거래 전략에 결합하여 모든 종류의 트레이더에 대한 다재다능한 선택지가되었습니다. 인트라데이 거래 및 스캘핑 전략 : 빠르고 정확한 일일
Supply and Demand Dashboard PRO
Bernhard Schweigert
4.8 (20)
현재 40% 할인! 이 대시보드는 여러 기호와 최대 9개의 타임프레임에서 작동하는 매우 강력한 소프트웨어입니다. 주요 지표(최상의 리뷰: 고급 공급 수요)를 기반으로 합니다.   Advanced Supply Demand 대시보드는 훌륭한 개요를 제공합니다. 다음과 같이 표시됩니다.  영역 강도 등급을 포함하여 필터링된 공급 및 수요 값, 영역에 대한/및 영역 내 Pips 거리, 중첩된 영역을 강조 표시하고 모든 (9) 시간 프레임에서 선택한 기호에 대해 4가지 종류의 경고를 제공합니다. 그것은 당신의 개인적인 필요에 맞게 고도로 구성 가능합니다! 당신의 혜택! 모든 트레이더에게 가장 중요한 질문: 시장에 진입하기에 가장 좋은 수준은 무엇입니까? 최고의 성공 기회와 위험/보상을 얻으려면 강력한 공급/수요 영역 내 또는 그 근처에서 거래를 시작하십시오. 손절매를 위한 최적의 장소는 어디입니까? 가장 안전하려면 강력한 수요/공급 구역 아래/위에 정류장을 두십시오.
Super Signal – Skyblade Edition 전문가용 노리페인트 / 노래그 트렌드 신호 시스템, 뛰어난 승률 제공 | MT4 / MT5용 1분, 5분, 15분과 같은 낮은 타임프레임에서 가장 좋은 성능을 보입니다. 핵심 기능: Super Signal – Skyblade Edition은 추세 매매를 위해 설계된 스마트 신호 시스템입니다. 이 시스템은 다중 필터 로직을 활용하여, 명확한 방향성과 실질적인 모멘텀이 수반된 고품질 추세만을 감지합니다. 이 시스템은 고점 또는 저점을 예측하지 않으며 , 다음 세 가지 조건이 모두 충족될 때만 신호를 발생시킵니다: 명확한 추세 방향 강화되는 모멘텀 건전한 변동성 구조 또한, 시장 세션 기반의 유동성 분석을 통해 신호의 신뢰성과 타이밍을 더욱 향상시킵니다. 신호 특성: 모든 화살표 신호는 100% 리페인트 없음 / 지연 없음 신호가 한 번 발생하면 고정되며, 깜빡이거나 사라지지 않음 차트 상의 시각적 화살표, 정보 패널, 팝업 알
Legacy of Gann
Pavel Zamoshnikov
4.83 (12)
The indicator very accurately determines the levels of the possible end of the trend and profit fixing. The method of determining levels is based on the ideas of W.D.Gann, using an algorithm developed by his follower Kirill Borovsky. Extremely high reliability of reaching levels (according to K. Borovsky  - 80-90%) Indispensable for any trading strategy – every trader needs to determine the exit point from the market! Precisely determines targets on any timeframes and any instruments (forex, met
Pytrader mt4 Python
Offpista LTD
5 (3)
Documentation for connecting Metatrader 4 with Python with a simple drag and drop EA.   A full end-to-end solution ,fully tested ,fast and efficient! The Pytrader ecosystem consists of a python script and a MT4 EA. (  MT5  version ) Further for the licensing an indicator is used.  The communication between the python script and the EA is based on sockets. EA is the  Server   and the python script the  Client .  It is always query(function / python script) and output(data / server). The EA doe
NextCandlePredictor No Repaint
Martin Alejandro Bamonte
NextCandlePredictor 지표 NextCandlePredictor는 다시 그리지 않으며, 색상이 변경되지 않고, 이동하지 않으며, 사라지지 않으며, 지연이 없는 알림이 있는 신호 지표입니다. 모든 타임프레임에서 다음 또는 다가오는 캔들의 방향을 식별하는 데 도움이 됩니다. 뉴욕, 런던 또는 둘 다 겹치는 고변동성 시장에 매우 권장됩니다. 주요 기능: 타임프레임의 유연성: M1에서 H1 이상까지 모든 타임프레임에서 빠르고 정확한 신호를 제공합니다. 명확한 매수/매도 신호: ADX의 DI+ 및 DI- 라인을 사용하여 명확한 매수 및 매도 신호를 생성하여 최고의 거래 결정을 내릴 수 있도록 합니다. 직관적인 시각화: 신호는 차트에 직접 녹색(매수) 및 빨간색(매도) 화살표로 표시되어 빠르고 쉽게 읽을 수 있습니다. 사용자 정의 가능한 설정: 분석할 막대 수와 경고 옵션을 선호도 및 거래 전략에 따라 조정합니다. 사용하려는 TF에 따른 제안표를 아래에서 확인하세요. 캔들 종료 시
Full Scalping Signal
Leandro Bernardez Camero
FullScalping 는 모든 시장에서 지속적인 스캘핑 진입 을 생성하도록 특별히 설계된 재그리기 없음, 역방향 그리기 없음 지표입니다. 끊임없는 액션을 찾는 공격적인 트레이더에게 완벽합니다! 독점 정보 및 업데이트를 받으려면 채널에 가입하세요: https://www.mql5.com/en/channels/forexnewadvisor 거의 모든 캔들 에서 신호를 제공하며, 트렌드를 확인하거나 주요 되돌림을 신호합니다. 지속적으로 당신을 안내하는 레이더와 같습니다. 작동 방식은? 매우 간단합니다: 빨간색 화살표 매도 거래에 진입. 파란색 화살표 매수 거래에 진입. 항상 일반적인 트렌드 방향으로 거래하고, 거래당 15-20핍 을 공격적으로 목표로 하며, 급격한 시장 반전 전에 빠르게 퇴장합니다. 신호는 지속적 이므로 거래 기회가 고갈되지 않습니다. 목표는 다음을 사용하여 집중적인 스캘핑 을 실행하는 것입니다: 높은 로트 낮은 스프레드(왼쪽 하단 모서리에 표시) 마지막 트렌
추측을 멈추세요. 통계적 우위로 트레이딩을 시작하세요. 주식 지수는 외환과 다르게 거래됩니다. 정해진 세션이 있고, 야간에 갭이 발생하며, 예측 가능한 통계적 패턴을 따릅니다. 이 지표는 DAX, S&P 500, 다우존스와 같은 지수를 자신 있게 거래하는 데 필요한 확률 데이터를 제공합니다. 무엇이 다른가 대부분의 지표는 무엇이 일어났는지 보여줍니다. 이 지표는 다음에 무엇이 일어날 가능성이 있는지 보여줍니다. 매 거래일마다 지표는 100일간의 과거 데이터를 기준으로 현재 설정을 분석합니다. 유사한 갭, 유사한 시가 위치를 가진 날을 찾고, 가격이 주요 레벨에 도달한 빈도를 정확히 계산합니다. 갭이 메워질지, 어제 고점이 테스트될지 더 이상 추측할 필요가 없습니다. 실제 데이터에 기반한 정확한 백분율을 얻게 됩니다. 모든 입력 설명이 포함된 전체 매뉴얼: https://www.mql5.com/en/blogs/post/766370 훌륭한 설정을 찾는 데 도움이 되는 전략 가이드: ht
Volatility Trend System - a trading system that gives signals for entries. The volatility system gives linear and point signals in the direction of the trend, as well as signals to exit it, without redrawing and delays. The trend indicator monitors the direction of the medium-term trend, shows the direction and its change. The signal indicator is based on changes in volatility and shows market entries. The indicator is equipped with several types of alerts. Can be applied to various trading ins
MENA Trend Indicator
Issam Kassas
4 (1)
Trend Scanner PRO First of all, it’s worth emphasizing that this trading system is 100% Non-Repainting, Non-Redrawing, and Non-Lagging , which makes it ideal for both   manual   and   algorithmic   trading setups. Online course, user manual, and downloadable presets included. The Trend Scanner Dashboard is a professional   multi pair scanner   that analyzes multiple symbols and timeframes at once, giving you an instant   market scanner   view of the real trend direction. Instead of switching ch
Trend indicator AI
Ramil Minniakhmetov
4.54 (84)
트렌드 인공 지능 지표는 실행 가능한 진입 점 및 반전 경고와 추세 식별을 결합하여 상인의 시장 분석을 향상시킬 훌륭한 도구입니다. 이 표시기는 사용자가 자신감과 정밀도로 외환 시장의 복잡성을 탐색 할 수 있도록 지원합니다 기본 신호 외에도 트렌드 인공 지능 지표는 풀백 또는 되돌림 중에 발생하는 2 차 진입 점을 식별하여 거래자가 기존 트렌드 내에서 가격 수정을 활용할 수 있도록합니다. 중요한 장점: ·작동 4 및 5 *명확한 구매 또는 판매 신호 *다시 칠하지 않습니다 *모든 자산에서 작동 나는 전보 사기에 개 또는 세트를 판매하지 않도록주의. 모든 설정은 블로그에 여기에 무료.  중요! 지침 및 보너스를 얻기 위해 구입 후 즉시 저에게 연락! 진짜 가동 감시는 뿐 아니라 나의 다른 제품 여기에서 찾아낼 수 있습니다: https://www.mql5.com/en/users/mechanic/seller&nbsp ; 설정 및 입력: 모든 자산에 대해 기본 설정을 권
Trend Sniper Super Indicator is one of the best indicator which can provide you will perfect signals for short term and long term trades. This indicator is suitable for both scalping and swing trading strategies. The indicator is over 85% accurate. It uses terminal Message Alerts, Emails and Push notifications to your mobile device to inform you about the new trading opportunities and it will calculate the take profit and stop loss level for you. All you will need to do is to place a trade. Subs
제작자의 제품 더 보기
FREE
Trading panel; “Assistant (A)” will help you to instantly place Buy, Sell, Buy Stop and Sell Stop orders for several pairs in a short period of time. The advantage of this panel is that orders are placed immediately with take profit , stop loss , Trailing and No loss restrictions, which, ultimately, has a good effect on your profit, lot and magik for orders, you can set in the corresponding parameters of the panel when adding it to schedule. Buy Stop and Sell Stop are placed with a certain offse
필터:
리뷰 없음
리뷰 답변