AIS Color Noise Filter
- 지표
- 버전: 1.0
- 활성화: 5

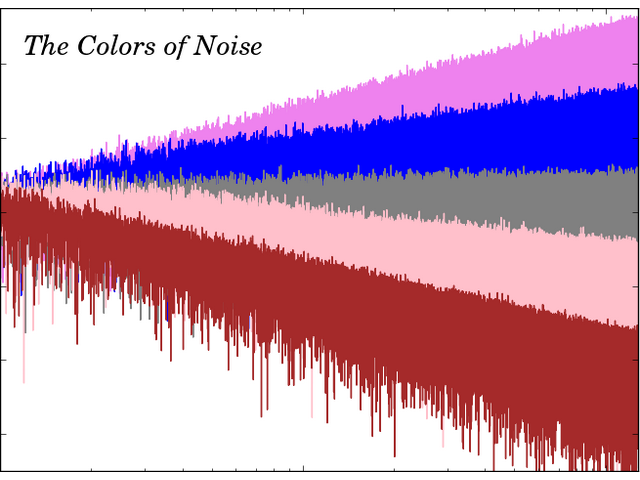
This indicator is more informative. His work is based on the assumption that the price movement in the market can be represented as
noise of a particular color, which depends on the parameters of the distribution of price values. Thanks to this, it is
possible to analyze the price change from different angles, and considering the price movement as noise of a particular
color, one can get information about the current state of affairs in the market and make a forecast about the price behavior.
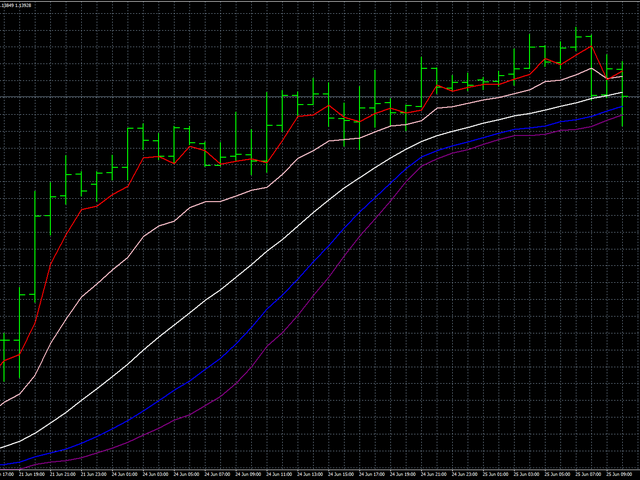
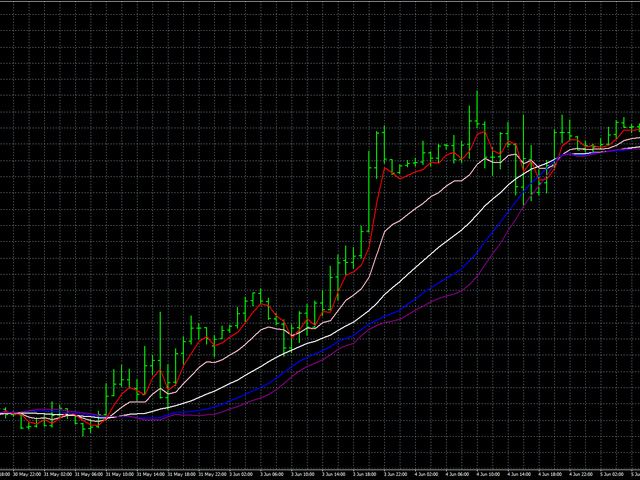
When analyzing the indicator readings, the position of the indicator lines is taken into account - they are located above or below
the opening price of the current bar and how far from it.
White noise (White Noise) - this approach is characterized by the fact that prices (both current and in prehistory) are considered to
be equal in power, which combines it with a simple moving average. The white noise signal is more likely confirming the
character - the more it deviates from the current price, the stronger the trend movement in the market. Conversely, if the
white noise line is close to the opening price, then this is evidence of either the end of the trend or the lateral price
movement.
Flicker Noise (Flicker Noise) outlines the upper or lower border of the trend (depending on whether the line passes above or below the
price). Also, the intersection of the line of this noise and the price of a currency pair may serve as evidence of the beginning
of a new trend, even a short-term one.
Brown Noise in its behavior in many ways resembles exponential smoothing. Due to this, the line of this noise follows the price, and
large deviations are possible only with some sudden and sudden changes in the market.
Blue Noise shows how strong the trends are against the current trend. With a large deviation of the blue noise line from the current
price, we can say that the trend has exhausted its strength and is close to completion.
Purple Noise shows how strong periodic or cyclical price movements are. The intersection of the purple noise line and the price chart
may indicate a change in market behavior — the end of one trend and the beginning of a new one. It should be remembered that the new
trend may remain the same as the previous one.
The only serious drawback of this indicator is that it processes information on the assumption of stationary price movement (this
assumption is not true, as we will see later), because of which it can be used only for short periods of time.
- LH is a parameter with which you can select how many preceding bars an indicator will be used for analysis. Its allowed value is 0 - 255, and the number of bars is one more than the value specified by this parameter.