Trend Line Finder
- 지표
- 버전: 1.1
- 업데이트됨: 20 1월 2021
- 활성화: 20

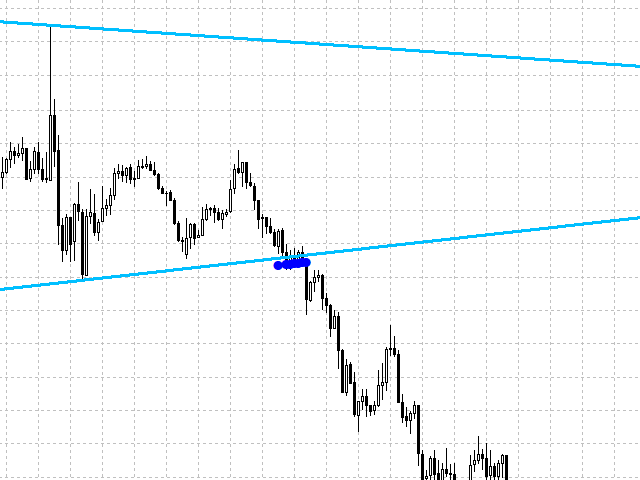
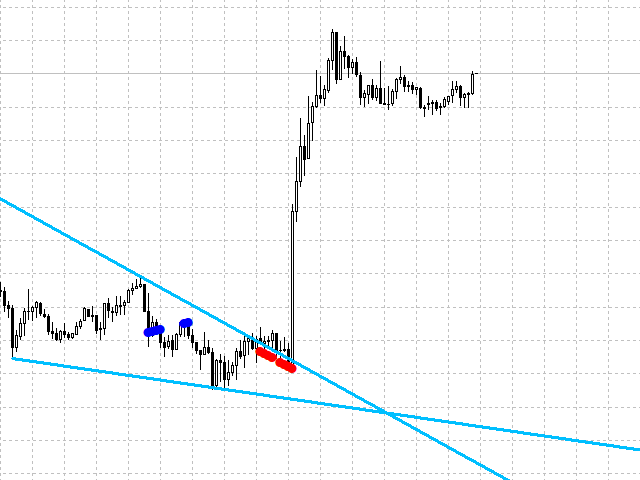
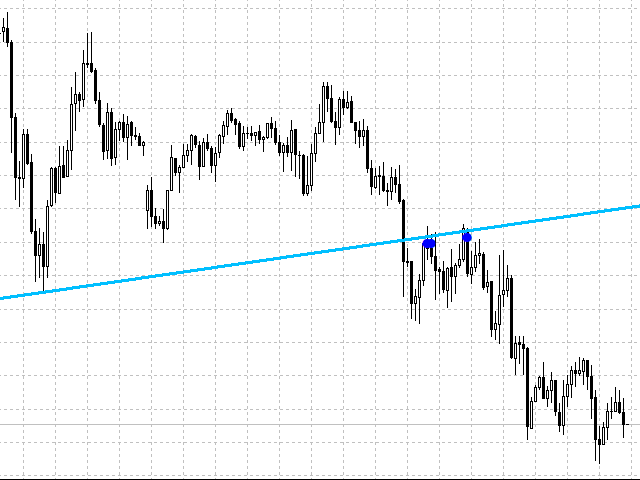
Trend Line Finder will project forward a support and resistance lines using 2 previous highs for resistance and 2 previous lows for support. It will then signal to the trader by alert making the trader more aware that a possible good move is about to happen.
This is not a stand-alone trading system but is very useful in finding key areas of support resistance levels where price will usually either rebound from or breakthrough. Its down to the trader to decide what to do with use of other systems.
Trading is all about buying and selling at the right time. Trend Line Finder will help the trader be more on top of this by making the trader more on top and alerted to key areas of market price.
Features :
- A way of recognising support and resistance levels
- Be ontop of good moves before they happen
- Send alerts to either your PC, eMail or mobile device
- Works on any timeframe
- No repainting or other such exagirated claims
- Choose your favourite line and signal arrow color
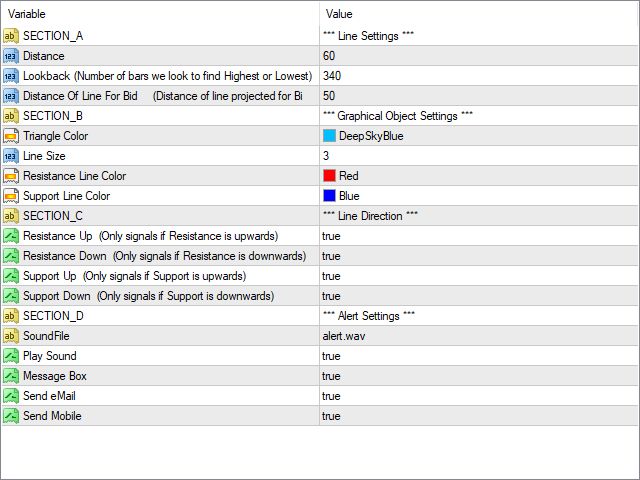
Settings :
Line Settings
- Lookback - The number of bars we search highest or lowest moving back from current.
- Distance - As we search back through bars from Lookback this is how many bars we look for our highest or lowest.
- Thickness Of Line - When Bid passes through line it must be within x points above and below the line for a signal to be made.
Graphical Object Settings
- Line Color - Color of line
- Line Size - Thickness of line
- Buy Arrow Color - Color of buy arrow
- Sell Arrow Color - Color of buy arrow
Line Direction
- Resistance Up - If true we allow signal when the resistance line is up.
- Resistance Down - If true we allow signal when the resistance line is down.
- Support Up - If true we allow signal when the support line is up.
- Support Down - If true we allow signal when the support line is down.

This is a good indicator, it has the option to check the market trend Breakout . Very reliable coding . You should have Fibo or your own strategy and this indicator helps you identify the change quickly . I want to thank Stephen for excellent service, professional job and the QUALITY of the indicator.