RangeBorder Buy Sell Non Repaint

  • 지표
  • Wartono
  • 버전: 1.20
  • 업데이트됨: 27 1월 2020
  • 활성화: 10

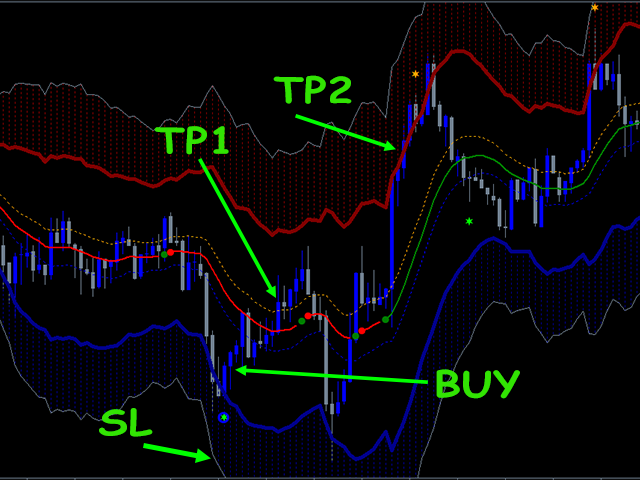
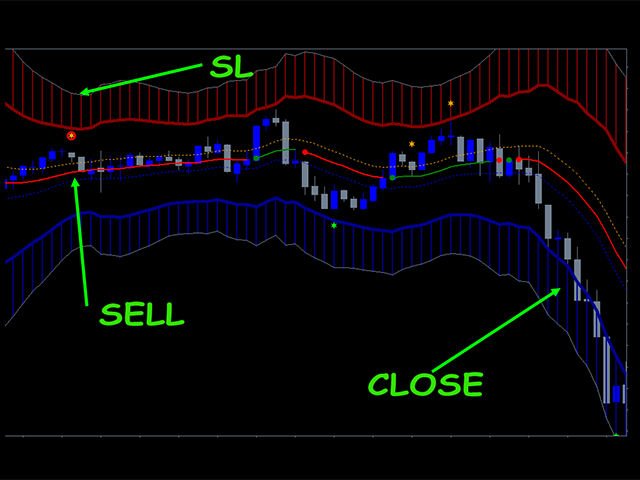
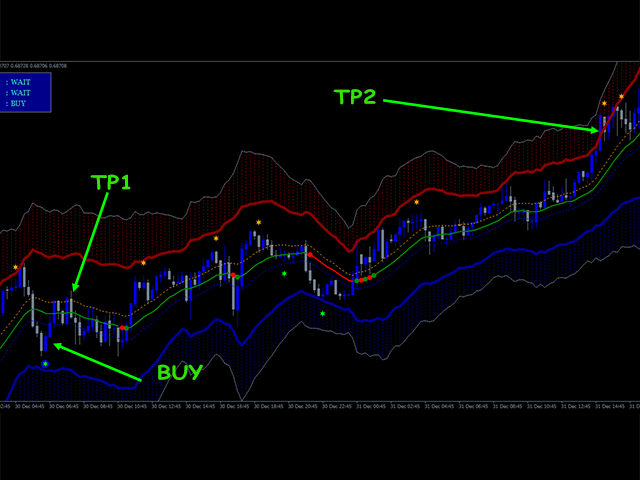
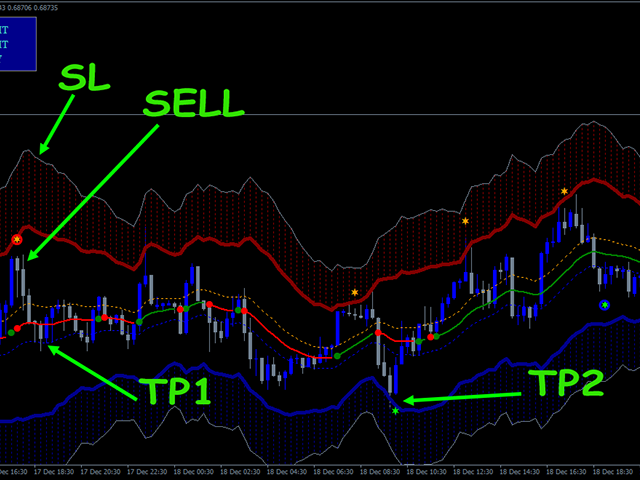
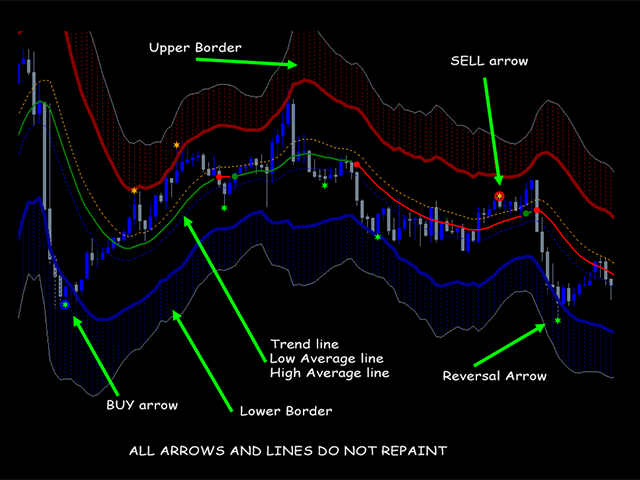
Some informations on the chart with the single attachment. RangeBorder Buy Sell (RBBS) Non Repaint Indicator will provide trend line, buy sell arrows,reversal arrows, range channel, order exit area,high average price line and low average price line.All arrows and lines don't repaint and not lagging. Once candle closed it won't  repaint.

Reading Indicator:

1. Small Stars , Indicates oversold and overbought with certain logic and price may reverse when this small star triggers. Useful to identify the current market price for entry or exit order.

2. Red and Blue Circle Arrows , They are entry signals. No repaint arrows once candle closed. This is the combination of Multi Moving Averages, Bollinger Bands ,Stochastics, and Price Action. 

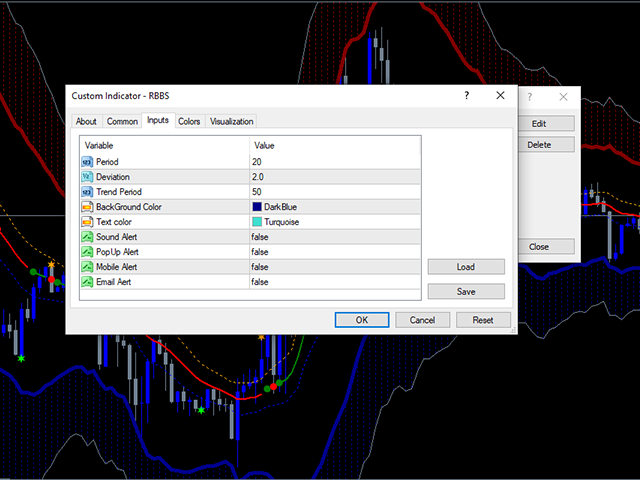
3. Middle Line. Default color Green and Red. This is Trend Lines and can be adjusted externally.  

4. High-Low Dot Lines. Located near the middle line. Upper dot Line is the Average of High price on the current chart. And Lower Dot Line is the Average of Low price on the current chart.

5. Outer Histograms. This is the market Border Channels . Began the wide inner lines to SlateGray outer lines. Upper Histogram indicates that price currently on the overbought area and vise versa Lower Histogram indicates that price currently on oversold area. If price cross over the SlateGray outer lines, it's strongly oversold or overbought. The time to exit order or the time to wait the best moment to enter the market.


How to use:


Recommended TimeFrame M15 or above

Any Currency pair 

Order Entry.
Buy Entry Signal arrow is always below the trend line ( middle line) and Sell entry Signal arrow is always above the trend line.

  • Order Buy when Buy Entry Signal triggers. 
  • Order Sell when Buy Entry signal triggers. 

Alerts included to get notifications.PopUp,Sound,Email and mobile alerts.

Recommended to wait for candle closed because the arrow may triggers starting from the candle started.


Order Exit can use some the following options depending on the price condition: 

  • when the opposite small star triggers.
  • when the price crossover the high-low dot line.
  • when the price crossover the opposite inner wide line on the histogram border channel.

Examples can be seen on the screenshot images.

Please note to understand that no perfect indicator. In certain case,there may be a false entry signal .Trader involvement will be very useful to increase the profit opportunity. One of the most important is that arrows and lines won't repaint. So it can be said it is " the real arrows and lines" that will help the trader easier to make a decision.


추천 제품
Boba Binary
Anthonius Soruh
5 (1)
Result look on  https://t.me/BonosuProBinary Pair : All Forex Pairs Time Frame : M1 Expaired : 1-2 Minutes Trade Time Once Time a Day Backtester, Alert Avaliable Average Signals Generate 5 - 20 Signals All Pair A Day Broker Time Zone GMT+3 Default Setting [Example Broker GMT+3 : Alpari, FBS, XM] Support Broker : Deriv, IQOption, Alpari, Binomo, Olymtrade, Qoutex, GCoption, etc Support Auto Trading : MT2 Trading, Binary Bot, Intrade Bot, Binomo Bot, Olymptrad Bot, MX2 trading, Price Pro, etc Ind
Cota Binary
Anthonius Soruh
5 (2)
Result look on  https://t.me/BonosuProBinary Pair : All Forex Pairs Time Frame : M1 Expaired : 1-2 Minutes Trade Time Once Time a Day Backtester, Alert Avaliable Average Signals Generate 5 - 20 Signals All Pair A Day Broker Time Zone GMT+3 Default Setting [Example Broker GMT+3 : Alpari, FBS, XM] Support Broker : Deriv, IQOption, Alpari, Binomo, Olymtrade, Qoutex, GCoption, etc Support Auto Trading : MT2 Trading, Binary Bot, Intrade Bot, Binomo Bot, Olymptrad Bot, MX2 trading, Price Pro, etc Ind
Yawabeh SD Pro –  Professional Supply and Demand Indicator Trade Smarter with Volume-Confirmed Supply/Demand Zones Our institutional-grade algorithm identifies high-probability reversal zones before price reacts, giving you the edge in Forex, Crypto, and Stocks. Key Features Multi-Timeframe Confirmation – View trend strength across multiple timeframes simultaneously – Align your trades with higher timeframe momentum Smart Alert System – Real-time notifications for: – Strong demand/supply zone
PTW NON REPAINT TRADING SYSTEM + HISTOGRAM Non-Repainting ,   Non-Redrawing   and   Non-Lagging  Trading System. Does the following: - Gives Accurate Entry and Exit Points - Scalping, Day and Swing Trading  - 95% Accuracy  - Targets, where to take profits. - Shows Trends, Support and resistance levels - Works on All Brokers - Works on All Currencies, CFDs and Stocks - It does not place trades for you, it only shows you what trades to place. - It works on All Timeframes - It is for Trend or ran
Introduction to Fractal Pattern Scanner Fractal Indicator refers to the technical indicator that makes use of the fractal geometry found in the financial market. Fractal Pattern Scanner is the advanced Fractal Indicator that brings the latest trading technology after the extensive research and development work in the fractal geometry in the financial market. The most important feature in Fractal Pattern Scanner is the ability to measure the turning point probability as well as the trend probabi
TrendBand Navigator Pro – Non-Repainting Multi-Timeframe Trading System Powered by proprietary multi-dimensional trend band algorithm delivering clear arrow signals Big Arrows Define Direction Small Arrows Capture Entries   Core Advantages   Intelligent Noise Filtering Volatility-adaptive technology avoids false breakouts, triggers arrows only during strong trends   Multi-Timeframe Compatibility Automatically adapts from 1-minute to monthly charts for all trading strategies   Vis
Индикатор канала с адаптивной шириной, который помогает видеть перекупленность/перепроданность , пробои границ и даёт стрелочные сигналы Buy/Sell с аккуратными оповещениями без спама . Индикатор подходит для: скальпинга и внутридневной торговли; поиска точек отката от границ канала; торговли пробоев (breakout) и возвратов (re-entry); ручной торговли и полуавтоматизации через алерты. Как работает индикатор Сглаживание (Nadaraya-Watson) Строится “умная” сглаженная линия цены (ядровая регрессия с
The indicator scans for stop grabber (special pattern of Joe Dinapoli which gives very high probability buy / sell signals and does not repaint ) signals in multiple timeframes for the all markets filtered and shows the results on Dashboard. Key Features Dashboard can be used for all markets It can scan for stop grabber pattern on MN1, W1, D1, H4, H1, M30, M15 ,M5, M1 timeframes Parameters UseMarketWatch: Set true to copy all symbols available in market watch MarketWatchCount : Set the number
Ideal Pips
Yaroslav Varankin
Reliable Tool for the Financial Market This tool delivers high-performance results in trading on financial markets. Advantages: Fast and Accurate Signals: The arrow signals of this tool are easily and accurately analyzed, providing quality signals that you can rely on. No Repainting: This tool does not have any repainting, ensuring reliable trading signals. Quality Guarantee: If any signal repainting is detected, which we cannot correct, we will refund your money without commission. Recommendat
Mystic Arrow
Svyatoslav Kucher
5 (4)
Mystic Arrow - уникальный авторский индикатор, отображающий сигналы в направлении основной тенденции, и против нее. Благодаря разнообразию настроек и фильтров индикатор можно настроить под свой стиль торговли. Mystic Arrow  подходит для любого таймфрейма, валютной пары. Сигналы индикатора не пропадают ни при каких условиях. Отличительной особенностью является возможность настроить сигналы индикатора отдельно для тенденции и против нее. Имеет в качестве отключаемого фильтра показания ценового кан
Strong Volume Trend
Muhammed Emin Ugur
The Strong Volume Trend  MT4 indicator is a powerful tool designed to help traders identify and capitalize on significant volume trends in the financial markets. With its advanced algorithm, this indicator accurately detects the strength and direction of volume movements, allowing traders to make informed trading decisions. Features: Volume Strength Analysis: The indicator analyzes the volume data and identifies strong volume trends, helping traders spot potential market reversals, breakouts, or
Using multiple timeframes for analysis with Multi Timeframe Average Directional Index  can provide several significant benefits for traders: Comprehensive Market View: By applying Mtf ADX Standard across different timeframes, traders gain a broader perspective on market dynamics. This allows them to identify trends, patterns, and potential reversal points that might be more apparent or consistent across various scales. Enhanced Pattern Recognition: Multiple timeframes help in identifying repeati
FREE
Stronger Trend is an indicator that generates trend signal. It generates trend signal with its own algorithm. These arrows give buying and selling signals. The indicator certainly does not repaint. Can be used in all pairs. Sends a signal to the user with the alert feature. Trade rules Enter the signal when the buy and sell signal arrives. Processing should only be initiated when signal warnings are received. It is absolutely necessary to close the operation when an opposite signal is received.
MoveWave
Andriy Sydoruk
MoveWave - Moving waves are very handy indicators for determining pivot levels. Most Forex traders make decisions based on technical analysis. This type of analysis determines patterns and trends in the market. With the help of complex mathematical equations that are combined and made out in the form of this indicator, the trader will be able to more accurately determine the price reversal levels. Wave theory mathematically represents various behavioral models of the market. It is used as the ba
The Binary Profit Maker,  This indicator works on MT4 and is very easy to use. When you receive a signal from it, you wait for that candle with the signal to close and you enter your trade at the beginning of the next new candle . A Up Purple arrow means Buy and a Down Purple arrow means Sell. All arrows comes with Alert  like for easy identification of trade signal. Are you okay with that? How To Enter Trade? 1 minute candle 1 minute expire
DTFX Algo Zones are auto-generated Fibonacci Retracements based on market structure shifts. These retracement levels are intended to be used as support and resistance levels to look for price to bounce off of to confirm direction.   USAGE Figure 1 Due to the retracement levels only being generated from identified market structure shifts, the retracements are confined to only draw from areas considered more important due to the technical Break of Structure (BOS) or Change of Character (CHo
This indicator works on MT4 and is very easy to use. When you receive a signal from it, you wait for that candle with the signal to close and you enter your trade at the beginning of the next new candle . A red arrow means sell and a green arrow means buy. All arrows comes with Alert  like for easy identification of trade signal. Are you okay with that? 1 minute candle 1 minute expire
**바이너리 스마트 시스템 소개: 귀하의 궁극적인 트레이딩 파트너** 바이너리 스마트 시스템은 단순히 인디케이터가 아닙니다. 이는 정교한 트레이딩 도구로, 다양한 시장에서 핀포인트 정확도와 적시의 신호를 제공하여 트레이더에게 성공을 이끌어주는 데 주안점을 둔 것입니다. 혁신적인 알고리즘과 다양한 기술적 지표의 철저한 컬렉션을 기반으로 구축된 이 시스템은 트레이딩 성공을 얻기 위한 열쇠입니다. **인디케이터 구성 요소:** 1. **이동 평균 비율 (MAP):** 이 구성 요소는 다양한 이동 평균의 가중 평균을 계산하여 추세 식별을 위한 강력한 기준을 형성합니다. MAP은 시장 상황에 동적으로 적응하여 현재 추세 방향을 파악하는 정보를 제공합니다. 2. **상품 채널 지수 (CCI):** 평균 가격으로부터의 편차를 분석함으로써 CCI는 과매수 및 과매도 조건을 판단합니다. 바이너리 스마트 시스템의 CCI 통합은 잠재적인 반전 지점을 식별하는 종합적인 접근을 보장합니다. 3.
Limitless MT4
Dmitriy Kashevich
Limitless MT4 is a universal indicator suitable for every beginner and experienced trader. works on all currency pairs, cryptocurrencies, raw stocks Limitless MT4 - already configured and does not require additional configuration And now the main thing Why Limitless MT4? 1 complete lack of redrawing 2 two years of testing by the best specialists in trading 3 the accuracy of correct signals exceeds 80% 4 performed well in trading during news releases Trading rules 1 buy signal - the ap
Happy Kangaroo
Pui Yan Leung
Overview Happy Kangaroo is a trend-following tool designed to identify market direction and provide high-probability entry signals based on volatility. By combining price action with the Average True Range (ATR), it visualize a dynamic support and resistance level of the price.     Key Features   The indicator's power lies in its customizable parameters and mathematical precision:  Dynamic Trend Detection: Uses the ATR period and factor to calculate the volatility bands. It identifies an Uptrend
Oscillator Trends
Maryna Shulzhenko
The Oscillator Trend indicators are most useful in identifying trend decay. Nobody canceled the divergence. Correct use of this signal will give you a certain head start in the market. When working in flat. The principle of operation of the oscillator is based on the measurement of fluctuations. The indicator tries to determine the maximum or minimum of the next swing - an exit from the overbought and oversold zones. Do not forget that these signals are most interesting at the borders of the fl
Scalping arrows not redraw - an indicator that shows price reversal points on the chart and does not redraw its signals. Also, the indicator sends signals to the trader via Email and Push. The accuracy of the signals of this indicator is approximately 92-94% on the M5 timeframe and more than 95% on the H1 timeframe. Thus, this indicator allows the trader to accurately open trades and predict further price movement. Price reversal points on the chart are indicated using simple and understandable
Trend surfer is indicator based on volume calculation in combination with algorithm that recognize trend changes . For aditional filtering, user can choose from 3 different oscillators, or can use their combination. Basic idea of indicator is to give signal when current volume is above value defined as Volume MA period*Volume MA multiplier, and trend change algorithm detects start of new trend wave. When all conditions are met and new trend wave is detected, indicator plot arrow on chart. Arrows
Accumulated Rsi
Muhammed Emin Ugur
Introducing the Accumulated RSI,  your ultimate tool for precise trend identification and momentum analysis in the world of Forex and financial markets. This cutting-edge MetaTrader 4 (MT4) indicator, designed for traders seeking unparalleled insight and accuracy, empowers you to make well-informed trading decisions like never before. Features Accurate Trend Detection: The Accumulated RSI utilizes the Relative Strength Index (RSI) in an innovative way to pinpoint the prevailing market trends wit
Breakout Detector — 고급 변동성 분석 및 돌파 감지 도구 설명 Breakout Detector는 낮은 변동성 구간을 식별하는 고급 기술적 지표로, 이러한 구간은 종종 큰 가격 돌파에 앞서 나타납니다. 이 지표는 파킨슨 변동성 계산과 RSI 분석을 결합하여, 트레이더가 돌파 기회를 미리 포착할 수 있도록 도와줍니다. 이 인디케이터가 해결하는 문제 돌파 신호를 놓침 : 돌파를 인지했을 때 이미 최적의 진입 시점을 놓친 경우 가짜 돌파 : 높은 변동성 구간에서 진입했다가 가격이 빠르게 반전되는 경우 타이밍 문제 : 시장이 언제 '에너지를 축적'하고 있는지 파악하기 어려움 변동성 혼동 : 일반적인 가격 움직임과 진짜 저변동성 압축 구간을 구분하기 어려움 늦은 진입 : 돌파 패턴을 인식했을 때 이미 가격이 크게 움직인 경우 이 인디케이터의 해결 방법 조기 경고 : 돌파 전 저변동성 구간(값이 30 미만)을 식별 시각적 준비 구간 : 금색 사각형으로 압축 구간을 강조 표시 스마
The indicator determines a special pattern of Joe Dinapoli. It gives very high probability buy and sell signals. Indicator does not repaint. Indicator Usage Buy Signal ''B'' Entry : Market buy order at signal bar close Stop : Low of signal bar Take Profit : First swing high Sell Signal ''S'' Entry : Market sell order at signal bar close Stop : High of signal bar Take Profit : First swing low Indicator Parameters Fast EMA : External Parameter (should be kept as default) Slow EMA: External Parame
FiboZag
Andriy Sydoruk
Indicator FiboZag - transfer the indicator to the chart and the Fibonacci levels will be built automatically on the last ZigZag turn. The main advantage lies in the correct construction of Fibonacci levels and markup of price levels. Simple, visual and effective use. The indicator is not redrawn and does not lag. Works on all currency pairs and on all timeframes.
빠르게 변화하는 금융 시장에서 모든 초는 중요하며 모든 결정은 거래를 성사시키거나 망칠 수 있습니다. 바이너리 해커 지표(Binary Hacker Indicator)는 분 단위로 가격 움직임을 분석하는 방식을 혁신할 준비가 된 획기적인 도구입니다. 거래의 정밀도 밝히기: 바이너리 해커 지표는 일반적인 거래 도구가 아닙니다. 실시간 분석기 역할을 하며 차트의 각 분을 분석하여 트레이더에게 귀중한 통찰력을 제공합니다. 광범위한 수동 분석이 필요한 기존 지표와 달리 바이너리 해커는 거래 전략에서 추측 작업을 제거하고 순수 데이터에 기반한 계산된 접근 방식을 제공합니다. 매 분의 힘: 거래의 매 분을 분석하고 매수와 매도 압력 사이의 복잡한 균형을 이해할 수 있다고 상상해보세요. 바이너리 해커를 통해 이러한 비전이 현실이 됩니다. 이 독창적인 지표는 시장을 지속적으로 모니터링하고 매 분마다 상승 틱과 하락 틱의 수를 계산하여 가격 액션의 본질을 쉽게 이해할 수 있는 정보로 정제합니다. 독특
Note : The slow loading of the indicator issue has been addressed . This new version loads fast and does not slow the platform. Version 1.3 : We have updated the indicator to include an historical bar scanning option . So instead of scanning all bars in the history (which can make the indicator slow sometimes ) , you can select the maximum number of bars it can scan which can increase the performance and make the indicator faster. This indicator scans the 1-3 Trendline pattern . The indicato
이 지표는 실제 거래에 완벽한 자동 파동 분석 지표입니다! 사례... 참고:   웨이브 그레이딩에 서양식 이름을 사용하는 데 익숙하지 않습니다. Tang Lun(Tang Zhong Shuo Zen)의 명명 규칙의 영향으로 기본 웨이브를   펜   으로 명명하고 2차 웨이브 밴드를   세그먼트   로 명명했습니다. 동시에, 세그먼트에는 추세 방향이 있습니다.   주요 추세 세그먼트에는   이름이 지정되지만(이 이름 지정 방법은 향후 노트에서 사용됩니다. 먼저 말씀드리겠습니다.) 알고리즘은 굴곡 이론과 거의 관련이 없으므로 그렇게 해서는 안 됩니다. 이는 나의 시장 분석을   통해 요약된 끊임없이 변화하고 복잡한 운영 규칙을   반영합니다. 밴드는 더 이상 사람마다 다르지 않도록 표준화되고 정의되었습니다. 인위적인 간섭의 드로잉 방법은 시장 진입을 엄격하게 분석하는 데 핵심적인 역할을 합니다. 이 지표를 사용하는 것은 거래 인터페이스의 미학을 개선하고 원래의 K-line 거래를
이 제품의 구매자들이 또한 구매함
Scalper Inside PRO
Alexey Minkov
4.74 (69)
An exclusive indicator that utilizes an innovative algorithm to swiftly and accurately determine the market trend. The indicator automatically calculates opening, closing, and profit levels, providing detailed trading statistics. With these features, you can choose the most appropriate trading instrument for the current market conditions. Additionally, you can easily integrate your own arrow indicators into Scalper Inside Pro to quickly evaluate their statistics and profitability. Scalper Inside
Atomic Analyst
Issam Kassas
5 (4)
우선적으로 언급할 점은이 거래 지표가 다시 그리지 않고 지연되지 않으며 이를 통해 수동 및 로봇 거래 모두에 이상적이라는 점입니다. 사용자 매뉴얼: 설정, 입력 및 전략. Atomic Analyst는 가격의 강도와 모멘텀을 활용하여 시장에서 더 나은 이점을 찾는 PA Price Action Indicator입니다. 고급 필터를 장착하여 잡음과 거짓 신호를 제거하고 거래 잠재력을 높이는 데 도움이 됩니다. 복잡한 지표의 다중 레이어를 사용하여 Atomic Analyst는 차트를 스캔하고 복잡한 수학적 계산을 간단한 신호와 색상으로 변환하여 초보 트레이더가 이해하고 일관된 거래 결정을 내릴 수 있도록합니다. "Atomic Analyst"는 새로운 및 경험이 풍부한 트레이더를위한 종합적인 거래 솔루션입니다. 프리미엄 지표와 최고 수준의 기능을 하나의 거래 전략에 결합하여 모든 종류의 트레이더에 대한 다재다능한 선택지가되었습니다. 인트라데이 거래 및 스캘핑 전략 : 빠르고 정확한 일일
Trend Lines PRO
Roman Podpora
5 (1)
트렌드 라인즈 프로       이 지표는 시장이 실제로 어떤 방향으로 전환되는지 파악하는 데 도움이 됩니다. 실제 추세 반전 지점과 주요 시장 참여자들이 다시 진입하는 지점을 보여줍니다. 보시다시피       BOS 라인       복잡한 설정이나 불필요한 노이즈 없이 더 높은 시간대의 추세 변화와 주요 레벨을 확인할 수 있습니다. 신호는 차트에 다시 그려지지 않고 캔들이 마감된 후에도 계속 표시됩니다. VERSION MT 5   -   RFI LEVELS PRO   표시기   와 결합할 때 최대 잠재력을 발휘합니다. 지표가 보여주는 내용: 실제 변화       추세(BOS 라인) 한 번 신호가 나타나면 그 신호는 계속 유효합니다! 이는 신호를 발생시킨 후 변경될 수 있는 리페인팅 방식의 지표와 중요한 차이점입니다. 리페인팅 방식의 지표는 잠재적으로 자금 손실로 이어질 수 있습니다. 이제 더욱 높은 확률과 정확도로 시장에 진입할 수 있습니다. 또한 화살표가 나타난 후 목표가(익절)
Dynamic Scalper System
Vitalyi Belyh
5 (1)
" Dynamic Scalper System " 지표는 추세 파동 내에서 스캘핑 방식으로 거래하도록 설계되었습니다. 주요 통화쌍 및 금에서 테스트되었으며, 다른 거래 상품과의 호환성이 가능합니다. 추가적인 가격 변동 지원을 통해 추세에 따라 단기 포지션 진입 신호를 제공합니다. 지표의 원리 큰 화살표는 추세 방향을 결정합니다. 작은 화살표 형태의 스캘핑 신호를 생성하는 알고리즘은 추세 파동 내에서 작동합니다. 빨간색 화살표는 상승 방향을, 파란색 화살표는 하락 방향을 나타냅니다. 민감한 가격 변동선은 추세 방향으로 그려지며, 작은 화살표의 신호와 함께 작용합니다. 신호는 다음과 같이 작동합니다. 적절한 시점에 선이 나타나면 진입 신호가 형성되고, 선이 있는 동안 미결제 포지션을 유지하며, 완료되면 거래를 종료합니다. 권장되는 작업 시간대는 M1~H4입니다. 화살표는 현재 캔들에 형성되며, 다음 캔들이 이미 시작되었더라도 이전 캔들의 화살표는 다시 그려지지 않습니다. 입력 매개
Quantum Breakout Indicator PRO
Bogdan Ion Puscasu
4.96 (26)
소개       Quantum Breakout PRO   , 브레이크아웃 존 거래 방식을 변화시키는 획기적인 MQL5 지표! 13년 이상의 거래 경험을 가진 숙련된 트레이더 팀이 개발한   Quantum Breakout PRO는   혁신적이고 역동적인 브레이크아웃 영역 전략으로 거래 여정을 새로운 차원으로 끌어올리도록 설계되었습니다. Quantum Breakout Indicator는 5개의 이익 목표 영역이 있는 브레이크아웃 영역의 신호 화살표와 브레이크아웃 상자를 기반으로 한 손절 제안을 제공합니다. 초보자 거래자와 전문 거래자 모두에게 적합합니다. Quantum EA 채널:       여기를 클릭하세요 MT5 버전 :   여기를 클릭하세요 중요한! 구매 후 설치 매뉴얼을 받으려면 개인 메시지를 보내주십시오. 추천: 기간: M15 통화쌍: GBPJPY, EURJPY, USDJPY,NZDUSD, XAUUSD 계정 유형: 스프레드가 매우 낮은 ECN, Raw 또는 Razo
Currency Strength Exotics
Bernhard Schweigert
4.88 (33)
현재 20% 할인! 초보자 또는 전문가 트레이더를 위한 최고의 솔루션! 이 표시기는 Exotic Pairs Commodities, Indexes 또는 Futures와 같은 기호에 대한 통화 강도를 표시하는 데 특화되어 있습니다. 금, 은, 석유, DAX, US30, MXN, TRY, CNH 등의 진정한 통화 강도를 보여주기 위해 9번째 줄에 모든 기호를 추가할 수 있습니다. 이것은 독특하고 고품질이며 저렴한 거래 도구입니다. 우리는 많은 독점 기능과 새로운 공식을 통합했습니다. 새로운 추세 또는 스캘핑 기회의 정확한 트리거 포인트를 정확히 찾아낼 수 있기 때문에 거래가 어떻게 개선될지 상상해 보십시오. 사용 설명서: 여기를 클릭 https://www.mql5.com/en/blogs/post/708876 모든 시간대에 작동합니다. TREND를 빠르게 확인할 수 있습니다! 새로운 기본 알고리즘을 기반으로 설계되어 잠재적인 거래를 더욱 쉽게 식별하고 확인할 수 있습니다. 8개의
Reversal Master
Alexey Minkov
4.8 (15)
The Reversal Master is an indicator for determining the current direction of price movement and reversal points. The indicator will be useful for those who want to see the current market situation better. The indicator can be used as an add-on for ready-made trading systems, or as an independent tool, or to develop your own trading systems. The Reversal Master indicator, to determine the reversal points,  analyzes a lot of conditions since the combined analysis gives a more accurate picture of t
Route Lines Prices - 은 가격 방향을 찾는 데 사용되는 지표입니다. 간단한 인터페이스에는 가격 움직임 및 미래 방향 계산을 위한 다양한 알고리즘이 포함되어 있습니다. 이러한 알고리즘에는 사용된 시간대에 따른 변동성 계산 및 가격 평활화 기능이 있습니다. 이 지표는 " Calculating price values " 값을 변경하는 단일 매개변수를 제공합니다. 기본값인 1은 균형 잡힌 자동 계산을 제공하며, 별도의 설정 없이 바로 사용할 수 있습니다. 2에서 500 사이의 값을 수동으로 변경하여 자신만의 거래 시스템에 맞게 지표를 맞춤 설정할 수 있습니다. 이 지표는 M1부터 H4까지의 시간대에서 사용을 권장합니다. 모든 거래 상품에 적용 가능합니다. 신호 화살표는 캔들 종가에 생성되며, 과거 차트에는 다시 그려지지 않습니다. 메인 차트에 동일한 화살표가 표시됩니다. 다양한 유형의 알림을 사용할 수 있으며, 내장된 라인 궤적 카운터는 종가를 기반으로 작동합니다. 이는
CRT Multi-Timeframe Market Structure & Liquidity Sweep Indicator Non-Repainting | Multi-Asset | MT5 Version Available MT5 Version:   https://www.mql5.com/en/market/product/162075 Full User Guide — explains what each feature does and why:   https://www.mql5.com/en/blogs/post/767525 Quick Start User Guide  — explains how to configure and in what order:  https://www.mql5.com/en/blogs/post/767540 Indicator Overview CRT Ghost Candle HTF Fractal is a complete institutional-grade market structure too
현재 40% 할인 ! 초보자 또는 전문가 트레이더를 위한 최고의 솔루션! 이 대시보드 소프트웨어는 28개의 통화 쌍에서 작동합니다. 2가지 주요 지표(Advanced Currency Strength 28 및 Advanced Currency Impulse)를 기반으로 합니다. 전체 Forex 시장에 대한 훌륭한 개요를 제공합니다. 고급 통화 강도 값, 통화 이동 속도 및 모든(9) 시간대의 28 Forex 쌍에 대한 신호를 보여줍니다. 추세 및/또는 스캘핑 기회를 정확히 파악하기 위해 차트의 단일 지표를 사용하여 전체 시장을 볼 수 있을 때 거래가 어떻게 개선될지 상상해 보십시오! 잠재적인 거래를 식별하고 확인하면서 강력한 통화와 약한 통화를 더욱 쉽게 식별할 수 있도록 이 지표에 기능을 내장했습니다. 이 표시기는 통화의 강세 또는 약세가 증가 또는 감소하는지 여부와 모든 시간대에서 수행되는 방식을 그래픽으로 보여줍니다. 추가된 새로운 기능은 현재 시장 조건 변화에 적응하는
Advanced Supply Demand
Bernhard Schweigert
4.91 (299)
현재 40% 할인! 초보자나 전문 트레이더를 위한 최고의 솔루션! 이 보조지표는 우리가 다수의 독창적 기능과 새로운 공식을 통합한 독특하고 고품질이며 저렴한 거래 도구입니다. 이 업데이트를 통해 이중 시간대를 표시할 수 있습니다. 더 높은 TF를 표시할 수 있을 뿐만 아니라 차트 TF와 더 높은 TF 모두를 표시할 수 있습니다: 중첩 영역 표시. 모든 Supply Demand 트레이더들이 좋아할 것입니다. :) 중요한 정보 공개 Advanced Supply Demand의 잠재력을 극대화하려면 다음을 방문하십시오. https://www.mql5.com/ko/blogs/post/720245   진입 또는 목표의 명확한 트리거 포인트를 정확히 찾아냄으로 해서 거래가 어떻게 개선될지 상상해 보십시오. 새로운 알고리즘을 기반으로 매수자와 매도자 간의 잠재적인 불균형을 훨씬 더 쉽게 분간할 수 있습니다. 왜냐하면 가장 강한 공급영역과 가장 강한 수요 영역과 과거에 어떻게 진행 되었는지를(이전
Super Signal Market Slayer 비재페인트 | 고정확도 | 멀티 마켓 지능형 추세 지표 트레이딩에서 진짜 어려운 것은 주문이 아니라, 시장 변동 속에서 추세가 시작되는 순간을 정확히 파악하는 것입니다. Market Slayer 는 이를 위해 만들어졌습니다. 이 지표는 데이 트레이딩을 위해 설계된 비재페인트 지능형 지표입니다. 다중 확인 및 추세 필터링을 통해 중요한 시점에서만 명확하고 신뢰할 수 있는 Buy / Sell 신호를 제공합니다. 핵심 장점 비재페인트 신호 한 번 생성된 신호는 이동하거나 사라지지 않습니다. 고정확도 추세 판단 다양한 종목에서 테스트되었으며, 특히 골드 M5 / M15에서 안정적인 성과를 보입니다. 멀티 마켓 지원 골드, 외환, 지수, 주요 암호화폐 지원. 데이 트레이딩 최적화 M5, M15에 집중하여 노이즈를 줄이고 실행력을 향상. 직관적 구조 초보자도 쉽게 이해하고 사용할 수 있습니다. 기술 로직 요약 Market Slayer 는 단일
Super Reversal Indicator with Alert 개요 Super Reversal Indicator with Alert는 다중 시간 프레임 분석을 기반으로, 스토캐스틱 모멘텀, 수요와 공급 영역, 그리고 가격 반전 신호를 결합하여 높은 확률의 시장 반전 기회를 식별하도록 설계된 트레이딩 도구입니다. 이 지표는 명확한 시각적 신호와 실시간 알림을 통해 트레이더가 시장의 전환 지점을 쉽게 파악할 수 있도록 도와줍니다. 주요 기능 다중 시간 프레임 스토캐스틱 분석 상위 시간 프레임의 스토캐스틱 오실레이터 사용 (사용자 설정 가능) 모멘텀 변화 및 교차 신호 감지 정밀한 진입을 위한 과매수 및 과매도 구간 제공 반전 리젝션 신호 주요 가격 구간에서 강한 리젝션 캔들 감지 다음 위치에서의 반전 식별 일일 고점 (매도 반전) 일일 저점 (매수 반전) 차트에 화살표로 표시하여 직관적인 확인 가능 수요 및 공급 영역 H4 및 D1 시간 프레임에서 주요 영역 자동 표시 다음 영역 강조
GOLD Impulse with Alert
Bernhard Schweigert
4.67 (12)
이 지표는 Advanced Currency IMPULSE with ALERT  +   Currency Strength Exotics  의 2가지 제품의 슈퍼 조합입니다. 그것은 모든 시간 프레임에 대해 작동하며 8개의 주요 통화와 하나의 기호에 대한 강약의 충동을 그래픽으로 보여줍니다! 이 표시기는 금, 이국적인 쌍, 상품, 지수 또는 선물과 같은 기호에 대한 통화 강도 가속을 표시하는 데 특화되어 있습니다. 금, 은, 오일, DAX, US30, MXN, TRY, CNH 등의 진정한 통화 강도 가속(충동 또는 속도)을 표시하기 위해 9번째 줄에 모든 기호를 추가할 수 있습니다. 새로운 기본 알고리즘을 기반으로 구축되어 잠재적인 거래를 훨씬 더 쉽게 식별하고 확인할 수 있습니다. 이는 통화의 강세 또는 약세가 가속되는지 여부를 그래픽으로 표시하고 가속 속도를 측정하기 때문입니다. 자동차의 속도계처럼 생각하면 됩니다. 가속화할 때 Forex 시장에서 동일한 일이 분명히 더 빠르
Dynamic Forex28 Navigator
Bernhard Schweigert
4.43 (7)
Dynamic Forex28 Navigator - 차세대 외환 거래 도구. 현재 49% 할인. Dynamic Forex28 Navigator는 오랫동안 인기 있는 지표의 진화형으로, 세 가지의 힘을 하나로 결합했습니다. 고급 통화 Strength28 지표(695개 리뷰) + 고급 통화 IMPULSE with ALERT(520개 리뷰) + CS28 콤보 신호(보너스). 지표에 대한 자세한 정보 https://www.mql5.com/en/blogs/post/758844 차세대 Strength 지표는 무엇을 제공합니까?  원래 지표에서 좋아했던 모든 것이 새로운 기능과 더 높은 정확도로 강화되었습니다. 주요 기능: 독점적인 통화 Strength 공식.  모든 시간대에 걸쳐 부드럽고 정확한 강도선. 추세와 정확한 진입을 식별하는 데 이상적입니다. 역동적인 시장 피보나치 수준(시장 피보나치).  이 지표에만 있는 고유한 기능. 가격 차트가 아닌 통화 강도에 피보나치가 적용됩니다.
FX Power MT4 NG
Daniel Stein
4.95 (21)
FX Power: 통화 강세 분석으로 더 스마트한 거래 결정을 개요 FX Power 는 어떤 시장 상황에서도 주요 통화와 금의 실제 강세를 이해하기 위한 필수 도구입니다. 강한 통화를 매수하고 약한 통화를 매도함으로써 FX Power 는 거래 결정을 단순화하고 높은 확률의 기회를 발견합니다. 트렌드를 따르거나 극단적인 델타 값을 사용해 반전을 예측하고자 한다면, 이 도구는 귀하의 거래 스타일에 완벽히 적응합니다. 단순히 거래하지 말고, FX Power 로 더 스마트하게 거래하세요. 1. FX Power가 거래자에게 매우 유용한 이유 통화와 금의 실시간 강세 분석 • FX Power 는 주요 통화와 금의 상대적 강세를 계산하고 표시하여 시장 역학에 대한 명확한 통찰력을 제공합니다. • 어떤 자산이 앞서고 있고 어떤 자산이 뒤처지는지 모니터링하여 보다 현명한 거래 결정을 내릴 수 있습니다. 포괄적인 멀티 타임프레임 뷰 • 단기, 중기 및 장기 타임프레임에서 통화와 금의 강세를
Volatility Trend System - a trading system that gives signals for entries. The volatility system gives linear and point signals in the direction of the trend, as well as signals to exit it, without redrawing and delays. The trend indicator monitors the direction of the medium-term trend, shows the direction and its change. The signal indicator is based on changes in volatility and shows market entries. The indicator is equipped with several types of alerts. Can be applied to various trading ins
RFI levels PRO
Roman Podpora
5 (1)
이 지표는 추세 반전 지점과 가격 반등 영역을 정확하게 보여줍니다.       주요 투자자들   . 새로운 트렌드가 형성되는 곳을 파악하고 최대한 정확하게 의사결정을 내리며 모든 거래를 완벽하게 통제합니다. TREND LINES PRO   지표와 함께 사용할 때 최대의 잠재력을 발휘합니다.  VERSION MT5 지표가 보여주는 내용: 새로운 추세의 시작 시 활성화되는 반전 구조 및 반전 수준. 최소한의 위험 대비 수익률을 갖는 이익 실현   (TAKE PROFIT)   및   손절매(STOP LOSS)   레벨 표시       RR 1:2   . 지능형 손실 감소 로직이 적용된 손절매 기능. 지정된 지표에서 두 가지 추세 유형에 대한 반전 패턴을 표시합니다. 지표: 트렌드를 따라   트렌드 라인 프로   (글로벌 트렌드 변화) 트렌드 프로   (빠른 트렌드 변화) 간단하고 효과적입니다       스캐너       실시간 추세 (신규). 다중 시간 프레임 도구 필터링. 표시하다  
GEM Signal MT4
Shengzu Zhong
GEM Signal Pro GEM Signal Pro는 MetaTrader 4용 추세추종형 지표로, 차트에서 더 명확한 신호, 더 구조적인 트레이드 설정, 그리고 더 실용적인 리스크 관리를 원하는 트레이더를 위해 설계되었습니다. 단순한 화살표만 표시하는 것이 아니라, GEM Signal Pro는 전체 트레이드 아이디어를 더 깔끔하고 읽기 쉬운 방식으로 보여줍니다. 조건이 확인되면 진입가, 손절가, 목표가를 차트에 표시하여 트레이더가 설정을 더 효율적으로 검토할 수 있도록 도와줍니다. 작동 방식 이 지표는 먼저 내부 로직에 따라 유효한 초기 신호를 식별합니다. 확인 조건이 충족되면, GEM Signal Pro는 차트에 전체 설정을 표시합니다. 이를 통해 트레이더는 거래 구조를 더 명확하게 보고, 수동 분석 작업을 줄일 수 있습니다. 차트에 표시되는 거래 레벨 확인된 신호에 대해, GEM Signal Pro는 다음을 표시할 수 있습니다. 진입가 손절가 목표가 1 목표가 2 목표가 3 손
Harmonic Pattern Plus MT4
Young Ho Seo
4.44 (18)
Introduction Harmonic Patterns are best used to predict potential turning point. Traditionally, Harmonic Pattern was identified manually connecting peaks and troughs points in the chart. Manual harmonic pattern detection is painfully tedious and not suitable for everyone. You are often exposed under subjective pattern identification with manual pattern detection. To avoid these limitations, Harmonic Pattern Plus was designed to automate your harmonic pattern detection process. The functionality
Currency Strength Matrix
Raymond Gilmour
4.5 (26)
THE ONLY CURRENCY STRENGTH INDICATOR THAT IS BASED ON PRICE ACTION. DESIGNED FOR TREND, MOMENTUM & REVERSAL TRADERS This indicator  reads price action to confirm trend and strength . Advanced multi-currency and multi-time frame indicator that shows you simply by looking at one chart, every currency pair that is trending and the strongest and weakest currencies driving those trends. For full details on how to use this indicator, and also how to get a FREE chart tool, please see user manual HERE
Sygnalizator
Kacper Piskorz
Hi, I made one of best sygnalizators on a stock markets. It's prepared for a pro players. There is not even, a one mistake. It works on every timeframe and every stock market. Test it before you say something, in my 7 years I check houndreds of fakes. This one work right in time, not in slow motions. It' s a dot with 3 levels of strong power depends on how strong market is. If power is high you have very profitable results but the most important it's allways on time. So it is protecting your acc
Wave Cycle Counter
Eric Evert Ouweneel
Wave and Cycle counter to give an immediate indication how far the ongoing trend has progressed. Low numbers: trend has just started, ride the trend. Higher numbers: trend is 'older', watch for reversals This indicator is 100% compatible with the fantastic TopDog trading strategy. (I will NOT give any details about this Top Dog strategy) The trend direction is determined by a SMA value (or any other MA) you can set. Waves and cycles numbers and letters are derived from a SlowStoch setting. Wave
Miraculous Indicator – Gann Square of Nine 기반 100% 비리페인트 Forex 및 바이너리 도구 이 영상은 Miraculous Indicator 를 소개합니다. 이 지표는 Forex 및 바이너리 옵션 트레이더를 위해 특별히 개발된 매우 정확하고 강력한 트레이딩 도구입니다. 이 지표가 독특한 이유는 전설적인 **Gann Square of Nine(Gann 9의 사각형)**과 **Gann's Law of Vibration(Gann 진동의 법칙)**에 기반을 두고 있기 때문입니다. 이는 현대 트레이딩에서 가장 정밀한 예측 도구 중 하나로 손꼽힙니다. Miraculous Indicator는 완전히 비리페인트(non-repaint) 됩니다. 즉, 캔들이 마감된 후에도 신호가 변경되거나 사라지지 않습니다. 보이는 것이 곧 결과입니다. 이는 트레이더가 자신감을 가지고 거래에 진입하고 청산할 수 있는 신뢰할 수 있고 일관된 기반을 제공합니다. 주요 특징: Gann
Cyclic Impulse
Vitalyi Belyh
차트를 구조화하고 주기적인 가격 변동을 식별하는 기술 지표입니다. 모든 차트에서 작업할 수 있습니다. 다양한 유형의 알림. 그래프 자체에도 추가 화살표가 있습니다. 역사를 재구성하지 않고, 촛불을 닫는 작업에 임한다. M5 이상에서 권장되는 TF입니다. 사용 및 구성이 쉬운 매개변수입니다. 매개변수가 다른 2개의 지표를 사용하는 경우, 다른 지표 없이 해당 지표만 사용할 수 있습니다. 2개의 입력 매개변수가 있습니다 주기성과 신호 지속 시간 이 2개의 매개변수는 차트 구조의 처리와 관련이 있습니다. Cyclicity - 역전 주기가 얼마나 자주 바뀌는지 조절하고 주기를 매끄럽게 합니다. Signal duration - 최소 숫자에서는 가격 움직임의 충격을 감지하고, 최대 숫자에서는 장기적 추세 움직임을 감지합니다.. --------------------------------
FX Volume
Daniel Stein
4.63 (38)
FX Volume: 브로커 시각에서 바라보는 진짜 시장 심리 간단 요약 트레이딩 접근 방식을 한층 더 향상시키고 싶으신가요? FX Volume 는 소매 트레이더와 브로커의 포지션을 실시간으로 파악할 수 있게 해 줍니다. 이는 COT 같은 지연된 보고서보다 훨씬 빠릅니다. 꾸준한 수익을 추구하는 분이든, 시장에서 더 깊은 우위를 원하시는 분이든, FX Volume 을 통해 대규모 불균형을 찾아내고, 돌파 여부를 확인하며 리스크 관리를 정교화할 수 있습니다. 지금 시작해 보세요! 실제 거래량 데이터가 의사결정을 어떻게 혁신할 수 있는지 직접 경험해 보시기 바랍니다. 1. 트레이더에게 FX Volume이 매우 유익한 이유 탁월한 정확도를 지닌 조기 경보 신호 • 다른 사람들보다 훨씬 앞서, 각 통화쌍을 매수·매도하는 트레이더 수를 거의 실시간으로 파악할 수 있습니다. • FX Volume 은 여러 리테일 브로커에서 추출한 실제 거래량 데이터를 종합해 명확하고 편리한 형태로 제공하는
Color Trend FX
Alexey Minkov
4 (4)
The indicator shows on the chart the accurate market entry points, accurate exit points, maximum possible profit of a deal (for those who take profit according to their own system for exiting deals), points for trailing the open positions, as well as detailed statistics. Statistics allows to choose the most profitable trading instruments, and also to determine the potential profits. The indicator does not redraw its signals! The indicator is simple to set up and manage, and is suitable for begin
Binary Volume Edge – Martingale Stats  Indicator for binary options with live pre-signals and full martingale stats Binary Volume Edge – Martingale Stats is a professional tool that combines powerful signal filtering, smart martingale analysis, and a unique early warning system. No magic – just clear rules and verifiable stats. What do you get? 1. Signals you can trust Absolute absence of redrawing – arrows appear only on closed candles and never change again. Preliminary signals on t
Linear Trend Predictor - 진입 지점과 방향성 지원선을 결합한 추세 지표입니다. 고가/저가 채널을 돌파하는 원칙에 따라 작동합니다. 지표 알고리즘은 시장 노이즈를 걸러내고 변동성과 시장 역학을 고려합니다. 표시기 기능  평활화 방법을 사용하여 시장 추세와 BUY 또는 SELL 주문을 시작하기 위한 진입 시점을 보여줍니다.  모든 기간의 차트를 분석하여 단기 및 장기 시장 움직임을 파악하는 데 적합합니다.  어떠한 시장과 시간대에도 적용할 수 있으며, 입력 매개변수를 통해 거래자는 자신에게 맞게 지표를 독립적으로 사용자 지정할 수 있습니다.  설정된 지표 신호는 사라지거나 다시 그려지지 않습니다. 이는 캔들 마감 시 결정됩니다.  여러 유형의 알림이 화살표와 결합되어 있습니다.  이 지표는 독립적인 거래 시스템으로 사용할 수도 있고, 다른 거래 시스템에 추가하는 용도로도 사용할 수 있습니다.  모든 수준의 경험을 가진 거래자가 사용할 수 있습니다. 주요 매
Hidden Block Finder MT4
Umar Ilyas Raja Muhamma Ilyas
히든 블록 인디케이터 프로 트레이딩 도구   제품 개요 Hidden Block 인디케이터는 차트에서 숨겨진 기관 반응 구역을 표시하는 구조 기반 도구입니다.   주요 기능 내부 구조 기반 자동 블록 탐지 동적 지지·저항 시장 구조·추세와 정렬 변동성 기반 검증 깔끔한 차트 모든 종목·타임프레임 지원 확정 후 재도색 없음   왜 Hidden Block? 큰 움직임 전 가격이 조용히 반응하는 지점.   사용 방법 추세 파악 블록 재진입 대기 구조 변화/캔들 반응 확인 진입 & 리스크 관리 구역으로 활용   대상 SMC, 구조·프라이스액션 트레이더   호환성 MT4 & MT5   성능 낮은 CPU 사용 고변동 장에서도 안정 히스토리 재계산 없음   주의 단독 시스템 아님.   FAQ 재도색? → 없음 초보자? → 기본 구조 지식 필요 단독 사용? → 불가   설명 가격이 Hidden Block에서 멈추거나 반전하거나 지속함
제작자의 제품 더 보기
StochSignal
Wartono
5 (4)
It works based on the Stochastic Indicator algorithm. Very useful for trading with high-low or OverSold/Overbought swing strategies. StochSignal will show a buy arrow if the two lines have crossed in the OverSold area and sell arrows if the two lines have crossed in the Overbought area. You can put the Stochastic Indicator on the chart with the same parameters as this StochSignal Indicator to understand more clearly how it works. This indicator is equipped with the following parameters: Inputs d
FREE
Pivot SR
Wartono
4.67 (3)
It identifies the pivot, support, and resistance price levels of the selected timeframe and then draws lines onto the chart. FEATURES: Option to specify the Timeframe Period in the PivotSR calculation. Option to display the PivotSR of the last candle, of every candle, or of the current candle. Options for displaying labels, line thickness, and line color. PivotSR can be interpreted as reversal levels or past price reactions that can be used as the basis for current price analysis. Some traders b
FREE
GU Spot is a One Shot One Kill EA. A  Scalping EA   for GBPUSD .   No Martingale, No Averaging, No Grid or other high-risk strategies.  Working with up to the best 100 trading signals algorithm from various Trading Systems. The combination of Price Action, High Low, Trend, Range Levels, Pullback /  Retracement and Reversal. This is Fully Automatic Trading Robot . High Accuracy Entry Signals and protected by a proper Money Management. A tight Stop Loss with SL:TP ratio 1:3 by default, Trailing an
It is a custom non-repaint indicator to identify trade opportunities in swing action as prices move within an upper and lower band. Inspired by the Keltner Channel, the most popular channel Indicator introduced by Chester Keltner. It is different with a Bollinger Bands. It represents volatility using the high and low prices, while Bollinger's studies rely on the standard deviation. The algorithm for this indicator is also available in the EntryMaximator EA. Including the option to use it or not.
FREE
MACD Scanner provides the multi symbols and multi-timeframes of MACD signals. It is useful for trader to find the trading idea quickly and easily. User-friendly, visually clean, colorful, and readable. Dynamic dashboard display that can be adjusted thru the external input settings. Total Timeframes and Total symbols as well as the desired total rows/panel, so it can maximize the efficiency of using the chart space. The Highlight Stars on the certain matrix boxes line based on the selected Scan M
This is MT4 version of StochScanner It scans Stochastic from Multi Symbols and Multi Timeframes and displayed on the dashboard on a single chart. . 4 scanning modes: 1. Mode OverBought/OverSold Indicator scans Overbought and OverSold . OverBought : current stochastic is above level 80 and OverSold : current stochastic is below level 20 2. Mode Signal It means if the previous stochastic is on OverBought or OverSold ( either Main Line and Signal Line ) and the current Main Line cross over the curr
CTime
Wartono
This is the countdown of the last candle Indicator. How much time remains in the current candle of your chart CTime display exactly how many hours, minutes and seconds remain before the current candle closes, and a new one opens. This allows you to be on the ball as soon as the next candle appears It could be useful for a trader who trades with candles as the main attention Available option to change the text color to suit the chart background. This Indicator is related to the system here .
FREE
It is based on Multiple EMA indicators. The idea is that how to display multiple Exponential Moving Averages on the chart easily without placing them one by one. It has also BLUE-RED trend lips to define UPTREND and DOWNTREND whichas BLUE is UPTREND and RED is DOWNTREND.You can change the colors by going to Indicator properties --- colors. There are 2 external setting. They are Period and Shift. When you change them (period and or shift ) then all will automatically adjust. For any currency pair
Range Multi Alligators provides Range Channel High Low Information and the market trend indicated by the blue-red Histogram in the middle of range channel. The range channel lines is useful to define stoploss and take profit. This is trend follower indicator based on the Multi Alligators. Attach it on the chart and change one or all setting then all lines will move synchronously with the current one. Parameters Period : the number of bars used for the indicator calculations. Default: 120 used f
Stochastic Candles Indicator   It will convert the stochastic indicator from separate window to the chart window by drawing oversold-overbought coloring candles. Red is overbought and blue is oversold by default.And you can change the color later on the external indicator setting.This is Multi timeframe  indicator that means it can show appearance result from another timeframe.E.g: If you set timeframe H1 then it will draw candles from Timeframe H1 whatever timeframe you attach on. It will be us
Autobot Retracement Code (ARC) A robot trading that works based on retracement strategy while following the market trend.It has  made average profits up to 25% /month that is relatively a High Return of Investment.Real Account proof. Fully automation. Auto Lot sizing, Auto TakeProfit Calculation, Auto StopLoss Calculation. Currently Running on Real account , it has more than 100% growth / 5 months. NEW UPDATE RELEASED, VERSION 3.0  FEATURES on Version 3: FIFO rules Auto LotSize Auto StopLoss 
Order Management EA (OME). The software will manage your trades based on 2 options: Magic Number or Order Comment. Both the Trades from the other EA or from Manual Trading. Drawing Stop Loss/Take Profit, Close All the positions, manages Multiple Orders, determining grid range and entry signals automatically.  Sending Martingale Orders, if necessary, that can be turn off/on. Including 2 options lot calculation: Multiplication or Addition.  You install OME in your account, you place order, and it
Strategy – Bollinger Band, Moving Average and Price Actions. Bollinger Bands to identify High-Low Price, Moving Average to identify Trend and Price Action is to synchronize both of them.  SardaFx 4.1 has average holding time 24 hours (1 day) on timeframe H1. It is not a Martingale EA or Averaging EA. The work is simple, BUY and Exit or SELL and Exit. No recurring BUY and or SELL in the same time and the same symbol except you adjust Max BUY/SELL  more than 1,default setting is 1 BUY and 1 SELL.
Oversold and Overbought Candles, Trendlines, and BUY-SELL arrows in the single Indicator. Built from 8 default MT4 Indicators. Stochastic,RSI,SAR,CCI,RVI,DeMarker,WPR and MA. It is " NON REPAINT " indicator. All buffers do not repaint.  Double Trendline buffers that can also be used to identify sideway market and support resistance area.  Any timeframes and any currency pairs. Parameters: Show Trend . TRUE/FALSE to show trendlines on the chart Follow Trend. If TRUE , Dapitrend will show only
TrendWavePattern  an another way to trade with a harmonic pattern, a maestro classic pattern . I made some improvements and combinations with my own strategy. Trend direction, buy-sell signal ,hi-low area and pivot line. These will be helpful for trader to read the current market condition. So it is not blindly following the pattern itself but also following other informations from the market. Readable chart appearance . Designed to be user friendly even you are a new trader. BUY-SELL zone, Tak
It is an expert advisor that scans the last patterns on defined symbols and timeframes . Multi Symbols /pairs , Multi timeframes .  There are 2 ways to specify symbols : Automatically scan all symbols available on the market watch (true/false) Type any symbols ,separated by comma.   There are also 2 ways to specify timeframes : Automatically scan all timeframes available on mt4 (true/false) Type any timeframes,separated by comma.   Unlimited symbols available in an account and unlimited timefra
GOLDEN RETRACEMENT POWER indicator draws fibonacci levels automatically. Defines the golden entry buy/sell area, support and resistant lines , signals arrows and strength 'Power Bars Level' based on price action . Some indicators also work behind the chart: Stochastic,RSI,MFI,DeMarker and WPR . Fibonacci retracements are a popular form of technical analysis used by traders in order to predict future potential prices in the financial markets. If used correctly, Fibonacci retracements and ratios c
Lemurian Trader is a multi symbols  EA/robot. User can input symbols in the external parameter separated by comma. Only need to place on the single chart, no need to open multiple chart,no limited symbols as long the symbol is available on the market watch. Sweeping signals from timeframe M15 to H4 on each symbol to find the best high/low price while it also keeps to follow the trend. Lower TF M15 as a signal and higher(M30,H1,H4) to indentify trend and high low. It means whatever timeframe we p
RSI Scanner Plus Indicator scans RSI values in multiple symbols and timeframes. Plus trend line buffer on the chart.  Features: -Trend Line :  We add trend line on the chart in the hope it help you to see current trend on the chart while following oversold and overbought  from RSI. This is additional feature in the indicator. We consider that following the trend is very important in trading. -Changeable Panel Display :  Change the value of Max.Symbols/Panel and  the indicator will adjust the da
TrendScanner XTra scans market trends from Multi Symbols and Multi Timeframes with extra additional Entry Point Signals arrow on the current chart. Features: -Entry Point SIgnals :  This is additional feature in the indicator. No repaint arrows. The Trading system in the single indicator. MTF Trend informations and Entry Signals. In order to make it easier for trader to get trading moments from a single chart and  deciding entry time.  -Changeable Panel Display :  Change the value of Max.Symbol
PullbackMatrix provides the key information of the trading transactions when it finds the right market moment based on its built-in logic algorithm. The high accuracy signals including Trading Symbol, Entry Price, Entry Time, TakeProfit, Stoploss, and more. And that's all will be available instantly in your chart panel, drawing the position lines and also sending signal notification to email, mobile phone, and screen popup. More important is that also saves signals into a .csv file which is usef
Non-repaint indicator    to identify trade opportunities in swing action as prices move within an upper and lower band. Inspired by the Keltner Channel, the most popular channel Indicator introduced by Chester Keltner. It is different with a Bollinger Bands. It represents volatility using the high and low prices, while Bollinger's studies rely on the standard deviation. Customized by adding the trends exactly in the middle line, arrows when price cross over the outer lines and Fibonacci Levels L
A professional trading indicator with double-entry options. Valuable Smooth Channel Lines on the separated window, Trend Lines both on the main window, and separated window and entry arrows. Good for trading scalping in the lower timeframes. Even also it can work and provide signals in the higher timeframes for longer-term trading periods.  INDICATOR SETTINGS: 1.  Signal Mode. There are 2 options: Default and Compact. If Default, it will provide 3 different arrow codes on the main window. This o
Provides Regression Channel on the current chart. Combined by Trend of Moving Averages and Multi timeframes Oscillator Indicators: CCI, RSI, Stochastic, and MACD with specific working logic . It could make us easier to identify swing high-low as an entry point, the retracement area while following the current trend. Consists of 2 types of signal, main and secondary. The main signal will draw very clearly triangle and lines on the chart with the word " BUY" or 'SELL'. and the secondary is the sta
It could help to calculate Risk-Reward easily before placing a BUY-SELL position. TradeSizeCalculator is a Multi-Tasking Calculator. It will calculate the others when we define the value in one of the columns. Stoploss, risk percentage, risk-money, lot size, take-profit , reward-money, and reward-ratio. Depending on which value is changed. All values in the columns are editable. Also, we can get those calculation results by drag-drop the stop-loss/take-profit line. Parameter: The inputs below ar
MACD Scanner provides the multi symbols and multi-timeframes of MACD signals. It is useful for trader to find the trading idea quickly and easily. User-friendly, visually clean, colorful, and readable. Dynamic dashboard display that can be adjusted thru the external input settings. Total Timeframes and Total symbols as well as the desired total rows/panel, so it can maximize the efficiency of using the chart space. The Highlight Stars on the certain matrix boxes line based on the selected Scan M
It has 3 capabilities at once and can be adjusted according to needs. Full Auto, Semi-Auto, or Warning Signals only. You can choose it by setting the parameters provided. Built to help Traders work much easier than doing it manually. Sharpen the accuracy of market analysis performed by a Trader by only executing in certain price areas and adjustable signal parameters. Features Ability to manage trading management, including automatically determining stop loss/take profit, calculating lot size ba
SignalPinner is a trend line Indicator which can detect market trends early by including three types of signal arrows. Non repaint and trend following. Signals on the strong trend, signals in the beginning of trend and signals with multiple market analysis algorithm as the main signals. Supported by alert notification message to keep you getting signals while on the go. Symbols: Any Timeframes: Any Features Histogram buffers as a sign the trend is started. It can help the trader knowing the mar
Scanning   Multi Symbols Scalping Signals based on 3 kinds of Market Analysis methods. Trend, Signal, and Reversator. And each method consists of its own multi timeframes algorithm functions. Summarized to become clear signals direction BUY/SELL, including the signals strength scoring and sending message to all available alert tools. Displayed on a User Friendly and customizable Dashboard. Size, colors, coordinates, highlight, hidden/show and more. Base Timeframe: M15. And M5 to Daily to confirm
ChartGetSignal
Wartono
1 (1)
Provides instant signals on the chart in panel form. Equipped with signal description and trading analysis tools such as drawing auto trendlines, support/resistance area, regression channel, Fibonacci levels, Pivot levels and current signal price, signal time, signal expiry and stoploss recommendation. Also sending alert messages to all available mt4 alert tool. A detailed description panel provides information about where the signal comes from and what indicators are behind the signal. Includin
필터:
리뷰 없음
리뷰 답변