Colored Channels

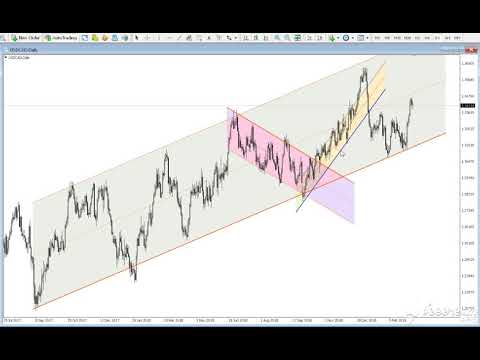
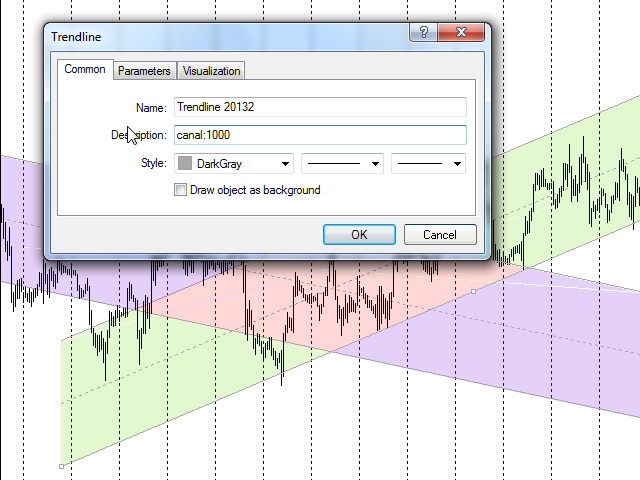
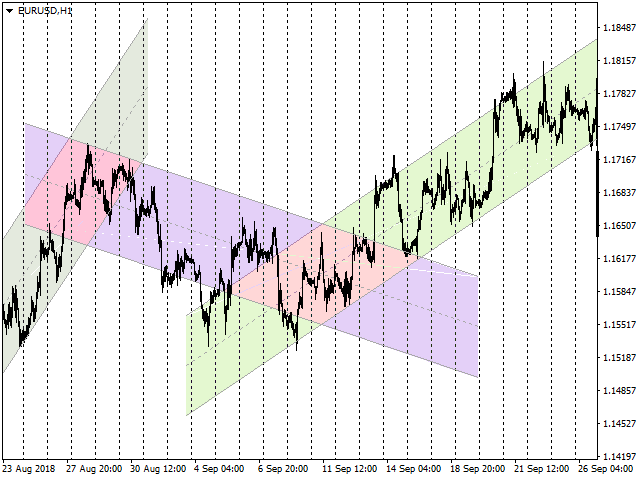
This program is for traders who plot price channels on charts. You just need to specify the width of the channel in the description of the trend line. Enter the "Description" field in the trend line properties and type canal: xxxxx without a space, where xxxxx is the width of the channel in pips. Channel color is set automatically depending on the channel width. The middle line of the channel is also automatically drawn. If the channel width is set to a positive number, the channel is drawn above the trend line, and if negative, then below the trend line. At any time you can change the length and direction of the trend line. Any other text in the trend line description is allowed, for example, parameter1 canal: xxxxx parameter2 .

First try out the demo version for free.

Input parameters 

  • Color intencity - color intensity, 1-128;
  • Middle line style - middle line style.


추천 제품
Going straight
Maryna Shulzhenko
American traders say: “Trend is your friend”, which means “Trend is your friend”. And indeed it is! By trading with the trend, you reduce your risks and gain an advantage, as you increase the mathematical expectation of completed trades and, therefore, earn more profit. Together with the Going straight indicator you will trade with the trend with ease! This is one of the most effective ways to deal with market trends. Trading strategies using the channel indicator belong to the classic methods
Auto Fibo Pro m
DMITRII GRIDASOV
"Auto FIBO Pro" Crypto_Forex 지표 - 거래에 유용한 보조 도구입니다! - 지표는 자동으로 Fibo 수준과 로컬 추세선(빨간색)을 계산하여 차트에 배치합니다. - Fibonacci 수준은 가격이 반전될 수 있는 주요 영역을 나타냅니다. - 가장 중요한 수준은 23.6%, 38.2%, 50%, 61.8%입니다. - 역전 스캘핑이나 존 그리드 거래에 사용할 수 있습니다. - Auto FIBO Pro 지표를 사용하여 현재 시스템을 개선할 수 있는 기회도 많습니다. - Info Spread Swap Display가 있습니다. 현재 Spread와 Swap이 부착된 외환 쌍을 표시합니다. - 디스플레이에는 계정 잔액, 자본 및 마진도 표시됩니다. - 차트의 어느 모서리에서나 Info Spread Swap Display를 찾을 수 있습니다. 0 - 왼쪽 상단 모서리, 1 - 오른쪽 상단, 2 - 왼쪽 하단, 3 - 오른쪽 하단. 여기를 클릭하여 고품질 트레이딩 로봇과
Free automatic fibonacci
Tonny Obare
4.67 (49)
Free automatic Fibonacci is an indicator that automatically plots a Fibonacci retracement based on the number of bars you select on the BarsToScan setting in the indicator. The Fibonacci is automatically updated in real time as new highest and lowest values appears amongst the selected bars. You can select which level values to be displayed in the indicator settings. You can also select the color of the levels thus enabling the trader to be able to attach the indicator several times with differe
FREE
Octave Fractal Channel — Dynamic Gann-Based Support/Resistance Levels with Auto-Scaling. This indicator plots a dynamic channel based on the fractal structure of price movement. Channel levels adapt to the current symbol and timeframe, making it suitable for use across various financial instruments — from currency pairs to cryptocurrencies and indices. The indicator can be used in combination with other technical tools, such as the RSI oscillator, to provide additional signal filtering. How to
The indicator detects and displays Shark harmonic pattern (see the screenshot). The pattern is plotted by the extreme values of the ZigZag indicator (included in the resources, no need to install). After detecting the pattern, the indicator notifies of that by a pop-up window, a mobile notification and an email. The indicator highlights the process of the pattern formation and not just the complete pattern. In the former case, it is displayed in the contour triangles. After the pattern is comple
The indicator detects and displays М. Gartley's Butterfly pattern. The pattern is plotted by the extreme values of the ZigZag indicator (included in the resources, no need to install). After detecting the pattern, the indicator notifies of that by the pop-up window, a mobile notification and an email. The pattern and wave parameters are displayed on the screenshots. The default parameters are used for demonstration purposes only in order to increase the amount of detected patterns. Parameters z
TrendInChannel
Andriy Sydoruk
This indicator is the undisputed leader among the indicators. And for this statement there is a good reason. The indicator builds a very high quality channel in which it generates signals to enter! What is the ideal strategy for the trader, since the trader always hesitates when choosing a strategy for the job. That is, this indicator will allow you to solve the dilemma of choosing a job by trend or to the channel, since it combines these two basic concepts. Working with the indicator is very
The indicator detects and displays 3 Drives harmonic pattern (see the screenshot). The pattern is plotted by the extreme values of the ZigZag indicator (included in the resources, no need to install). After detecting the pattern, the indicator notifies of that by a pop-up window, a mobile notification and an email. The indicator highlights the process of the pattern formation and not just the complete pattern. In the former case, it is displayed in the contour triangles. After the pattern is com
Koala Supply Demand
Ashkan Hazegh Nikrou
5 (3)
MetaTrader 4용 Koala 공급 수요 지표 소개 (긍정적이든 부정적이든 귀하의 리뷰나 피드백을 공유하여 다른 트레이더가 귀하의 경험을 통해 이익을 얻을 수 있도록 해주세요.) : 코알라 공급 및 수요 지표에 오신 것을 환영합니다. 이 지표는 끊임없는 공급 및 수요 지역을 식별하기 위해 설계되었습니다. 이 지표는 트레이더가 시장을 지역 영역으로 볼 수 있도록 도와주며 가격이 어떻게 강력한 지역을 존중하는지 확인할 수 있습니다. 또한 이 지표는 지역 내에서 형성된 가격 행동 신호를 보여줄 수도 있습니다.  코알라 트레이딩 솔루션 채널 에 가입하여 모든 코알라 제품에 대한 최신 소식을 확인하십시오. 가입 링크는 다음과 같습니다: https://www.mql5.com/en/channels/koalatradingsolution https://www.mql5.com/en/blogs/post/755700 !중요 : 이 제품에는 무료 전문가 고문 (EA)가 포함되어 있습니다. 구매 후
FREE
Fractal Zig Zag
Mikhail Nazarenko
A   professional version of the ZigZag indicator for visualizing the structure of price movements by fractals. Fractal ZigZag fixes the flaws of the standard version of the ZigZag indicator MT4. It uses Price action and a unique filtering algorithm to determine fractals. Suitable for all types of trading. Ideal for trading according to the WM pattern "Sniper" strategy !!! Features Marks the place of price reversal during the formation of a new fractal with specified parameters. Suitable for al
Trend Ray
Andriy Sydoruk
The indicator shows the potential trend direction by cyclical-wave dependence. Thus, all the rays of the intersection will be optimal rays, in the direction of which the price is expected to move, taking into account the indicator period. Rays can be used as a direction for potential market movement. But we must not forget that the approach must be comprehensive, the indicator signals require additional information to enter the market.
OrderBlock TS Roman
Vladislav Vlastovskii
3.8 (5)
Индикатор строит блоки заказов (БЗ) по торговой системе (ТС) Романа. Поиск блоков осуществляется одновременно на двух таймфремах: текущем и старшем (определяемым в настройках). Для оптимизации и игнорирования устаревших блоков в настройках задается ограничение количества дней в пределах которых осуществляется поиск блоков. Блоки строятся по правилам ТС состоящем из трех шагов: какую свечу вынесли (что?); какой свечой вынесли (чем?); правило отрисовки (как?).
FREE
The   Trendlines Oscillator   helps traders identify trends and momentum based on the normalized distances between the current price and the most recently detected bullish and bearish trend lines. The indicator features bullish and bearish momentum, a signal line with crossings, and multiple smoothing options. USAGE The   Trendlines Oscillator   works by systematically: Identifying pivot highs and lows. Connecting pivots to form bullish (support) and bearish (resistance) trendlines. Measuring
Nice Trade Point
Muhammed Emin Ugur
This    Nice Trade Point     indicator is designed for signal trading. This indicator generates trend signals. It uses many algorithms and indicators to generate this signal. It tries to generate a signal from the points with the highest trend potential. This indicator is a complete trading product. This indicator does not need any additional indicators. The indicator certainly does not repaint. The point at which the signal is given does not change.     Features and Suggestions Time Frame
Price Magnets
Ivan Simonika
Price Magnet — Price Density and Attraction Levels Indicator Price Magnet is a professional analytical tool designed to identify key support and resistance levels based on statistical Price Density. The indicator analyzes a specified historical period and detects price levels where the market spent the most time. These zones act as “magnets,” attracting price action or forming a structural base for potential reversals. Unlike traditional Volume Profile tools, Price Magnet focuses on price-time d
ZLMA Trend Candles indicator uses an enhanced Zero-Lag Moving Average to highlight key trend shifts, repainting candles in real time. It reacts faster than traditional moving averages, helping you spot potential market turns earlier. Gain clear entry and exit signals and filter out market noise with ease! This product is also available for MetaTrader 5 =>  https://www.mql5.com/en/market/product/129278 1. What Is ZLMA Trend Candles? ZLMA Trend Candles is a MetaTrader 4/5 indicator based on the Z
FreqoMaster
Stanislav Korotky
The main idea of this indicator is rates analysis and prediction by Fourier transform. The indicator decomposes exchange rates into main harmonics and calculates their product in future. The indicator shows 2 price marks in history, depicting price range in the past, and 2 price marks in future with price movement forecast. Buy or sell decision and take profit size are displayed in a text label in the indicator window. The indicator uses another indicator as an engine for calculations - FreqoMet
Update:ver1.53 (2023/08/16) ・概要と必要環境 手動発注もしくは他ツール等からの発注に対し、指値発注予約の複製を生成します。こちらは「発注操作の簡易化」に特化したものになります。発注判断となる分析は、資料を漁る、経験則を導く、他の分析ツールやEAを併用する等、利用者ご自身で頑張ってください。なお、ver1.28より、「決済後、自動で再発注する」機能が実装されました。(有償版でのみ有効化できます) ・導入と導入後の操作 導入そのものは簡単です。「自動売買可能なEA」として、適当なチャートにて動作させるだけです。(チャートの対象相場は問いません。このEAは、チャートを見ていません)。あとは、「このEAでのローカルコピー以外の発注」があれば、それに応じて「損失が出た場合に備えての追加取引の予約」という形で、指値発注が自動生成されます。 導入操作上の注意として、「本EAを、複数のチャートで動作」はできません。EAがチャート自体を見ておらず、注文状況だけを見ているため、複数のチャートで動かす意味もありません。また、ターミナルとEAの設定として「自動売買」を許可しない
FREE
The indicator displays Renko bars on the chart, uses them to plot the ZigZag - trend lines connecting the local Lows and Highs of the price movement, and highlights them based on the Gartley patterns, showing the potential price reversal points. Renko - specialized display of the price action, in which the graph is displayed not every bar of the time frame, but only under the condition that the price had passed more than the specified number of points. Renko bars are not bound to a time frame, s
Rainbow Price Visualizer
Vincent Jose Proenca
Rainbow Price Visualizer v1.21 See where the market really breathes. Turns your MT4 chart into an ultra-precise heatmap that highlights price zones favored by big players. Why it matters 300 price levels at 0.2‑pip resolution — microscopic detail. 8 visual themes (Rainbow, Fire, Ocean…) for instant readibility. Smart opacity: low noise fades, real zones pop. Lightweight rendering with automatic cleanup. Fully customizable: saturation, opacity, resolution, history depth. Bands project into the f
This indicator is the logical continuation of the well-known equidistant channel indicator: https://www.mql5.com/en/market/product/8723 . The main purpose of the indicator is the visualization of price levels relative to the parallel channel using Fibo Bobokus levels in a separate window and the price history. This often allows forecasting the future price movement with a sufficiently high degree of probability. The Fibo levels calculation equation is as follows: FiboLevel = (50-(100*((Close[i]-
Donchian Trend Histogram
Mariusz Piotr Rodacki
Donchian channels are a tool in technical analysis used to determine the relative volatility of a market and the potential for price breakouts. Can help identify potential breakouts and reversals in price, which are the moments when traders are called on to make strategic decisions. These strategies can help you capitalize on price trends while having pre-defined entry and exit points to secure gains or limit losses. Using the Donchian channel can thus be part of a disciplined approach to managi
FREE
Simple Long Short Bar A very concise and clear indicator, very easy to understand, but it is very useful for tracking trends. The usage of this indicator is very simple: Long signal: If the price shows signs of a long market, then a yellow box will appear. Short signal: If the price shows signs of a short market, then a blue box will appear. Bull strength: If the size of the box is large, it means the bull strength is strong, and vice versa. Short strength: If the size of the box is small, it m
Order Blocks Breaker
Suvashish Halder
5 (2)
Introducing Order Blocks Breaker , a brand-new way to identify and leverage order blocks in your trading strategy. After developing multiple order block tools with unique concepts, I’m proud to present this tool that takes things to the next level. Unlike previous tools, Order Blocks Breaker not only identifies order blocks but also highlights Breaker Order Blocks —key areas where the price is likely to retest after a breakout. MT5 -  https://www.mql5.com/en/market/product/124102/ This tool inco
Aroon Classic
Etsushi Ishizuka
Aroon Classic 지표 개요 Aroon Classic 지표는 차트에서 추세의 발생과 지속성을 정량적으로 파악할 수 있는 기술적 도구입니다. “Aroon Up”과 “Aroon Down” 두 개의 라인을 사용해 추세 강도와 전환 시점을 0~100 범위로 표시합니다. Aroon Up 값이 높을수록 강한 상승 추세를, Aroon Down 값이 높을수록 강한 하락 추세를 의미합니다. 주요 특징 추세의 시작과 전환을 시각적으로 구분 계산 기간(기본값: 14)을 사용자 지정 가능 라인 색상, 두께, 스타일을 유연하게 설정 지표 매개변수 매개변수 설명 기본값 Period Aroon 계산에 사용되는 바 수 14 Aroon Up Color Aroon Up 라인 색상 DodgerBlue Aroon Down Color Aroon Down 라인 색상 Tomato Line Width 라인 두께(픽셀) 2 계산 방법 Aroon Up은 지정 기간 내 최고점 이후 경과한 바 수를 다음 공식으로 계산합니다:
FREE
EARLY REMINDER: The Starting price is 65 price will rise soon up to 365$ and then 750$ after first 10 copies of sales. Grab this offer now! Introduction Hello, traders! Welcome to the demonstration of the Forex Beast Indicator , a comprehensive tool designed to assist aspiring traders in navigating the complexities of the forex market. This indicator incorporates seven essential components to provide a well-rounded trading experience: Moving Averages Colored Zones Support and Resistance Levels
Crypto_Forex 지표 HTF Ichimoku for MT4. - Ichimoku 지표는 가장 강력한 트렌드 지표 중 하나입니다. HTF는 - Higher Time Frame을 의미합니다. - 이 지표는 트렌드 트레이더와 가격 액션 항목과의 조합에 탁월합니다. - HTF Ichimoku 지표를 사용하면 더 높은 타임프레임의 Ichimoku를 현재 차트에 첨부할 수 있습니다. - 상승 추세 - 파란색 선 위에 빨간색 선(두 선 모두 클라우드 위에 있음) / 하락 추세 - 파란색 선 아래에 빨간색 선(두 선 모두 클라우드 아래에 있음). - 가격이 Ichimoku 클라우드 상단 테두리를 돌파했을 때만 BUY 주문을 엽니다. - 가격이 Ichimoku 클라우드 하단 테두리를 돌파했을 때만 SELL 주문을 엽니다. - HTF Ichimoku 지표는 큰 트렌드를 포착할 수 있는 기회를 제공합니다. 여기를 클릭하여 고품질 트레이딩 로봇과 지표를 확인하세요! 이 MQL5 웹사이트에서만
The Auto Fibonacci Indicator is a professional technical analysis tool that automatically draws Fibonacci retracement levels based on the most recent closed Daily (D1) or 4-Hour (H4) candle. These levels are widely used by traders to identify key support , resistance , and trend reversal zones . This version is designed for manual trading and supports a powerful trading strategy using Fibonacci levels combined with a 50-period EMA (Exponential Moving Average) , which you can easily add from MT4
FREE
Constructor
Aleksey Semenov
Constructor is a convenient tool for creating, (building strategies) testing and applying trading strategies and ideas, as well as testing and using separate indicators and their groups. Constructor includes opening, closing, deal tracking, averaging and recovery modules, as well as various trading options with and without averaging and martingale. You are able to connect up to 10 different external indicators. Find the detailed instructions in the attached pdf file. Trading settings averaging
FREE
Trend Filter Pro
Aleksandr Makarov
5 (1)
Special offer in honor of the New Year and Christmas!! https://www.mql5.com/ru/users/bossik2810 Trend Filter Pro Trend filter indicator. Very good filter for your trading system, I recommend to use it together with - System Trend Pro   or  Quantum Entry PRO The indicator no repaint!!! Settings: Change the Period parameter for better filtering ( default is 90) Any questions? Need help?, I am always happy to help, write me in private messages or In Telegram: https://t.me/Trader35_Admin
FREE
이 제품의 구매자들이 또한 구매함
Local Trade Copier EA MT4
Juvenille Emperor Limited
4.96 (108)
Local Trade Copier EA MT4 를 사용하여 매우 빠른 거래 복사 경험을 해보세요. 1분 안에 간편하게 설정할 수 있으며, 이 거래 복사기를 사용하면 Windows 컴퓨터 또는 Windows VPS에서 여러 개의 MetaTrader 터미널 간에 거래를 0.5초 미만의 초고속 복사 속도로 복사할 수 있습니다. 초보자든 전문가든 Local Trade Copier EA MT4 는 다양한 옵션을 제공하여 사용자의 특정 요구에 맞게 맞춤 설정할 수 있습니다. 이는 수익 잠재력을 높이려는 모든 사람을 위한 최고의 솔루션입니다. 지금 사용해보시고 이것이 왜 시장에서 가장 빠르고 쉬운 무역용 복사기인지 알아보세요! 팁: 여기 에서 데모 계정에서 Local Trade Copier EA MT4 데모 버전을 다운로드하여 사용해 볼 수 있습니다. 다운로드한 무료 데모 파일을 MT4 >> File >> Open Data Folder >> MQL4 >> Experts 폴더에 붙여넣고 터미널
Trade Assistant MT4
Evgeniy Kravchenko
4.42 (193)
거래당 위험 계산, 라인을 사용한 손쉬운 신규 주문, 부분 청산 기능을 통한 주문 관리, 7가지 유형의 트레일링 스탑 및 기타 유용한 기능을 제공합니다. 추가 자료 및 지침 설치 지침 - 애플리케이션 지침 - 데모 계정용 애플리케이션 평가판 라인 기능       - 차트에 개시선, 손절매, 차익실현을 표시합니다. 이 기능을 사용하면 새로운 주문을 쉽게 하고 개봉 전에 추가 특성을 볼 수 있습니다. 위기 관리       -       위험 계산 기능은 설정된 위험과 손절매 주문의 크기를 고려하여 새 주문의 볼륨을 계산합니다. 이를 통해 손절매 크기를 설정하고 동시에 설정된 위험을 존중할 수 있습니다. 로트 계산 버튼 - 위험 계산을 활성화/비활성화합니다. 필요한 위험 값은 위험 필드에 0에서 100 사이의 백분율 또는 예금 통화로 설정됩니다. 설정 탭에서 위험 계산 옵션을 선택합니다. $ 통화, % 잔액, % 지분, % 자유 마진, % 사용자 정의, % AB 이전 일, % AB
Exp COPYLOT CLIENT for MT4
Vladislav Andruschenko
4.69 (65)
MetaTrader 4용 트레이드 복사기.       모든 계정의 외환 거래, 포지션, 주문을 복사합니다. 그것은 최고의 무역 복사기 중 하나입니다       MT4 - MT4, MT5 - MT4       위해       카피롯 MT4       버전(또는       MT4 -  MT5   MT5 - MT5       위해       카피롯 MT5       버전). MT5 버전 전체 설명   +DEMO +PDF 구입 방법 설치하는 방법     로그 파일을 얻는 방법     테스트 및 최적화 방법     Expforex의 모든 제품 복사기   버전         MetaTrader 5   터미널 (   МТ5 - МТ5, МТ4 - МТ5   ) -   Copylot Client MT5 고유한 복사 알고리즘은 마스터 계정에서 고객 계정으로 모든 거래를 정확하게 복사합니다. 이 제품은 또한 높은 작동 속도에서 높은 오류 처리로 유명합니다. 강력한 기능 세트. 프로그램은 여러 터
Trade Manager EA에 오신 것을 환영합니다. 이 도구는 거래를 보다 직관적이고 정확하며 효율적으로 만들기 위해 설계된 궁극적인 리스크 관리 도구 입니다. 단순한 주문 실행 도구가 아닌, 원활한 거래 계획, 포지션 관리 및 리스크 제어를 위한 종합 솔루션입니다. 초보자부터 고급 트레이더, 빠른 실행이 필요한 스캘퍼에 이르기까지 Trade Manager EA는 외환, 지수, 상품, 암호화폐 등 다양한 시장에서 유연성을 제공합니다. Trade Manager EA를 사용하면 복잡한 계산은 이제 과거의 일이 됩니다. 시장을 분석하고 진입, 손절 및 익절 수준을 차트의 수평선으로 표시한 후 리스크를 설정하면, Trade Manager가 이상적인 포지션 크기를 즉시 계산하고 SL 및 TP 값을 실시간으로 표시합니다. 모든 거래가 간편하게 관리됩니다. 주요 기능: 포지션 크기 계산기 : 정의된 리스크에 따라 거래 크기를 즉시 결정합니다. 간단한 거래 계획 : 진입, 손절, 익절을 위한
Copy Cat More Trade Copier MT4 (복사 고양이 MT4) 는 단순한 로컬 트레이드 카피어가 아니라, 오늘날의 거래 환경을 위해 설계된 완전한 리스크 관리 및 실행 프레임워크입니다. Prop Firm 챌린지부터 개인 계좌 관리까지, 강력한 실행력, 자본 보호, 유연한 설정, 고급 거래 처리 기능을 통해 모든 상황에 적응합니다. 이 카피어는 Master(송신자) 와 Slave(수신자) 모드 모두에서 작동하며, 실시간으로 시장가/지정가 주문, 거래 수정, 부분 청산, Close By 작업을 동기화합니다. 데모 및 실계좌 모두 호환되며, 거래용 비밀번호 또는 투자자 비밀번호로도 사용할 수 있습니다. Persistent Trade Memory 기술을 통해 EA, 터미널, VPS가 재시작되더라도 거래가 복원됩니다. 여러 Master와 Slave를 동시에 관리할 수 있으며, 브로커 간 차이는 접두사/접미사 자동 감지 또는 심볼 매핑으로 처리됩니다. 매뉴얼/설정: Copy C
MT4 to Telegram Signal Provider 는 사용하기 쉽고 완전히 사용자 정의가 가능한 도구로, 텔레그램으로 신호를 보내어 계정을 신호 제공자로 변환할 수 있습니다. 메시지 형식은 완전히 사용자 정의가 가능합니다! 그러나 간단한 사용을 위해 미리 정의된 템플릿을 선택하고 메시지의 특정 부분을 활성화하거나 비활성화할 수도 있습니다. [ 데모 ]  [ 매뉴얼 ] [ MT5 버전 ] [ 디스코드 버전 ] [ 텔레그램 채널 ]  New: [ Telegram To MT5 ] 설정 단계별 사용자 가이드 가 제공됩니다. 텔레그램 API에 대한 지식이 필요 없으며, 개발자가 필요한 모든 것을 제공합니다. 주요 기능 구독자에게 보낸 주문 세부 정보를 사용자 정의할 수 있는 기능 예를 들어 브론즈, 실버, 골드와 같은 계층 구독 모델을 만들 수 있습니다. 골드 구독은 모든 신호 등을 받게 됩니다. ID, 심볼 또는 코멘트별 주문 필터링 주문이 실행된 차트의 스크린샷을 포함 보낸
Trade Dashboard MT4
Fatemeh Ameri
4.96 (53)
Tired of complex order placement and manual calculations? Trade Dashboard is your solution. With its user-friendly interface, placing orders becomes effortless, by a single click, you can open trades, set stop loss and take profit levels, manage trade lot size, and calculate risk to reward ratios, allowing you to only focus on your strategy. Say goodbye to manual calculations and streamline your trading experience with Trade Dashboard. Download  Demo Version  right now. You can find  Details of
The product will copy all telegram signal to MT4   ( which you are member  ) , also it can work as remote copier.  Easy to set up, copy order instant, can work with almost signal formats, image signal, s upport to translate other language to English Work with all type of channel or group, even channel have "Restrict Saving Content", work with  multi channel, multi MT5 Work as remote copier: with signal have ticket number, it will copy exactly via ticket number. Support to backtest signal. How to
Smart Channel M4
Vahidreza Heidar Gholami
The trend in the market can be predicted using trend lines but the problem is you don’t know where exactly the price is going to touch the trend line where you can put your pending orders on. Smart Channel Expert Advisor makes it possible to put an advanced channel around the price data, which can be configured to handle placing orders, opening and closing positions, managing risk per trade, spread, slippage, and trailing stop-loss and take-profit automatically. Features Money Management (Calcul
VirtualTradePad mt4 Extra
Vladislav Andruschenko
4.86 (59)
한 번의 클릭으로 거래할 수 있는 거래 패널.   위치 및 주문 작업!   차트 또는 키보드에서 거래. 거래 패널을 사용하면 차트에서 클릭 한 번으로 거래하고 표준 MetaTrader 컨트롤보다 30배 빠르게 거래 작업을 수행할 수 있습니다. 거래자의 삶을 더 쉽게 만들고 거래자가 훨씬 빠르고 편리하게 거래 활동을 수행할 수 있도록 도와주는 매개변수 및 기능의 자동 계산. 차트의 무역 거래에 대한 그래픽 팁 및 전체 정보. MT5 버전 전체 설명   +DEMO +PDF 구입 방법 설치하는 방법     로그 파일을 얻는 방법     테스트 및 최적화 방법     Expforex의 모든 제품 열기 및 닫기, 반전 및 잠금, 부분 닫기/오토로트. 가상/실제 손절매/이익 실현/후행 정지/손익분기점, 주문 그리드 .... MetaТrader 4   의 주요 요청 거래 제어판   : 구매, 판매, 구매 중지, 구매 제한, 판매 중지, 판매 제한, 닫기, 삭제, 수정, 후행 중지, 손절매,
Take a Break
Eric Emmrich
5 (31)
One tool to protect all your EAs — news filter, equity protection, time filter and more — free demo available Take a Break has evolved from a basic news filter into a comprehensive account protection solution. It pauses your other Expert Advisors during news events or based on custom filters. When trading resumes, it automatically restores your entire chart setup , including all EA settings. Typical use cases: One news filter for all your EAs. Pause trading during news or high volatility — and c
Exp Averager
Vladislav Andruschenko
4.82 (22)
Exp-Averager는   평균 거래를 개시하여 특정 하락폭을 받은 거래를 평균화하도록 설계되었습니다. 고문은 추세에 맞춰 또는 현재 추세에 반대하여 새로운 위치를 열 수 있는 능력이 있습니다. 또한 일련의 위치에 적용되는 스마트 트레일링 스톱 기능도 포함되어 있습니다. 고문은 직위의 로트 크기를 늘리거나 줄일 수 있습니다. 이는 손실 포지션을 평균 가격으로 가져오기 위해 널리 사용되는 전략입니다. MT5 버전 전체 설명 +DEMO +PDF 구입 방법 설치하는 방법     로그 파일을 얻는 방법     테스트 및 최적화 방법     Expforex의 모든 제품 연결 TickSniper   스캘퍼   의 평균화 시스템 예 평균화 기능을 갖춘 범용 트레이딩 어드바이저   The X Expert Advisor는 차트가 첨부된 통화 쌍에 대해 작업합니다. 예를 들어 EURUSD에 대한 평균을 활성화하려면 EURUSD 차트를 열고 Expert Advisor를 실행하십시오. 메모
Comprehensive on chart trade panel with the unique ability to be controllable from mobile as well. Plus has a library of downloadable configuration, e.g. exit rules, extra panel buttons, pending order setup and more. Please see our product video. Works with all symbols not just currency pairs. Features On chart panel plus controllable from free app for Windows, iPhone and Android Built-in script engine with library of downloadable configuration, e.g. add 'Close All Trades in Profit' button, exit
Trading History MT4
Siarhei Vashchylka
5 (9)
Trading History - A program for trading and money management on the history of quotes in stratagy tester. It can work with pending and immediate orders, and is equipped with trailing stop, breakeven and take profit functions. Very good for training and testing different strategies. Manual (Be sure to read before purchasing) Advantages 1. Allows you to test any trading strategy in the shortest possible time 2. An excellent simulator for trading training. You can gain months of trading experience
Exp4 Duplicator
Vladislav Andruschenko
4.5 (22)
Expert Advisor   는   귀하의 계정 MetaTrader 4   에서 사전 설정된 횟수만큼 거래 및 포지션을 반복하거나 신호를 보냅니다. 수동으로 또는 다른 Expert Advisor에 의해 열린 모든 거래를 복사합니다. 신호를 복사하고 신호에서 로트를 늘립니다   ! 다른 EA의 수를 늘립니다. 다음 기능이 지원됩니다: 복사된 거래에 대한 사용자 지정 로트, 손절매 복사, 이익 실현, 후행 정지 사용. MT5 버전 전체 설명 +DEMO +PDF 구입 방법 설치하는 방법     로그 파일을 얻는 방법     테스트 및 최적화 방법     Expforex의 모든 제품 연결 MetaTrader용 무역 복사기는 여기에서 사용할 수 있습니다:   COPYLOT 주목 참고: 터미널 간 거래를 위한 복사기가 아닙니다. 전략 테스터에서 Expert Advisor를 테스트하고 비주얼 모드에서 EAPADPRO 도구 모음과 거래할 수 있습니다! 1개의 통화 쌍에 EA를 설치하는 것
Eezeorder 2
Tawanda Tinarwo
5 (2)
NEW VERSION!  NB: IF YOU ARE USING A VERY HIGH RESOLUTION MACHINE AND THE EA DISPLAY LOOKS TOO SMALL, CONTACT ME SO I CAN HELP YOU. Open Multiple Trades on MT4 in 1 click at one price. Enter the Lot size Specify the number of trades you want to open Choose whether you want TP SL or Trailing Stop Once you are done, click Buy or Sell Open Multiple Pending Orders on MT4 in 1 click at one price. Enter the Lot size Specify the gap from the current price, where you want to place the pending order Spe
설명 TradeSync Pro는 동일한 컴퓨터에서 실행되는 MetaTrader 터미널 간의 로컬 거래 동기화를 위해 설계된 기술 유틸리티입니다. 이 프로그램은 계좌 관리, 다양한 브로커 간의 체결 비교 및 전략적 거래 복제(replication)에 최적화되어 있습니다. 라이선스 및 크로스 플랫폼 호환성 이 소프트웨어는 사용되는 플랫폼에 따라 다양한 동기화 시나리오를 지원합니다. 다음 요구 사항을 참고하십시오:   단일 플랫폼: MT4에서 MT4로 복사하려면 MT4 버전이 필요합니다. MT5에서 MT5로 복사하려면 MT5 버전이 필요합니다.   크로스 플랫폼: MT4와 MT5 간(양방향)에 동기화하려면 사용자는 제품의 MT4 및 MT5 버전을 모두 보유해야 합니다.   설치: 로컬 연결을 설정하려면 두 터미널이 동일한 하드웨어에서 실행되어야 합니다. 기술 기능 목록 송신 모드 (Transmitter):   로컬 파일 시스템으로 거래 작업을 실시간 브로드캐스팅합니다.   매직 넘버(Ma
--------------Welcome to use [MQL5 Signal Analyze Master]------------------  Function: Draw order tracks of MQL5 MT4 and MT5 signal on MT4 chart. [Using guide] 1.Use it as Experts. 2.Download history record from MQL5 signal(MT4 signal or MT5 signal).  3.Paste history record file below "MQL4/Files/" 4.Load [Signal Analyze Master] on the symbol chart what you want to analyze. 5.Paste the history record file name to parameter 'FileName' 6.Select  SignalType  match the history you download on MT4
News Filter EA that send you a Push notification to your MT4 phone APP and TURN OFF MT4 Automatically Before News.  This EA doesn't work in backtest From 1.7 version  the EA have  Close all trades before news functions added. You only need to allow that url in MT4 options: To see the url and how to add it to MT4, visit this post: https://www.mql5.com/en/blogs/post/754402 When Metatrader is turned off, it saves the status of all the charts, indicators and Expert Advisors that you have in them
RSI Divergence Scanner is a multi-timeframe and multi-symbol dashboard and alert that checks all timeframes and symbols to find divergences between price chart and RSI indicator. This divergence scanner is integrated with support and resistance zones so you can check the RSI divergences in the most important areas of the chart to find trend reversals in the price chart. Download demo version   (works on M 1,M5,M30,W1 timeframes) Full description of scanner parameters ->   click here . How to get
Simple and Easy MT4 Trade Panel by Winidecorw I created this EA to make your life easier by making it easier and faster to open your trades. The price will increase progressively, take advantage now! Simplify Your Trading with the Simple and Easy MT4 Trade Panel Are you tired of wasting time setting up each trade in MetaTrader 4? With the simple and easy MT4 trading dashboard, taking your trading to the next level has never been so quick and easy! This Trade Assistant dashboard is the Simple an
MT4 to Discord Signal Provider 는 Discord로 직접 거래 신호를 보내는 데에 설계된 사용자 친화적이고 완전히 맞춤화할 수 있는 유틸리티입니다. 이 도구는 귀하의 거래 계좌를 효율적인 신호 제공자로 변환합니다. 귀하의 스타일에 맞게 메시지 형식을 사용자 정의하세요! 사용 편의성을 위해 사전에 디자인된 템플릿을 선택하고 포함하거나 제외할 메시지 요소를 선택할 수 있습니다. [ 데모 ] [ 매뉴얼 ] [ MT5 버전 ] [ Telegram 버전 ]  New: [ Telegram To MT5 ] 설정 간편한 설정을 위해 저희의 상세한 사용자 가이드 를 따르세요. Discord API에 대한 사전 지식이 필요 없습니다; 필요한 모든 도구를 제공합니다. 주요 기능 구독자 업데이트를 위한 주문 세부 정보를 사용자 정의합니다. 각 계층이 다른 수준의 신호 접근을 제공하는 브론즈, 실버, 골드와 같은 계층적 구독 모델을 구현합니다. 주문이 실행된 차트의 스크린샷을 첨
EasyInsight AIO MT4
Alain Verleyen
4 (2)
EASY Insight AIO – 스마트하고 손쉬운 트레이딩을 위한 올인원 솔루션 개요 외환, 금, 암호화폐, 지수, 심지어 주식까지 — 전 시장을 몇 초 만에, 수동 차트 확인이나 복잡한 설치, 인디케이터 설정 없이 스캔할 수 있다고 상상해 보세요. EASY Insight AIO 는 AI 기반 트레이딩을 위한 궁극의 플러그 앤 플레이(Plug & Play) 데이터 내보내기 도구입니다. 단 하나의 깔끔한 CSV 파일로 전체 시장 스냅샷을 제공하며, ChatGPT, Claude, Gemini, Perplexity 등 다양한 AI 플랫폼에서 즉시 분석할 수 있습니다. 창 전환, 복잡함, 차트 오버레이는 더 이상 필요 없습니다. 자동으로 내보내지는 순수하고 구조화된 데이터 인사이트만으로, 반복적인 차트 감시 대신 데이터 기반의 스마트한 의사결정에 집중할 수 있습니다. 왜 EASY Insight AIO인가요? 진정한 올인원 • 별도의 설정, 인디케이터 설치, 차트 오버레이가 필요 없습
Telegram to MT4 Coppy
Sergey Batudayev
3.75 (8)
Telegram에서 MT4로:   최고의 신호 복사 솔루션 최첨단 유틸리티인   Telegram to MT4를   사용하여 거래를 간소화하세요. DLL 없이도 Telegram 채널과 채팅에서 MetaTrader 4 플랫폼으로 거래 신호를 직접 복사할 수 있습니다. 이 강력한 솔루션은 탁월한 정밀도와 맞춤 설정 옵션을 통해 원활한 신호 실행을 보장하여 시간을 절약하고 효율성을 높여줍니다. [ Instructions and DEMO ] 주요 특징 직접 Telegram API 통합 전화번호와 보안 코드를 통해 인증하세요. 사용자 친화적인 EXE 브리지를 사용하여 채팅 ID를 손쉽게 가져오고 관리하세요. 여러 채널/채팅을 추가, 삭제, 새로 고침하여 동시에 신호를 복사합니다. 고급 필터를 사용한 신호 파싱 사용자 정의 예외 단어(예: "보고서", "요약")가 포함된 원치 않는 신호를 건너뜁니다. 유연한 SL 및 TP 형식을 지원합니다: 가격, 핍 또는 포인트. 신호가 가격 대신 지점을 지정
ManHedger MT4
Peter Mueller
5 (1)
THIS EA IS A SEMI-AUTO EA, IT NEEDS USER INPUT. Manual & Test Version Please TEST this product before   BUYING  and watch my video about it. Contact me for user support or bug reports, or if you want the MT5 version! MT5 Version I do not guarantee any profits or financial success using this EA. With this Expert Advisor, you can: Implement your own   Zone Recovery   strategy to capitalize on trending markets. Create   Grid   trading strategies, to profit from ranging markets. Place orders easil
Riskless Pyramid
Snapdragon Systems Ltd
5 (1)
Introduction This powerful MT4 trade mangement EA offers a way potentially to aggressively multiply trade profits in a riskfree manner. Once a trade has been entered with a defined stoploss and take profit target then the EA will add three pyramid add-on trades in order to increase the overall level of profit. The user sets the total combined profit target to be gained if everything works out. This can be specified either as a multiple of the original trade profit or as a total dollar amount. Fo
Seconds Chart — MetaTrader 4에서 초 단위 차트를 생성하는 독특한 도구입니다. Seconds Chart 를 사용하면 초 단위로 설정된 타임프레임으로 차트를 작성할 수 있어, 표준 분 또는 시간 단위 차트에서는 불가능한 유연성과 정밀한 분석이 가능합니다. 예를 들어, S15 타임프레임은 15초 동안의 캔들로 구성된 차트를 의미합니다. 모든 인디케이터, 전문가 자문(EA), 스크립트를 사용할 수 있으며, 표준 차트와 동일한 편리함으로 작업할 수 있습니다. 표준 도구와 달리, Seconds Chart 는 초고속 타임프레임에서도 높은 정확도와 지연 없이 작업할 수 있도록 지원합니다. Seconds Chart의 장점 1초부터 900초까지 의 타임프레임 지원. 즉시 로딩 MT5 터미널의 틱 데이터베이스 가져오기로 역사적 데이터를 빠르게 불러옵니다. MT5 터미널에서 Tick Database 유틸리티를 먼저 실행해야 틱 데이터베이스를 가져올 수 있습니다. 실시간 데이터 업데
Effortlessly calculate lot sizes and manage trades to save time and avoid costly errors The Trade Pad Pro EA is a tool for the Metatrader Platform that aims to help traders manage their trades more efficiently and effectively. It has a user-friendly visual interface that allows users to easily place and manage an unlimited number of trades, helping to avoid human errors and enhance their trading activity. One of the key features of the Trade Pad Pro EA is its focus on risk and position manageme
Trade Manager MT4 DaneTrades
Levi Dane Benjamin
4.09 (11)
거래 관리자는 위험을 자동으로 계산하는 동시에 거래를 빠르게 시작하고 종료하는 데 도움을 줍니다. 과잉 거래, 복수 거래 및 감정 거래를 방지하는 데 도움이 되는 기능이 포함되어 있습니다. 거래를 자동으로 관리할 수 있으며 계정 성과 지표를 그래프로 시각화할 수 있습니다. 이러한 기능은 이 패널을 모든 수동 거래자에게 이상적으로 만들고 MetaTrader 4 플랫폼을 향상시키는 데 도움이 됩니다. 다중 언어 지원. MT5 버전  |  사용자 가이드 + 데모 트레이드 매니저는 전략 테스터에서 작동하지 않습니다. 데모를 보려면 사용자 가이드로 이동하세요. 위기 관리 % 또는 $를 기준으로 위험 자동 조정 고정 로트 크기 또는 거래량과 핍을 기반으로 한 자동 로트 크기 계산을 사용하는 옵션 RR, Pips 또는 Price를 사용한 손익분기점 손실 설정 추적 중지 손실 설정 목표 달성 시 모든 거래를 자동으로 마감하는 최대 일일 손실률(%)입니다. 과도한 손실로부터 계정을 보호하고 과도한
EAs Manager MT4
Abdeljalil El Kedmiri
The  MT4  EAs Manager   is a professional risk management and trade assistance tool designed to monitor, control, and optimize all trading activities on your MT5 account. It acts as a   central command center   that oversees every trade - whether opened by other Expert Advisors or manually by you. How it's work with other EAs :   Blog post  MT5 version :  https://www.mql5.com/en/market/product/166211 Only 10 copies will be sold at the early-bird price. After 10 copies, the price jumps directly t
제작자의 제품 더 보기
Price Velocity
Oleg Pechenezhskiy
5 (2)
The indicator calculates the average price velocity over the specified time period. It is known that the trading time flows unevenly, in bursts. It either goes faster, or slows down. This indicator will tell if the trading time has accelerated and it is necessary to go to the smaller timeframes to search for trade signals. Usage Alert is generated when the price velocity exceeds the specified threshold. The threshold value can be modified using the buttons on the information panel. A .wav file
FREE
This utility allows you to check and improve your binary options trading skills. This is an indicator, not an Expert Advisor. Therefore, you do not need to remove your active EA from the chart. Inputs Expiry, min - option expiration time; InfoPanel background color - info panel background color; InfoPanel text color - info panel text color; InfoPanel text fontsize - info panel font size.
FREE
Индикатор выводит первые производные двух MACD. По умолчанию, желтая MACD является более быстрой, чем синяя MACD. В настройках можно задать подходящие вам параметры для каждой из MACD. Одновременное изменение знака производных может являться дополнительным сигналом разворота. Входные параметры Yellow MACD fast EMA period Yellow MACD slow EMA period Blue MACD fast EMA period Blue MACD slow EMA period
FREE
Affine Chart
Oleg Pechenezhskiy
The indicator plots an affine chart for the current instrument by subtracting the trend component from the price. When launched, creates a trend line in the main window. Position this line in the desired direction. The indicator plots an affine chart according to the specified trend. Input parameters Maximum number of pictured bars - the maximum number of displayed bars. Trend line name - name of the trend line. Trend line color - color of the trend line. Black candle color - color of a bullish
FREE
Pairs Trade
Oleg Pechenezhskiy
The Pairs Trade indicator is a utility for semi-automatic pair trading. It allows combining the charts of two arbitrary instruments, even if the schedules of their trading sessions are different. It displays a spread chart in the form of a histogram with an overlaying moving average. It calculates the swap that will be charged for the synthetic position (in the deposit currency). It is possible to set a level for automatic opening of a synthetic position on the spread chart (analogous to the 'se
Aggregate Position
Oleg Pechenezhskiy
This indicator calculates the aggregate position of all long positions and the aggregate position of all short positions on the current symbol. The aggregate position is displayed on the chart as a horizontal line. When the line is hovered, a tooltip with the volume of the aggregate position appears. If the total number of positions in the terminal changes, the aggregate position is recalculated. Input parameters BuyLine color - line color of the aggregate long position; BuyLine width - line wi
Trading Lines
Oleg Pechenezhskiy
This utility is an Expert Advisor for semi-automatic trading within a price channel. It enters the market when the price crosses the channel boundary. Trend lines with a special type of description should mark the boundaries of the price channel. Trader is responsible for creating and aligning such trade lines on the required chart. The lines should be placed according to the same rules the "buy limit" and "sell limit" pending orders are placed. A trend line with a description of type "buy x" (w
С этим драйвером вы можете превратить трендовую линию в линию Ганна, поместив значение угла в виде NxM в ее описании, например 4x1, где N - это количество поинтов, а M - количество таймфреймов на текущем графике. Драйвер автоматически отображает значение угла в виде метки у правого конца линии. По умолчанию, размер поинта равен размеру пипса, но в настройках вы можете сами указать подходящий вам размер поинта. Вы можете комбинировать этот индикатор с индикатором  Colored Channels , разделяя проб
Profit Meter
Oleg Pechenezhskiy
5 (1)
Эта утилита поможет вам рассчитать прибыль в валюте депозита, если цена пройдет от своего текущего значения к значению, указанному горизонтальной линией ProfitMeter. При запуске индикатора эта линия автоматически создается на уровне текущего значения цены. Линию следует выбрать и переместить на нужный вам уровень. Расчетное значение прибыли при входе в рынок минимально возможным лотом отображается в правом нижнем углу окна графика. Входные параметры Style of ProfitMeter Color of ProfitMeter Widt
Quantized Trend
Oleg Pechenezhskiy
This utility automatically draws the trend channel on the price chart. For the time interval from the specified date to the current bar, the drawn channel is almost optimal. Placing the beginning of the channel at a more distant historical price extremum, you get a visualization of a longer-term trend. Channel slope is not a continuous value, but takes one of discrete values (in AxB format, where A is the number of price points (points), and B is the number of timeframes). This program works ONL
필터:
리뷰 없음
리뷰 답변