Trend Waves
- 지표
- 버전: 1.0
- 활성화: 20

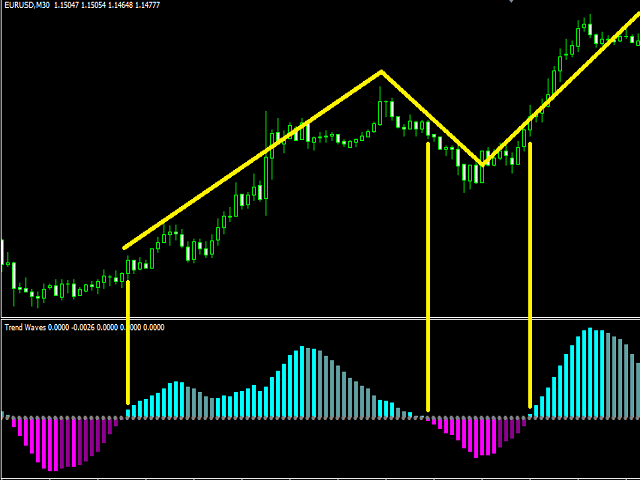
Trend Waves indicator is a trend indicator that uses Average True Range and Standard Deviation indications. It is aimed to find more healthy trends with this indicator. This indicator can be used alone as a trend indicator.
Detailed review
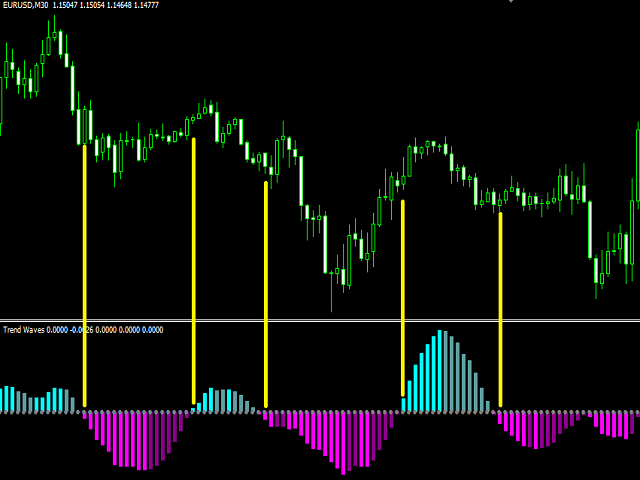
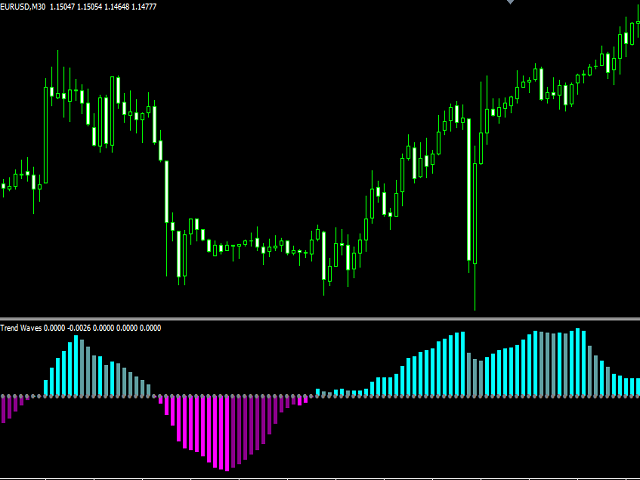
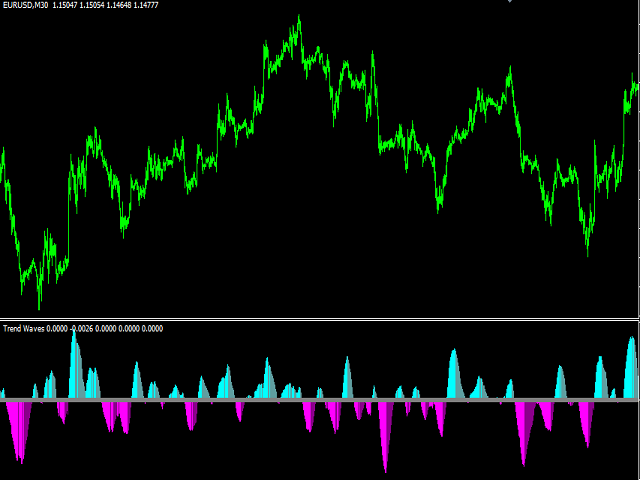
- 4 different trend colors appear on this indicator.
- The aqua color represents the rising trend.
- Dark aqua color means the train is getting weaker.
- pink color represents the downtrend trend.
- The dark pink color means the trend is weaker.
Parameters
- Stdeviation - Standard deviation period setting
- Stdev shift - Standard deviation shift setting
- Atr - Average True Range period setting
- AtrFactor - Average True Range calculation setting