MTF Support Resistance MT4
- 지표
- 버전: 1.20
- 업데이트됨: 3 7월 2020
- 활성화: 10

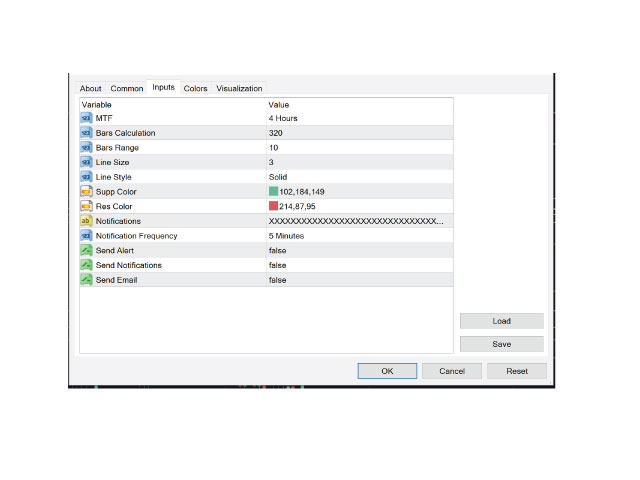
MultiTimeframe (MTF) Support and Resistance Indicator is use to measure last 320 bar (user input) of support and resistance of the dedicated timeframe.
User can attached this indicator to any desire timeframe.
Features:
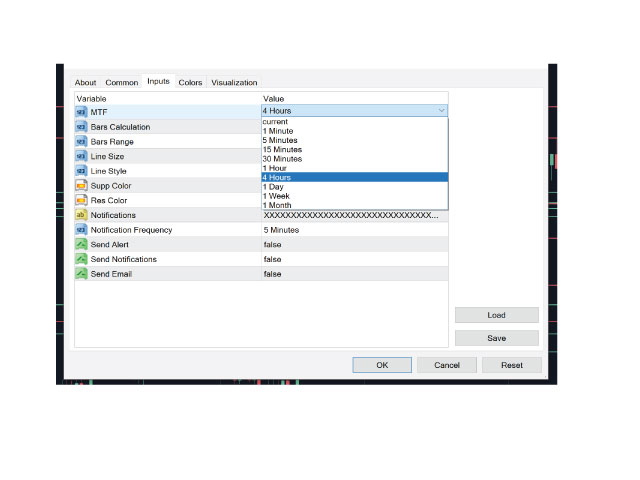
- User input desire timeframe (default Period H4)
- User input numbers of last bars (default 320 bars)
- User input measurement of last HH and LL (default 10 bars)
- Line styling and colors.
MT5 version: https://www.mql5.com/en/market/product/31983

Great tool. It’s worth every penny and more.