Advanced Moving Average Crossover Scanner FREE
- 지표
- FXsolutions
- 버전: 1.2
- 업데이트됨: 29 5월 2018
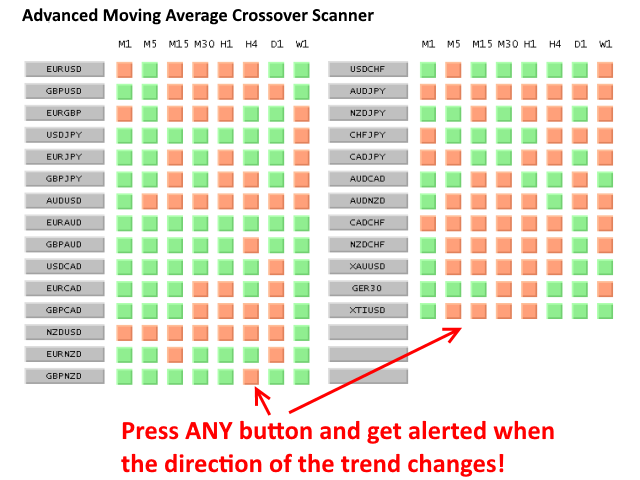
This scanner shows the trend values based on crossovers of two moving averages for up to 30 instruments and 8 time frames. You can get alerts via MT4, Email and Push-Notification as soon as the direction of the trend changes.
This is the FREE version of the indicator: https://www.mql5.com/en/market/product/29159
Important Information
How you can maximize the potential of the scanner, please read here: www.mql5.com/en/blogs/post/718074
You have many possibilities to use the scanner. Here are two examples:
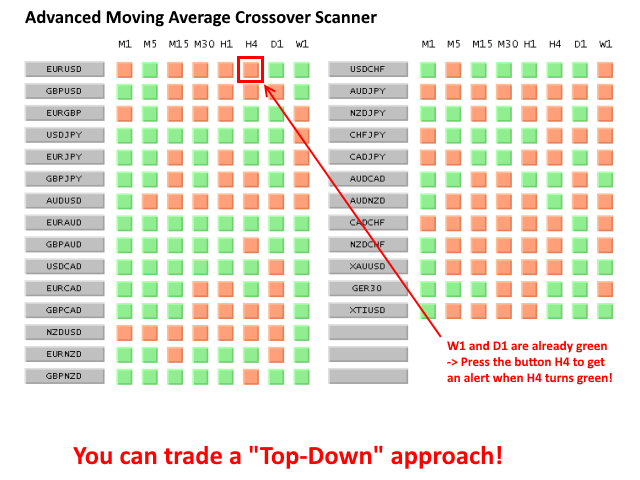
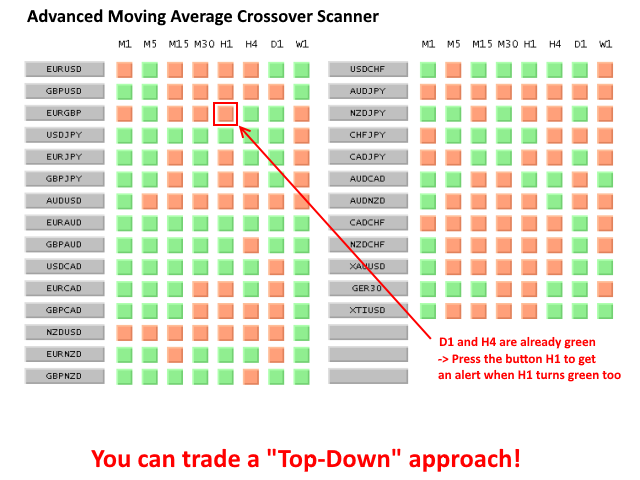
- With this scanner you can trade a top-down approach easily. If two higher time frames e.g. W1 and D1 are already showing green values (upward trend) but the H4 time frame shows a red value (downward trend) then you can press the H4 button to get alerted when the value of the H4 time frame changes to green value. These signals can be good trend continuation entries.
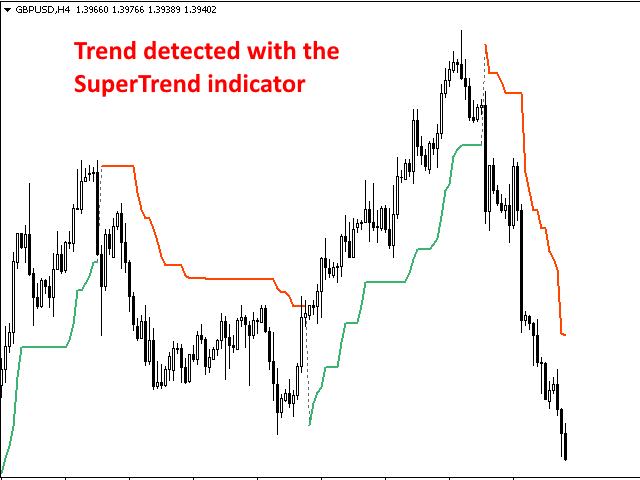
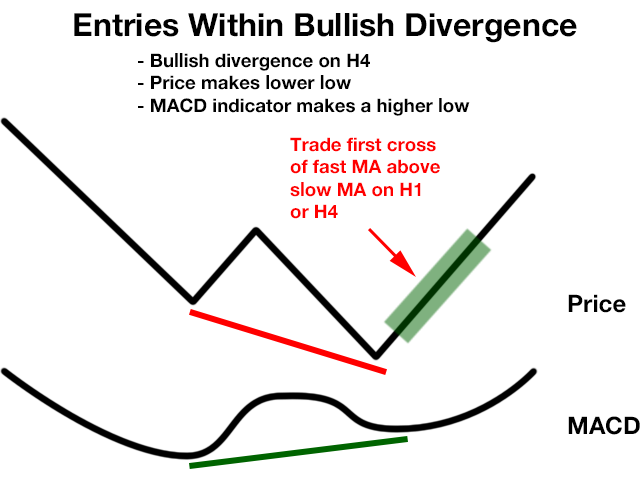
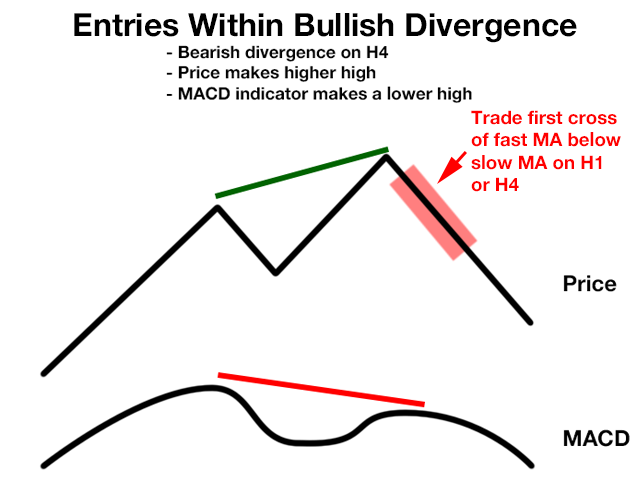
- You can also use this scanner for entry signals into MACD divergences. E.g. a bullish divergence exist on H4 but the SuperTrend values of the time frames H4 and H1 are still showing red values, then you can get alerts in the moment when the H4 or H1 value changes to green. These signals can be good entries in direction of the divergence.
Parameters
- slowMA_Period: the period setting for the slow moving average
- slowMA_Shift: the shift value of the slow moving average
- slowMA_Method: the calculation method for the slow moving average
- slowMA_Price: the price value which is used to calculate the slow moving average
- fastMA_Period: the period setting for the fast moving average
- fastMA_Shift: the shift value of the fast moving average
- fastMA_Method: the calculation method for the fast moving average
- fastMA_Price: the price value which is used to calculate the fast moving average
- alertsViaMT4: True = Yes, False = No - if true, then the indicator gives alerts via MetaTrader 4 popup
- alertsViaEmail: True = Yes, False = No - if true, then the indicator gives alerts via email
- alertsViaPush: True = Yes, False = No - if true, then the indicator gives alerts direct to your mobile phone
- templateName: - if you press a button on the chart (which contains the name of an instrument), then the appropriate chart will open and a template with the specified name will be attached
- checkEveryXSeconds - every X seconds, the indicator checks the next instrument/timeframe for the values of the moving averages
- i1-i2 - the pairs EURUSD and GBPUSD which will be monitored/checked
AMAZING SCANNER I WILL DEFINITELY BUY THIS INDICATOR AFTER I BUY MY NEW TRADING PC