Opposite Prices CD LBT
- 지표
- 버전: 1.32
- 업데이트됨: 24 7월 2024
- 활성화: 7

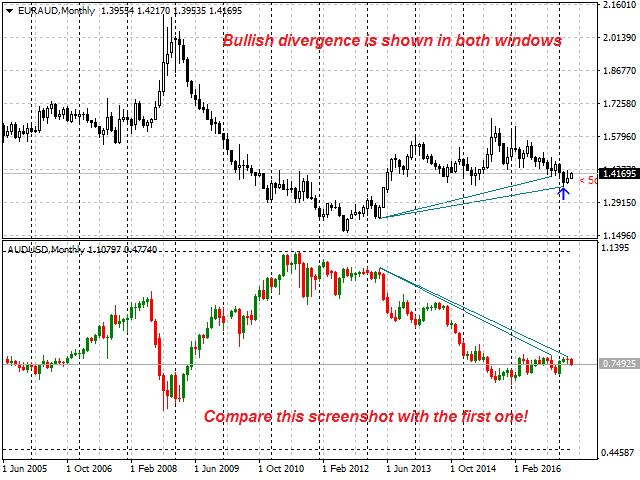
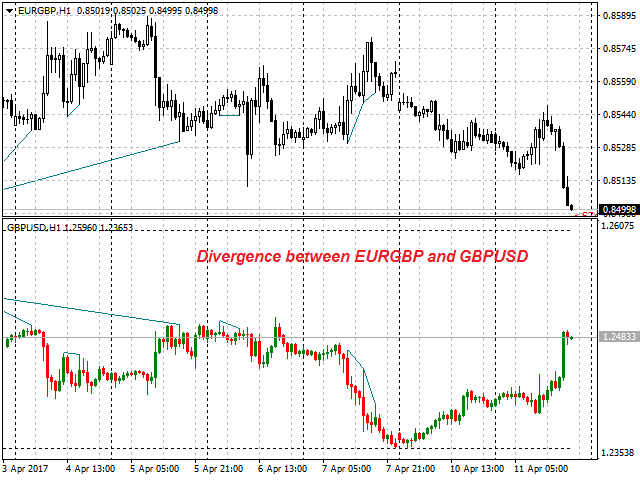
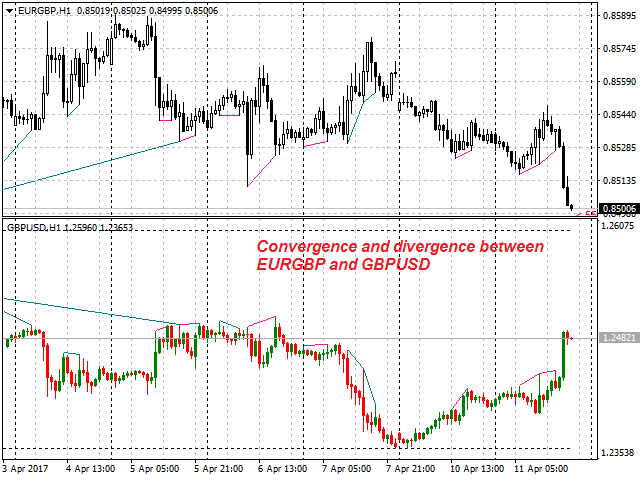
OP CD LBT (Opposite Prices Convergence/Divergence Low Bottom Top) is an indicator of convergence/divergence of the bullish sentiment among the mirrored financial instruments. The indicator is the first out of the two possible versions (LBT and LTB) of the bullish convergence/divergence origins.
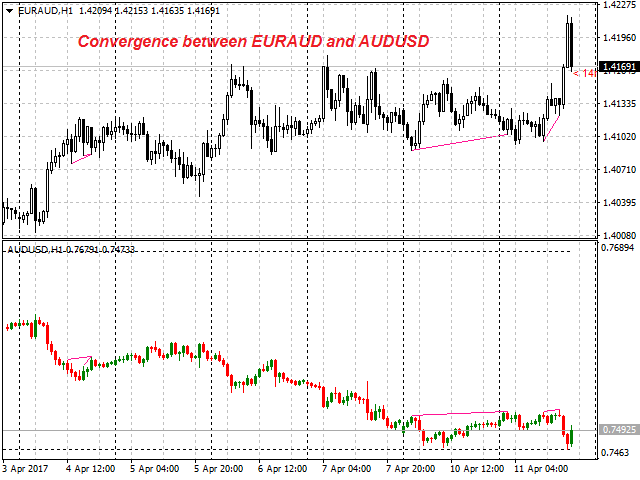
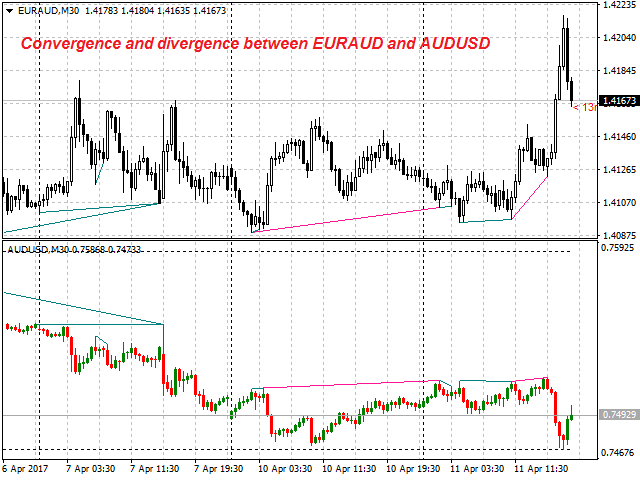
Multiple use of the indicator allows you to find convergences/divergences between the price of the main financial instrument and any other financial instruments simultaneously.
Users can select the sell graphical symbol and its width, as well as the color of convergence/divergence lines.
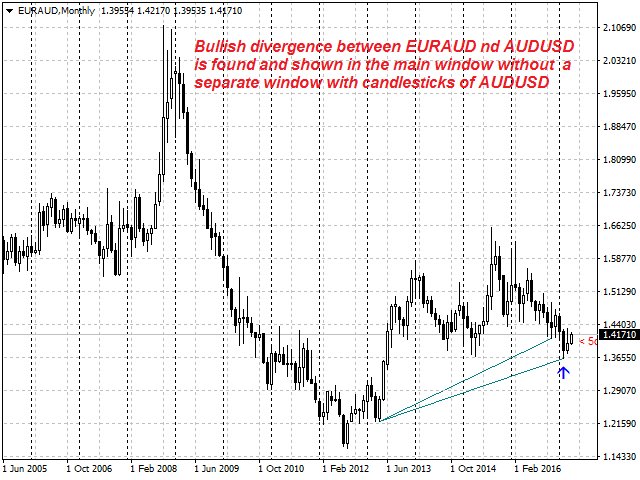
The indicator is not a lagging one. It works by ticks and is able to show convergence/divergence in the symbol's window even if there is no a separate window with a different financial instrument used for search. This allows you to open additional windows with any other indicators for a joint analysis.
As an option, the indicator can notify of a new signal using the graphical sell symbol instead of convergence/divergence lines.
In most cases, convergence/divergence is considered to be confirmed if it takes the form of a line with a graphical symbol remaining on the chart.
The search for a convergence/divergence on one financial instrument means finding the support/resistance levels!
Attention: Since the indicator is downloaded, graphical symbols are displayed in the main window only after a new convergence/divergence signal appears (unlike convergence/divergence lines). Graphical symbols are not displayed for the past periods (before the indicator was downloaded).
To plot the convergence/divergence lines in the additional window, the indicator identifies any of the eleven custom indicators (see the input parameters), if any.
The indicator can notify of the appearance of a formed signal by playing an audio signal or by sending an email.
Sample e-mail notification:
- Subject: Opposite Prices CD LBT Signal;
- Message: Signal,H1 - Bullish Divergence between EURAUD and AUDUSD - 2014.08.17 10:25:00.
Purpose
The indicator can be used for manual or automated trading within an Expert Advisor. For automated trading, use the indicator buffer of the double type:
- Sell signal - buffer 0, must not be zero.
Input parameters
- Currency_Name - name of the financial instrument;
- Bars_Number - number of bars for calculation;
- Base_Indicator - code of the base indicator (this parameter is activated only if a custom indicator is present):
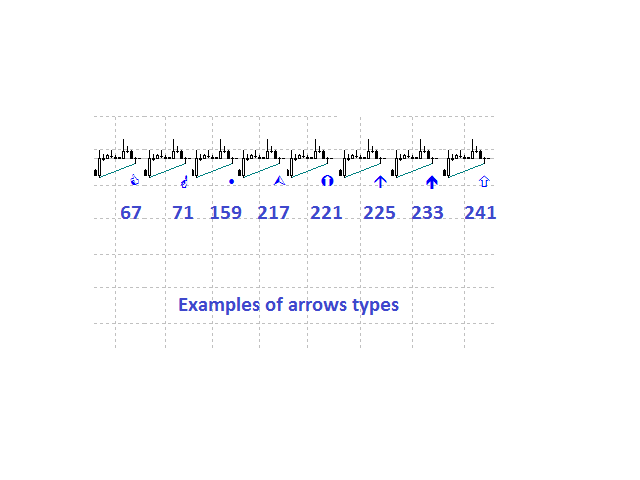
- Arrow_Symbol - graphical sell symbol type (recognizes one of the eight symbols, see the screenshot);
- Arrow_Width - graphical symbol width (allowable values - 1, 2, 3, 4, 5);
- Sound_Mail_Numbers - number of audio and e-mail notifications on the last two bars;
- DrawLine - display of convergence/divergence line.
- true - draw the lines (default);
- false - do not draw the lines.
- Convergence - calculating convergence or divergence:
- true - convergence (default);
- false - divergence.
- Ideal_Searching - searching convergence/divergence in non-ideal conditions:
- true - ideal search conditions (default);
- false - non-ideal search conditions.
- Play_Sound - enable sound notifications;
- Show_Time - display time remaining until the formation of the current bar;
- Send_Mail - send an e-mail notification;
- ConvLevelColor_1 - color of the convergence line in the main window;
- ConvLevelColor_2 - color of the convergence line in the additional window;
- DivLevelColor_1 - color of the divergence line in the main window;
- DivLevelColor_2 - color of the divergence line in the additional window.
Recommendations
Before operation of the indicator updating of historical data on financial instruments is required!