Voles Indicator
- 지표
- 버전: 1.1
- 업데이트됨: 10 7월 2018
- 활성화: 5
Operation Principles
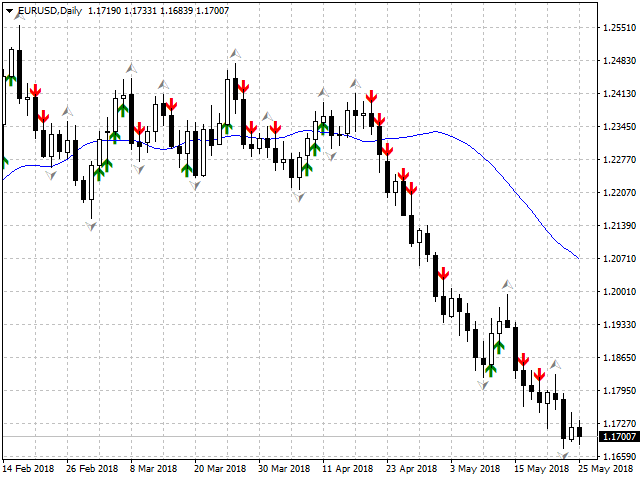
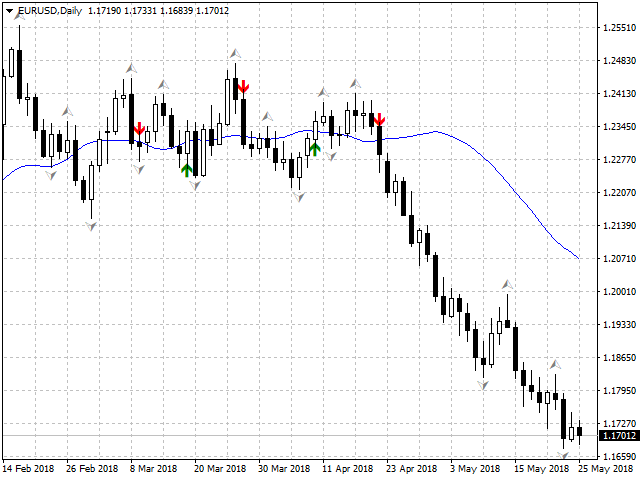
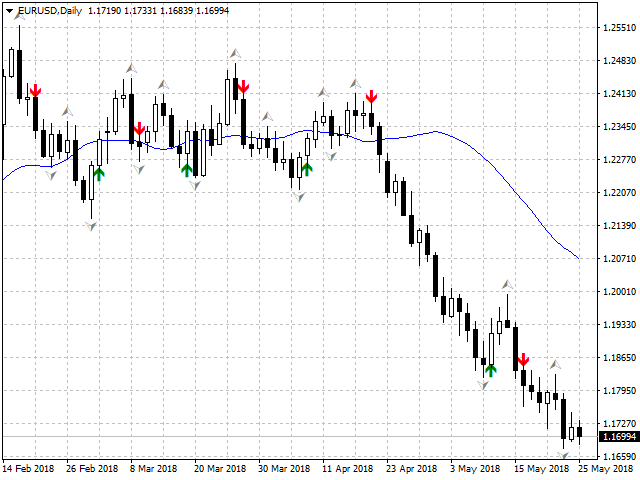
It is based on the standard indicators of the MetaTrader 4 terminal. It shows the market entry points.
How to trade
When a bar is complete and an arrow is shown, place a BuyStop order at the High of the bar is the arrow is green, or a SellStop order at the Low of the bar if the arrow is red.
StopLoss should be set at the level of the last downwards fractal below the entry point at a green arrow or at the level of the last upwards fractal above the entry point at a red arrow. To do this, attach the Fractals indicator to the chart.
If a fractal was not formed yet, do not place an order or set the SL level manually.
Input parameters
- Show intermediate arrows - show intermediate arrows (if false, only the first arrow is shown when the arrow color changes)
- Take into account the balance line - consider the balance line (line on the chart)
Pay Attention
Place orders only after a bar with an arrow is complete.
When the values of the input parameters are modified, the entry points are recalculated and their number changes.
It is preferable to place buy orders when the High of a signal bar is above the balance line, and sell orders when Low of the signal bar is below the balance line, even if the input parameter "Take into account the balance line" is set to false.
Recommended for use on H4, D1.