TriSync MT4
- Indicatori
- Versione: 0.40
- Attivazioni: 5

TriSync User Manual
Market Structure Indicator for MetaTrader 4 · Version 0.40
1. What It Is
TriSync shows market structure in layers on a single chart: four nested swing levels, VWAP anchored to swing highs and lows, Daily VWAP, higher-timeframe support and resistance, three-timeframe bias, and confirmed entry arrows on closed bars.
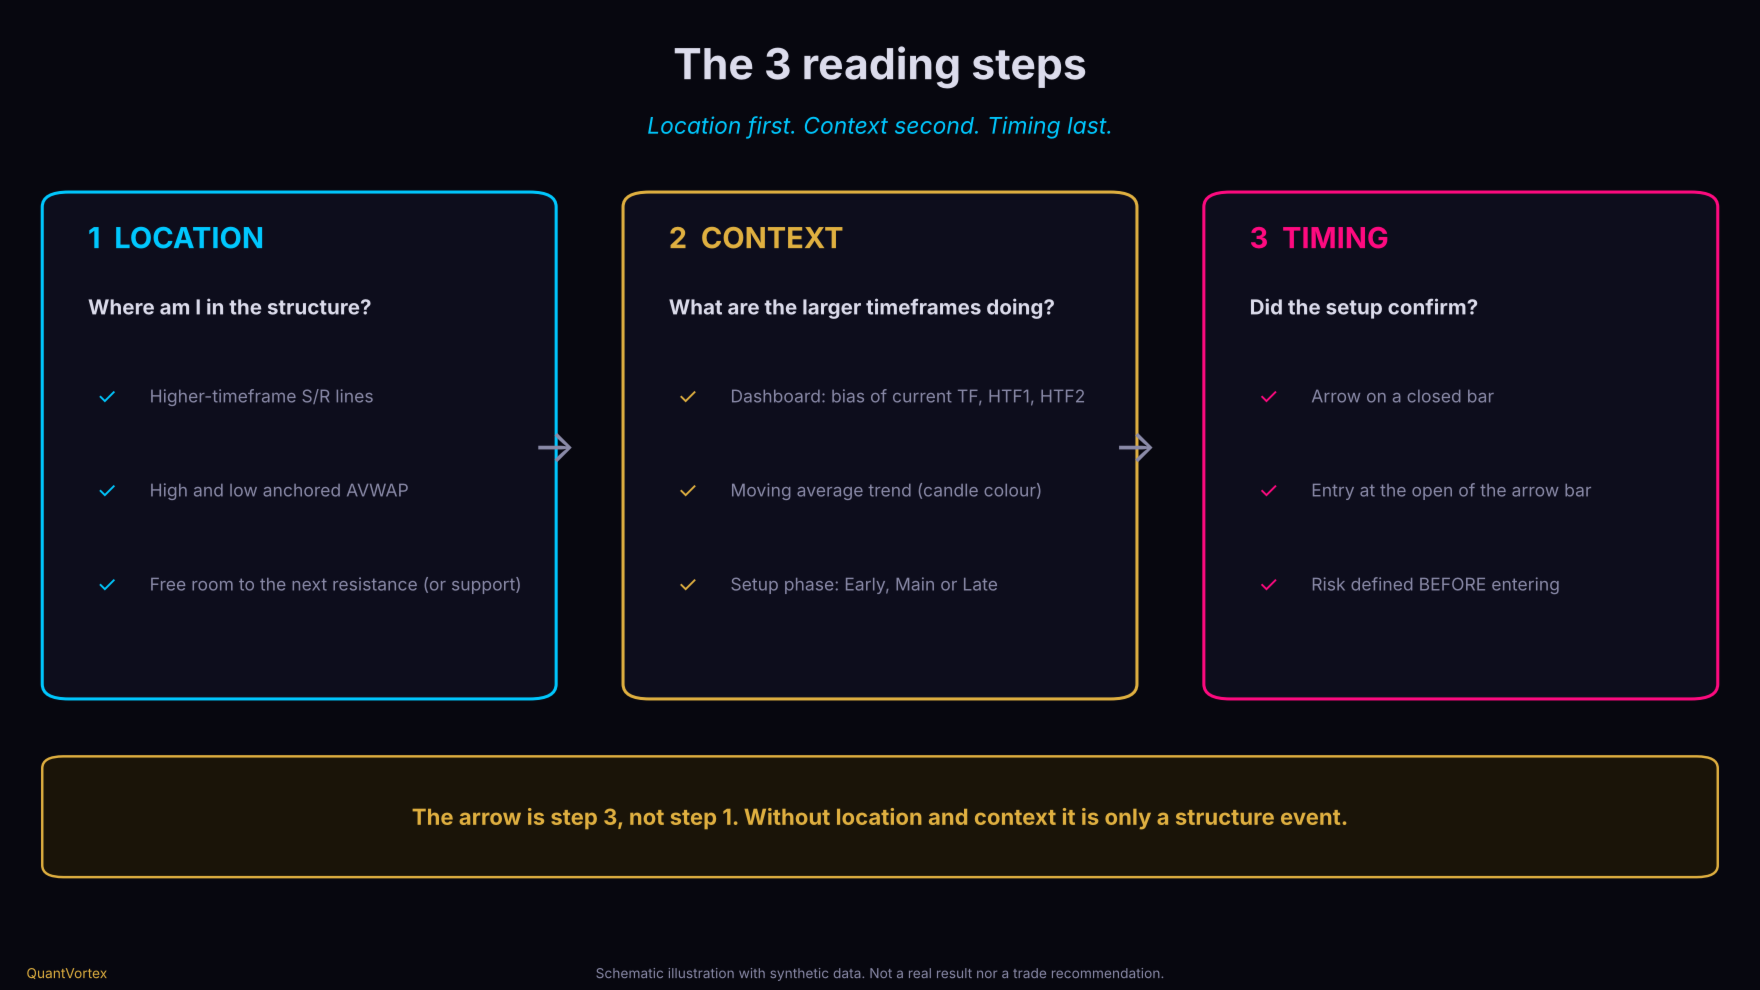
The core idea is a reading order: Location first. Context second. Timing last. The arrow is step 3, never step 1.
What it is not: it is not a robot, not a blind signal service, it does not send stop loss or take profit, and it does not promise results. It is a market-reading tool: it organizes the information, while the decision and risk remain entirely yours.2. The 3 Reading Steps (Figure 4)
-
Step 1 — Location. Where is price relative to structure? Look at higher-timeframe support and resistance lines, AVWAP, and the last swing high or low. A buy near support, with clear room to the next resistance, is very different from a buy stuck right against resistance.
-
Step 2 — Context. What are the higher timeframes doing? Read the dashboard: current TF bias, HTF1 and HTF2, the moving average trend color, and the setup phase (Early, Main, or Late).
-
Step 3 — Timing. Only after the first two steps, the arrow confirms that the setup has formed and a bar has closed in favor of the direction.
If steps 1 and 2 are not in favor, the arrow alone is not a reason to enter.
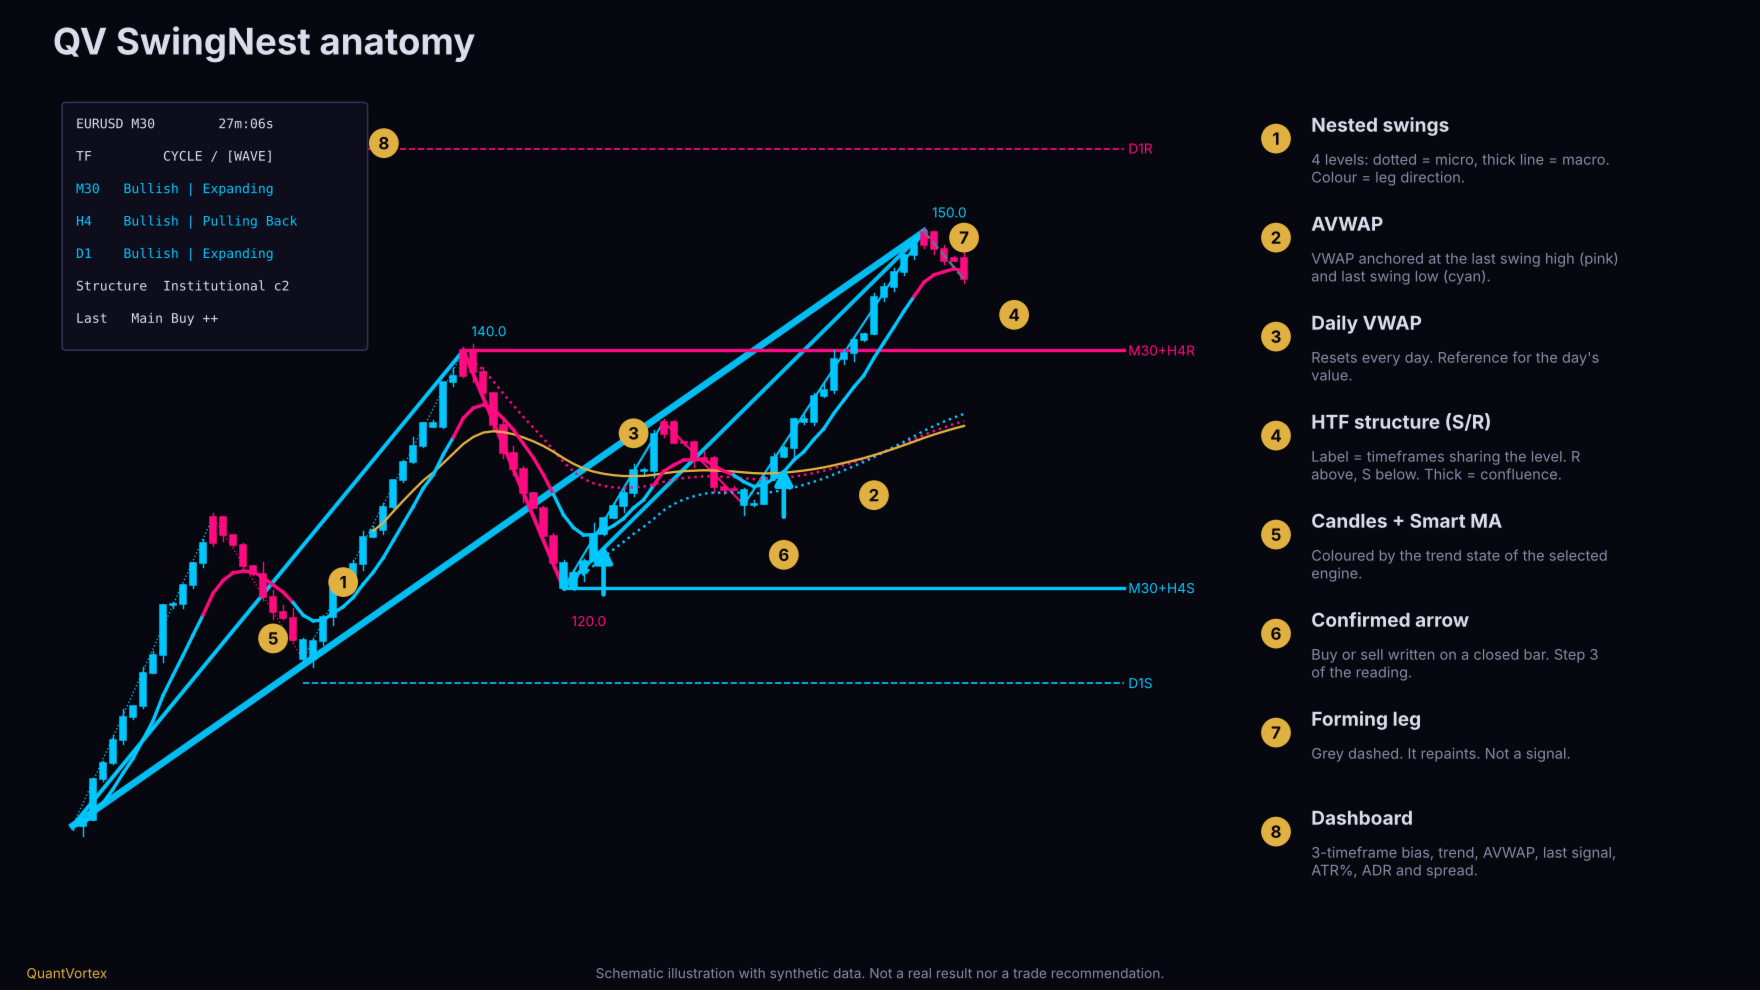
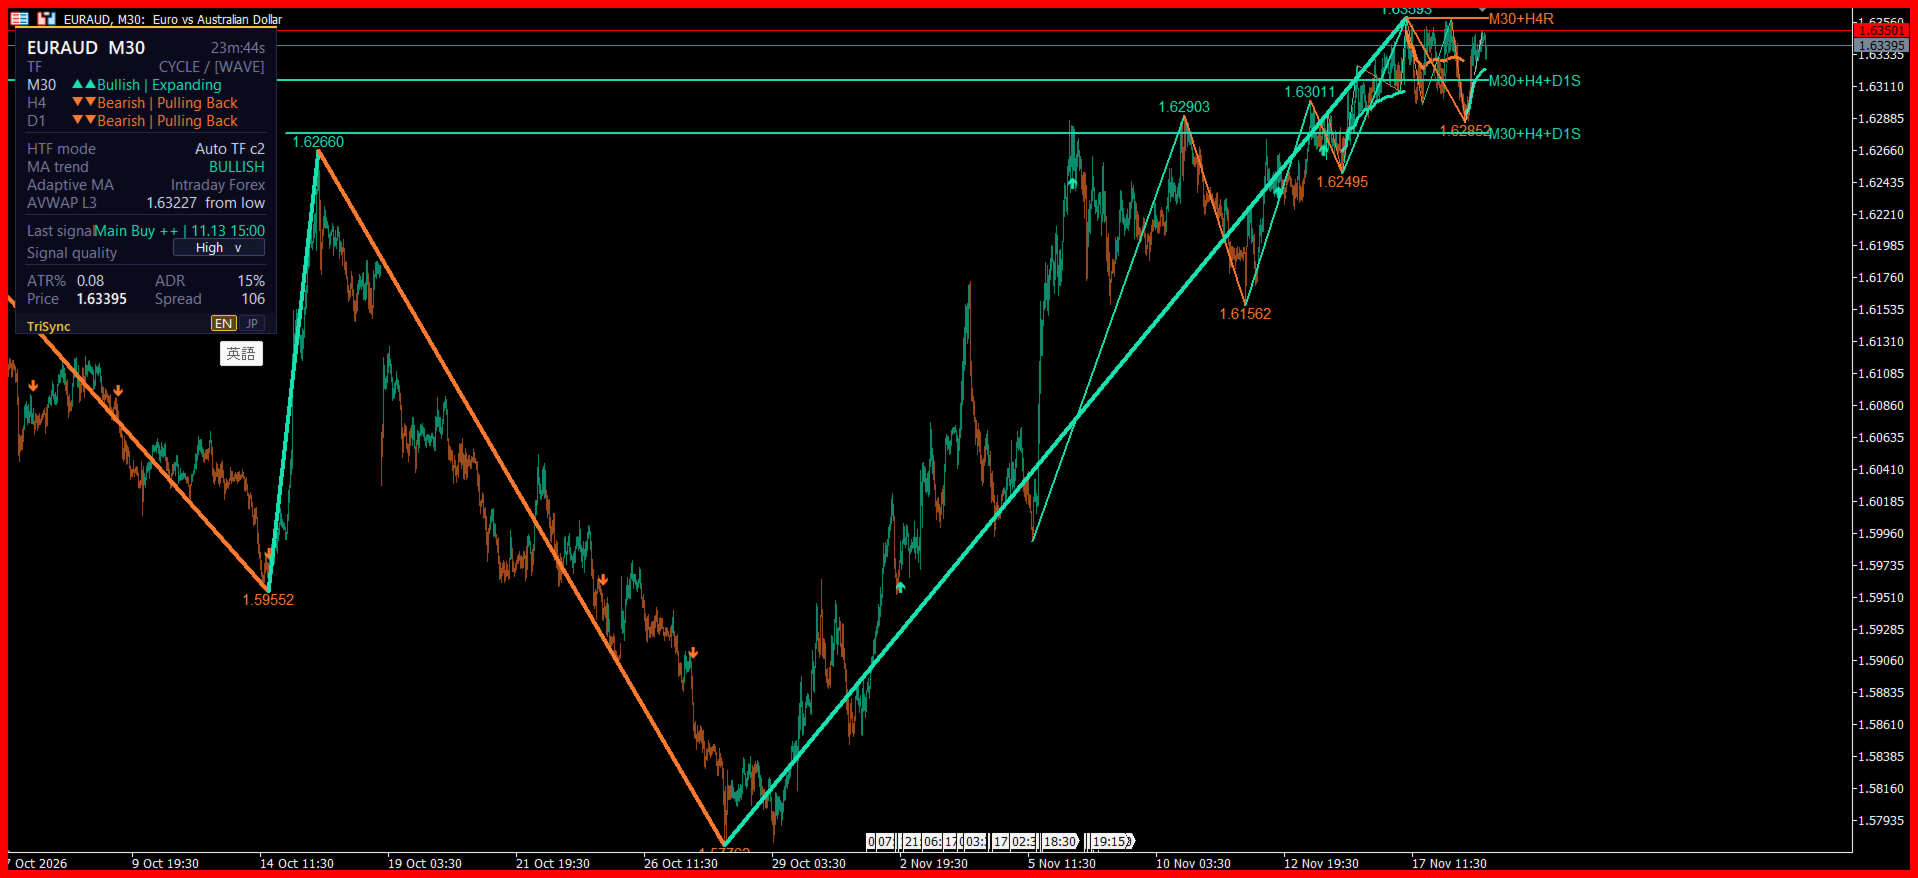
3. What You See on the Chart (Figure 1)
-
Nested Swings (4 levels): Level 1 is the minor structure (thin dotted line); levels 2, 3, and 4 move up to the macro (thicker lines). Levels 3 and 4 show the pivot price. Color indicates leg direction: cyan goes up, pink goes down (default theme).
-
Gray Dashed Leg: The forming leg, still unconfirmed. It moves with price and repaints. It is not a signal.
-
AVWAP (two dotted lines): One anchored to the last swing high (pink) and another to the last swing low (cyan), at the chosen level (default: level 3). Use as a value reference: where volume-weighted average price is since that pivot. Not a trigger.
-
Daily VWAP (gold line): VWAP that resets every day based on server time.
-
Higher-Timeframe Structure Lines: Horizontals labeled like M30+H4S : the timeframes sharing that level, followed by R (level above price, resistance) or S (level below price, support). Solid and thick lines mean confluence of 2 or more timeframes; dashed and thin means one. Nearby zones are automatically merged.
-
Colored Candles and Smart MA Line: Colored by the trend state of the chosen engine (cyan bullish, pink bearish, gray neutral).
-
Arrows: Up arrow below the candle: buy. Down arrow above the candle: sell.
4. Reading the Dashboard (Figure 5)
-
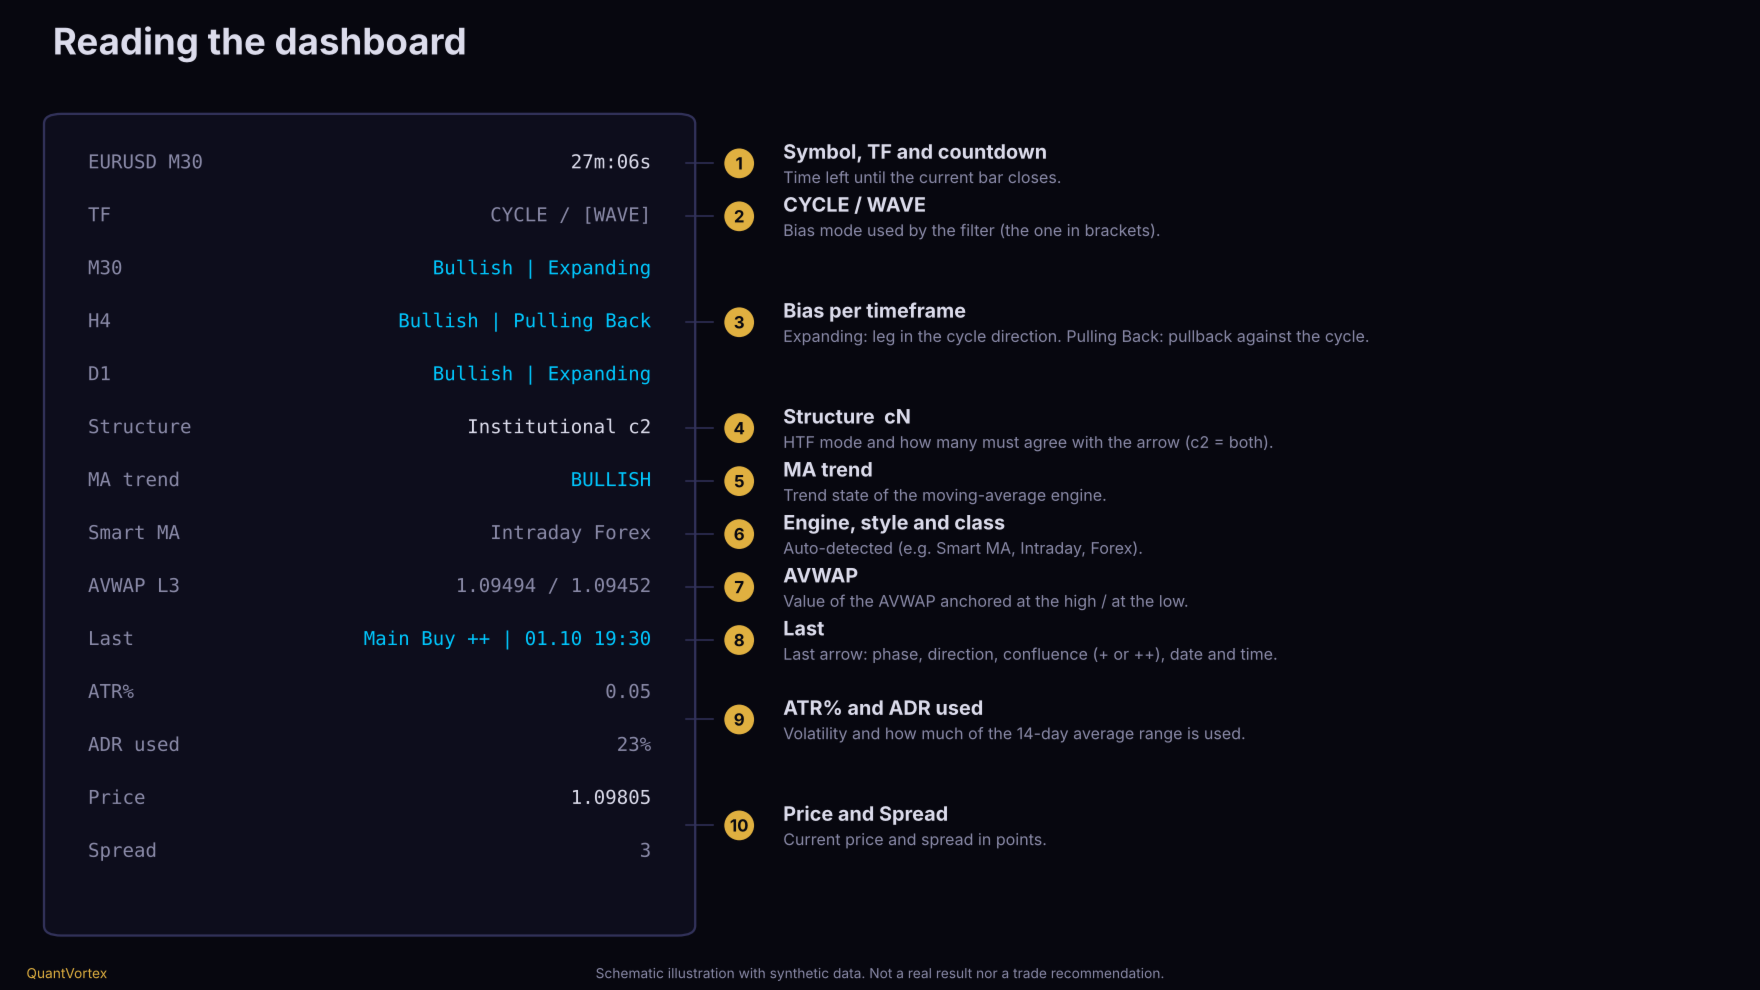
Symbol, timeframe, and countdown to the current bar close.
-
TF — CYCLE / WAVE: Shows which bias mode the filter uses (in brackets). Wave is reactive (last leg direction); Cycle is stricter (higher highs and higher lows, or lower lows and lower highs).
-
Current TF, HTF1, and HTF2 lines: Cycle bias and current leg state. Expanding: the current leg moves in the cycle direction. Pulling Back: the current leg is a correction against the cycle. Example: Bullish | Pulling Back is an uptrend in correction.
-
Structure: Higher-timeframe resolution mode and how many HTFs must agree with the arrow (e.g., c2 means both must agree).
-
MA trend: Trend state of the chosen moving average engine.
-
Engine line: Name of the engine, style, and detected asset class (e.g., Smart MA, Intraday, Forex).
-
AVWAP: Values of AVWAP anchored at the top and bottom.
-
Last: Last signal: phase, direction, confluence (+ or ++), and timestamp.
-
ATR%: ATR divided by price, in %. ADR used: How much of the 14-day average daily range today's range has consumed. Price and Spread.
5. How to Trade (Figure 2)
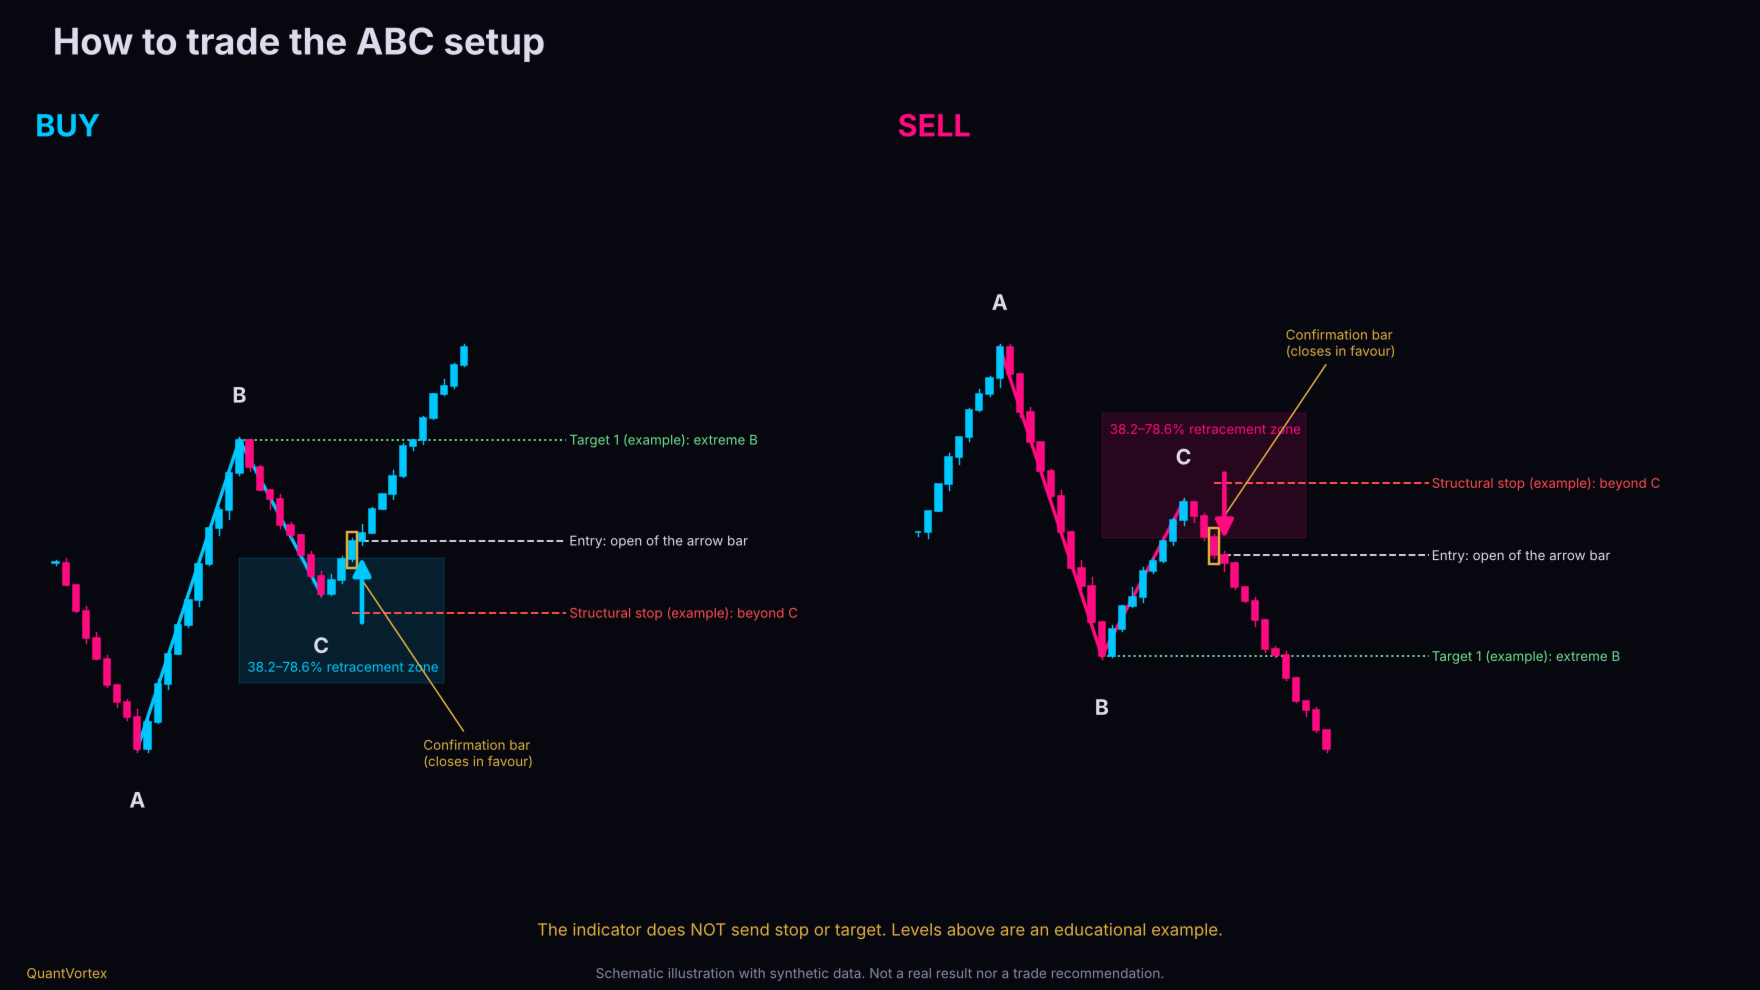
The setup is an ABC pullback pattern: A is a pivot, B is the next pivot (leg A→B), and C is the pullback. The setup is only valid if C retraced between 38.2% and 78.6% of leg A→B, C did not lose the level of A, and leg A→B has at least 2.5 ATR. The arrow only appears after price reverses from C enough to confirm the pivot, and is printed at the open of the next bar.
Buy Checklist
-
Location: Is price near support (label ending in S) or bottom AVWAP, with room to the next resistance (R)?
-
Context: Are HTF1 and HTF2 consistent with the buy? (with c2 , the arrow only appears when both agree). Is the MA trend cyan?
-
Phase: Early or Main are typical resumption scenarios. Late demands caution (see section 6).
-
Timing: Up arrow. Entry is at the open of the bar where the arrow was printed.
-
Risk: Define before entering. A reference example is a stop below the C low (structural stop) and the first target at the B high or nearest higher-timeframe resistance. The indicator does not send stops or targets: the example is educational, and position sizing by fixed risk is your decision.
Sell
Mirrored: down arrow, resistance above price as location, bearish HTFs, stop above the C high.
What to Expect from Entry
You enter after pivot C is confirmed, so you do not catch the exact bottom or top. This is a design choice: it avoids arrows in the middle of movement, but costs part of the leg. How much of the move has already been consumed is a question your own testing must answer (see section 11).
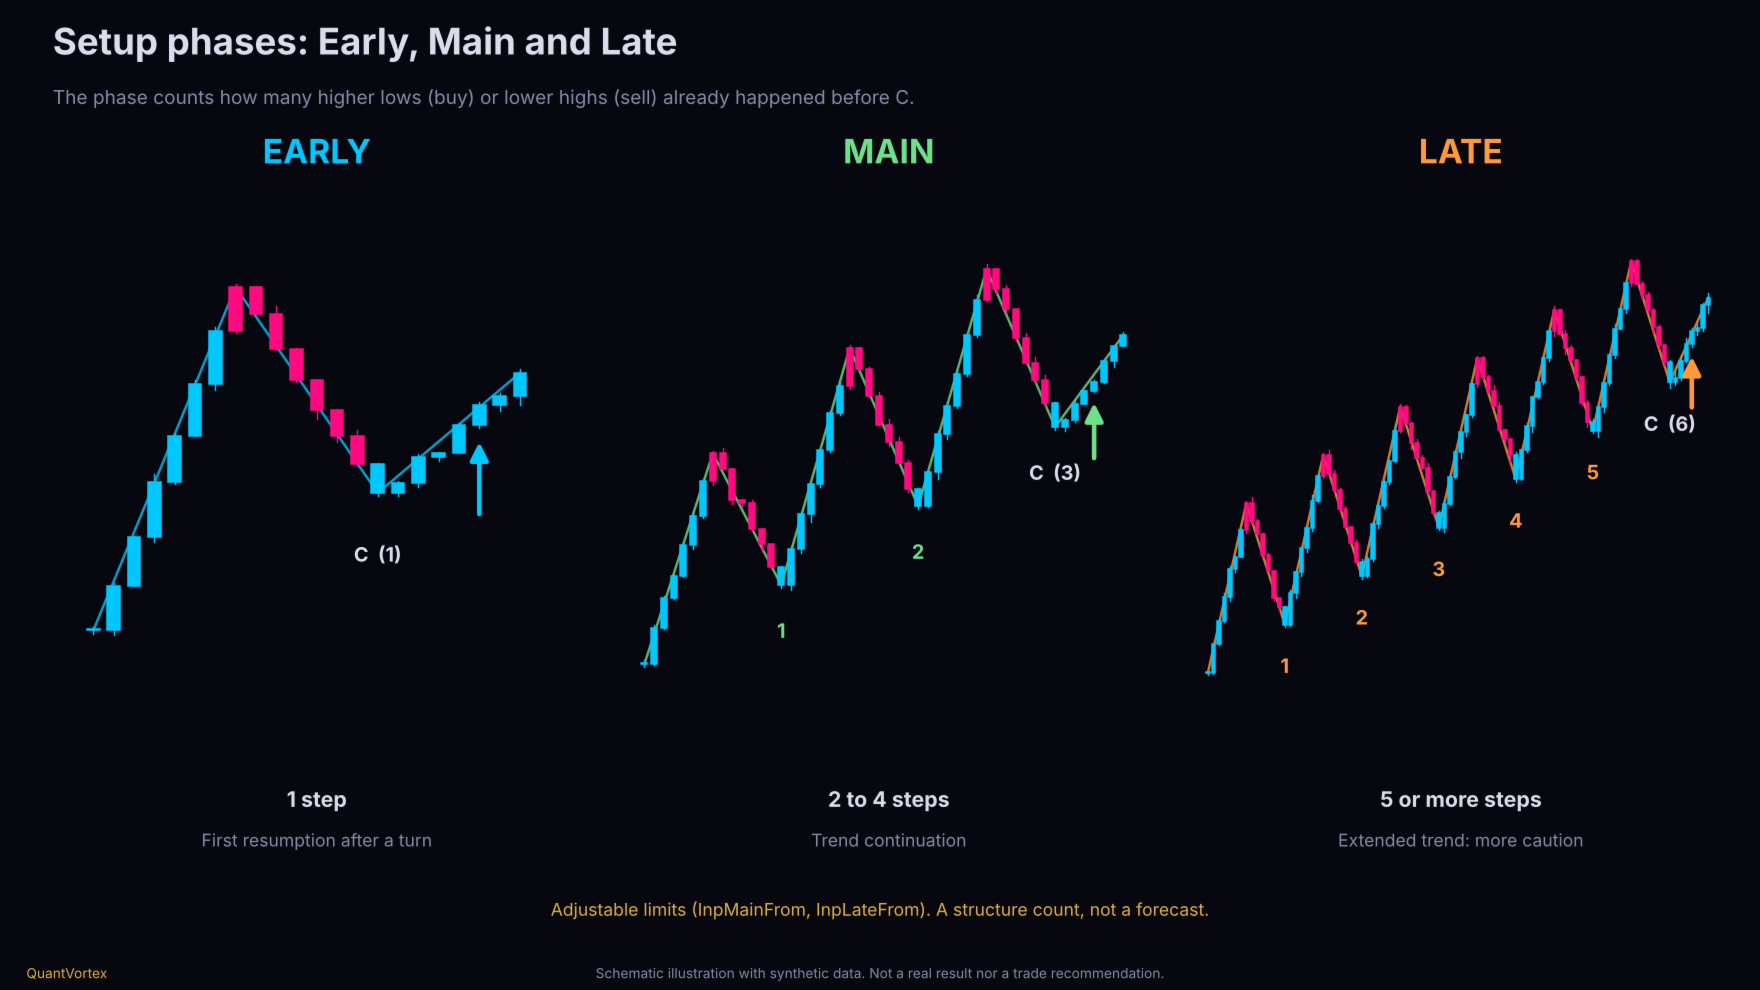
6. Early, Main, and Late Phases (Figure 3)
The phase counts how many consecutive trend-aligned highs or lows exist before pivot C (how many impulse steps have occurred):
-
Early: 1 step. First resumption after a turn.
-
Main: 2 to 4 steps. Trend continuation.
-
Late: 5 or more steps. Extended trend, higher exhaustion risk.
Limits are adjustable (InpMainFrom and InpLateFrom ), and each phase can be disabled. It is a structural count classification, not a prediction. Verify with your data whether it makes a difference on your asset.
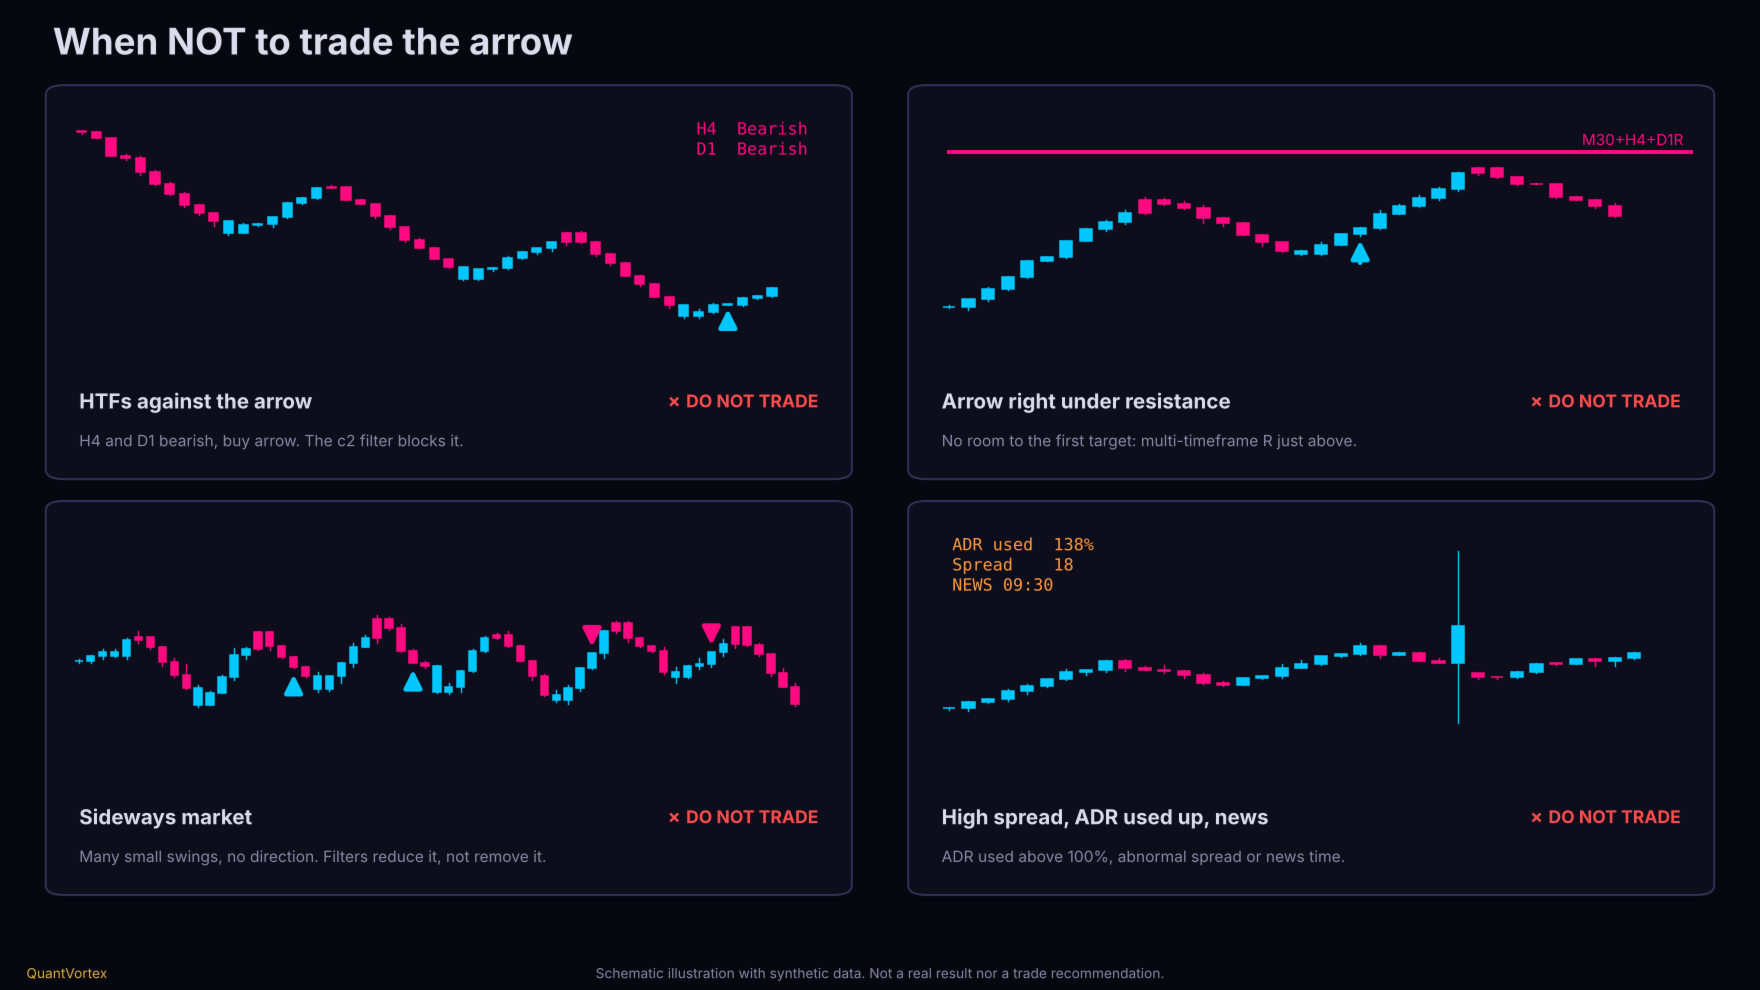
7. When Not to Trade (Figure 6)
-
Higher timeframes against the arrow: The default filter (c2 ) blocks these. If relaxed, know you are trading against context.
-
Arrow stuck right against resistance (or support for sells) from multiple timeframes: No room to the first target.
-
Ranging market: Many small, directionless swings. Minimum leg size and cooldown filters reduce noise, but don't eliminate it.
-
High spread, ADR consumed (>100%), or news times: Dashboard shows spread and ADR used.
-
Dashed leg: It repaints and is not a signal.
8. Configuration
Auto Configuration
-
Style by timeframe: Scalping (up to M5), Intraday (M15 to M30), Intraweek (H1 to H3), Swing (H4+). Also GANN (3-bar swing) and Manual.
-
Asset class by symbol: Forex, Metal, Index, Crypto, Energy, Stock. B3 contracts WIN and WDO are recognized by prefix.
-
Style and class adjust swing sensitivity (reversal in ATR multiples). These values are starting points, not calibrated values: test on your asset.
Higher Timeframes (Institutional Ladder)
| Chart TF | HTF1 | HTF2 |
| M1 | M5 | M15 |
| M5 | M15 | H1 |
| M15 | H1 | H4 |
| H1 | H4 | D1 |
| H4 | D1 | W1 |
| D1 | W1 | 4 weeks |
Higher candles are built from chart candles (synthetic engine) using server time blocks, maintaining identical results for identical history. Also available: Absolute TF (you choose both) and Fixed Ratio Cascade (x2, x3, x4, or x6).Main Parameters
| Parameter | Default | Purpose |
| InpStyle / InpClass | Auto | Style and asset class |
| InpEngine | Smart MA | Trend engine (Smart MA, EMA, or conservative) |
| InpBiasMode | Wave | Wave (reactive) or Cycle (stricter) |
| InpMinConf | 2 | Higher timeframes that must agree (0 to 2) |
| InpMinLegATR | 2.5 | Minimum leg size A→B in ATR |
| InpCooldown | 12 | Minimum bars between same-direction arrows |
| InpQuality | Standard | Strict requires strong confirming bar and close beyond previous bar |
| InpAvwapLvl | 3 | Swing level anchoring AVWAP |
| InpMaxBars | 3000 | Bars analyzed (fewer bars = lighter) |
| InpID | A | Use different IDs when running multiple instances on the same chart |
9. Alerts
Popup, sound, and push notifications can be toggled separately.