Pr0fit Engine

Profit Engine — Signal, Entry, Stop and Three Targets on One Chart

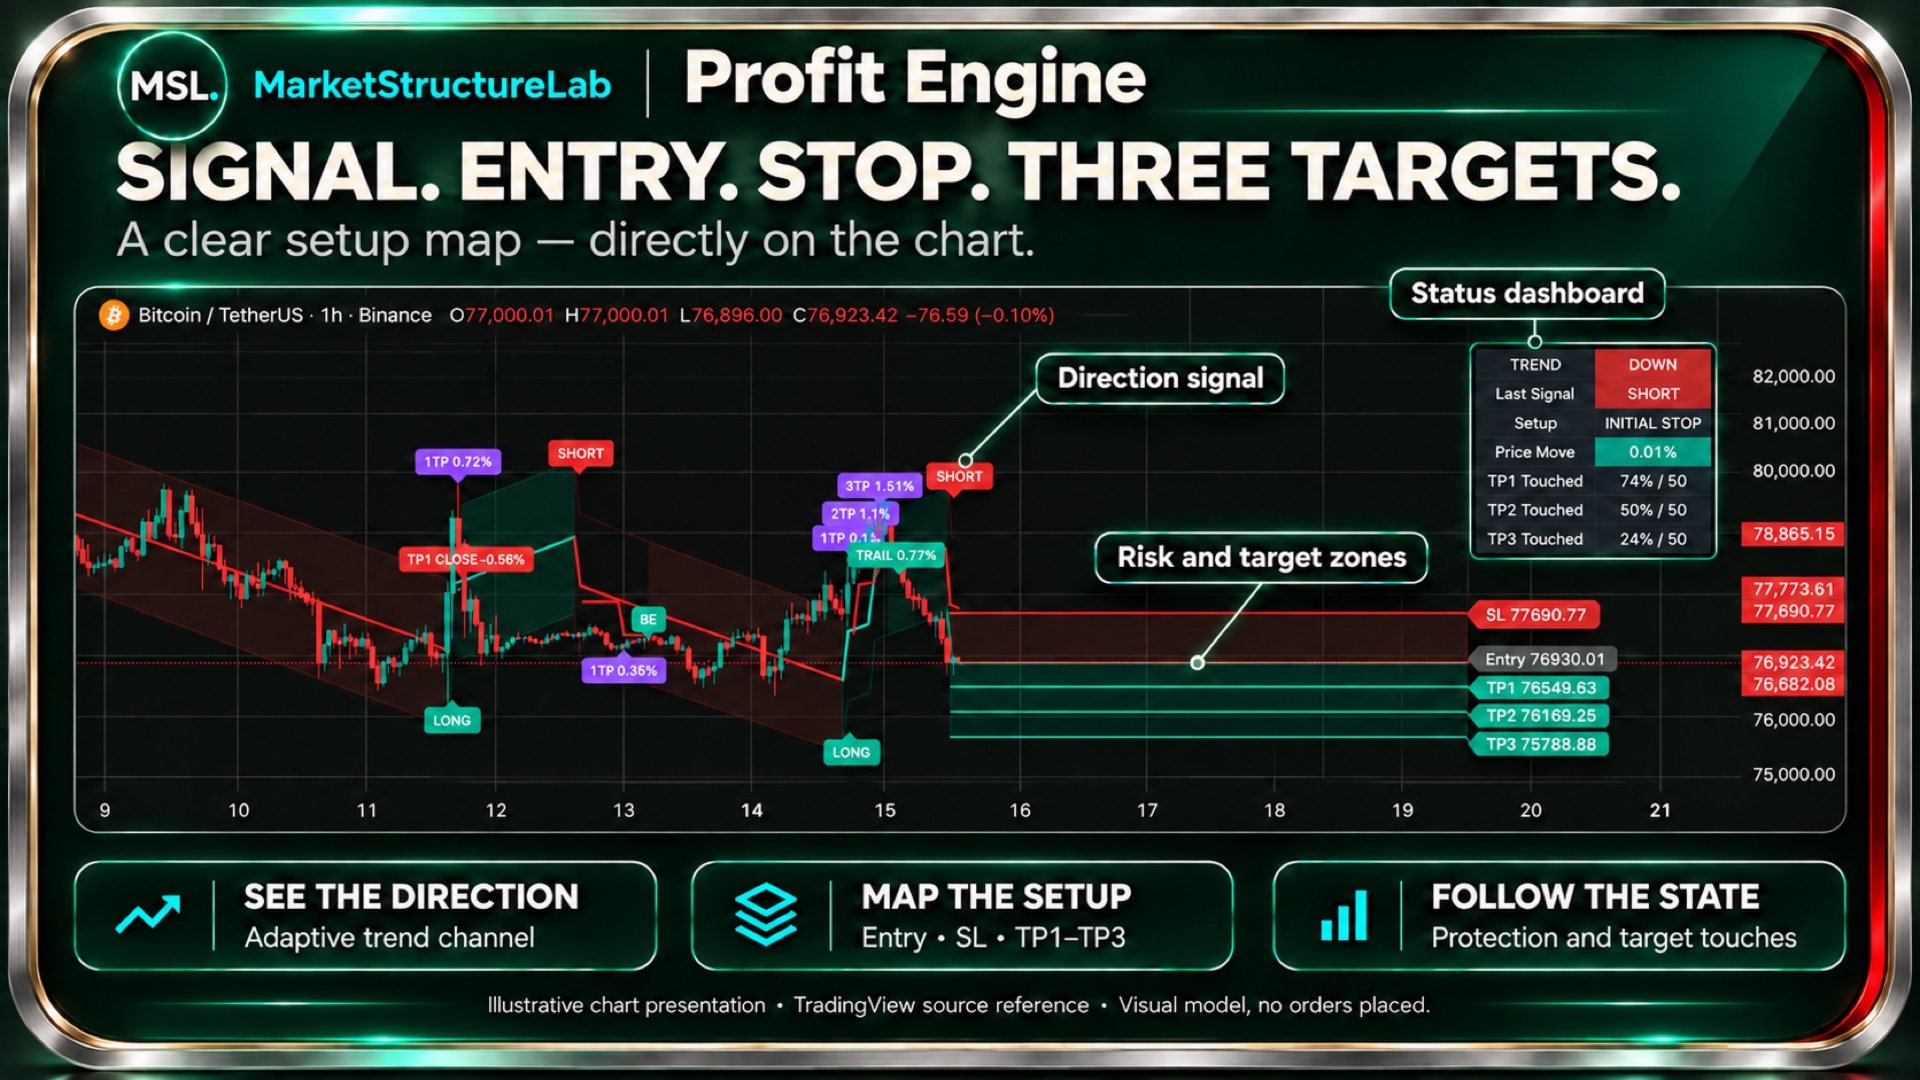
A signal appears. Where is the entry? Where should risk be limited? Which targets should you monitor? How does the protective level change as price moves?

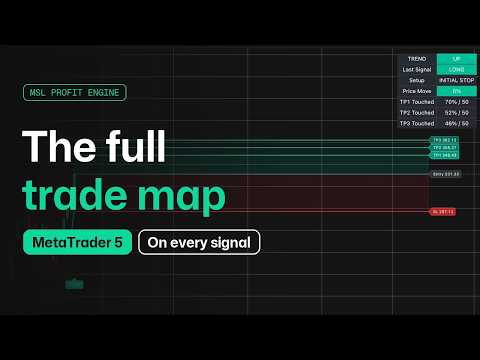
Profit Engine brings these reference points together in a clear visual trading plan. The indicator shows direction, plots Entry and Stop Loss levels, calculates three Take Profit targets, marks target touches and displays how the setup develops.

You do not need to draw every setup manually: the key levels and the latest setup status are already on your chart.

Everything You Need to Assess a Setup — in One View

Profit Engine combines several analytical tools:

  • Adaptive trend channel — helps you assess market direction.
  • LONG and SHORT signals — mark changes in direction according to the indicator’s rules.
  • Entry, SL and TP1–TP3 — show the structure of each new setup.
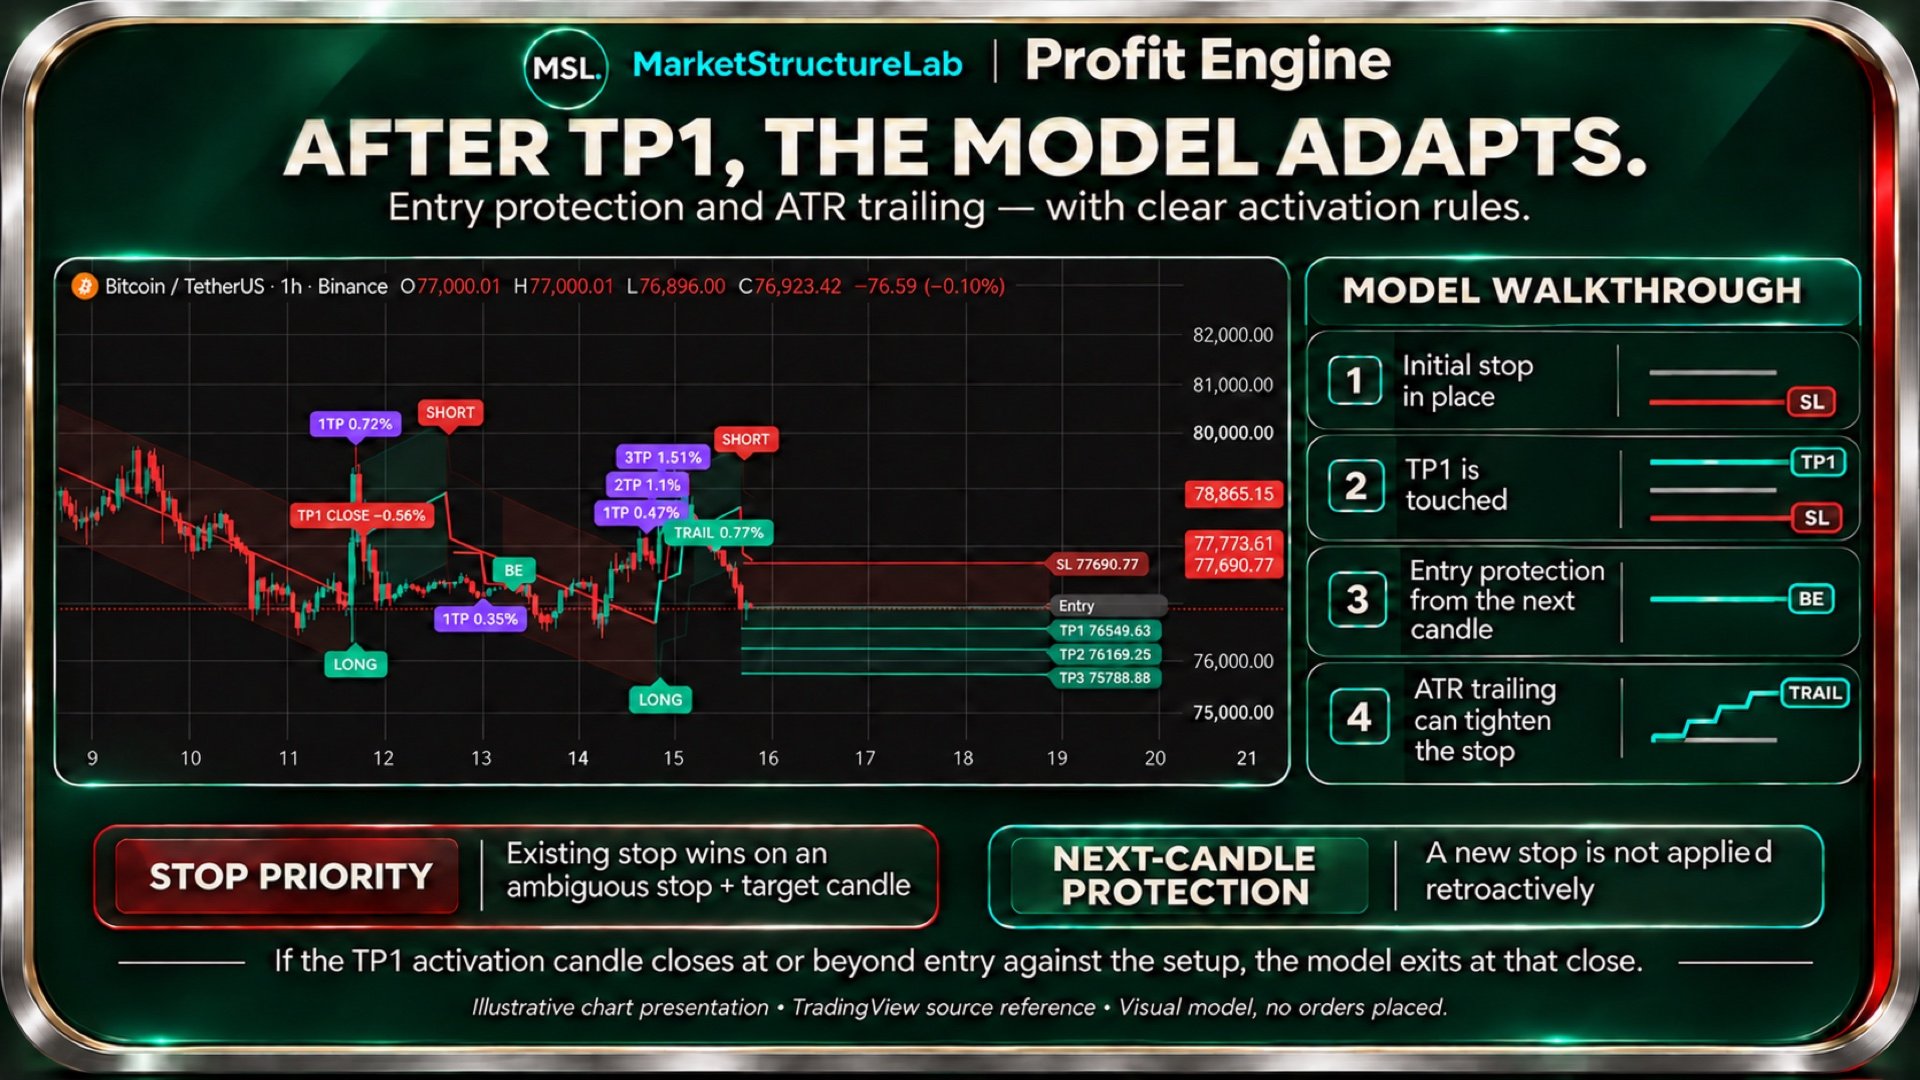
  • Entry protection and ATR trailing — track changes to the modeled stop after TP1.
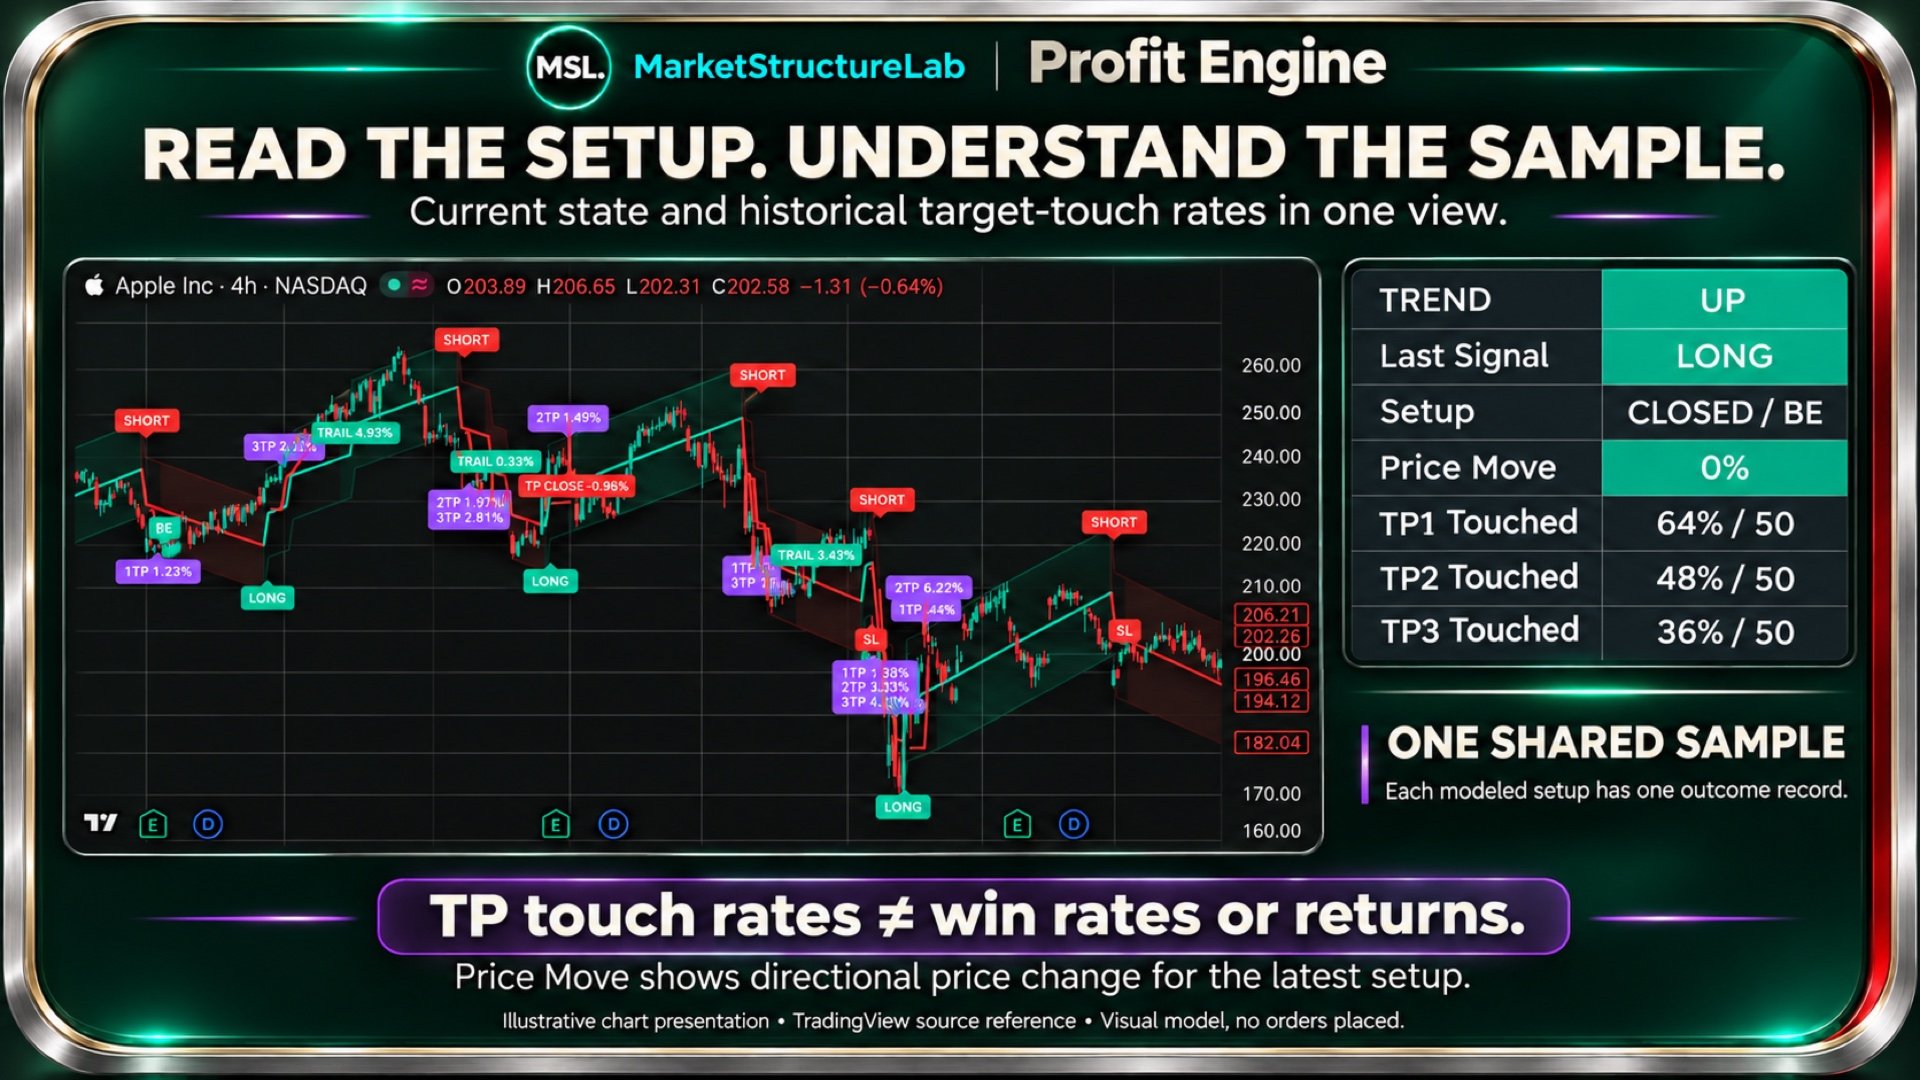
  • Dashboard — displays the current state and historical target-touch rates.

Consistent colors and labels connect these elements into one clear view: direction, distance to the protective level and target placement.

From a Signal to Specific Levels

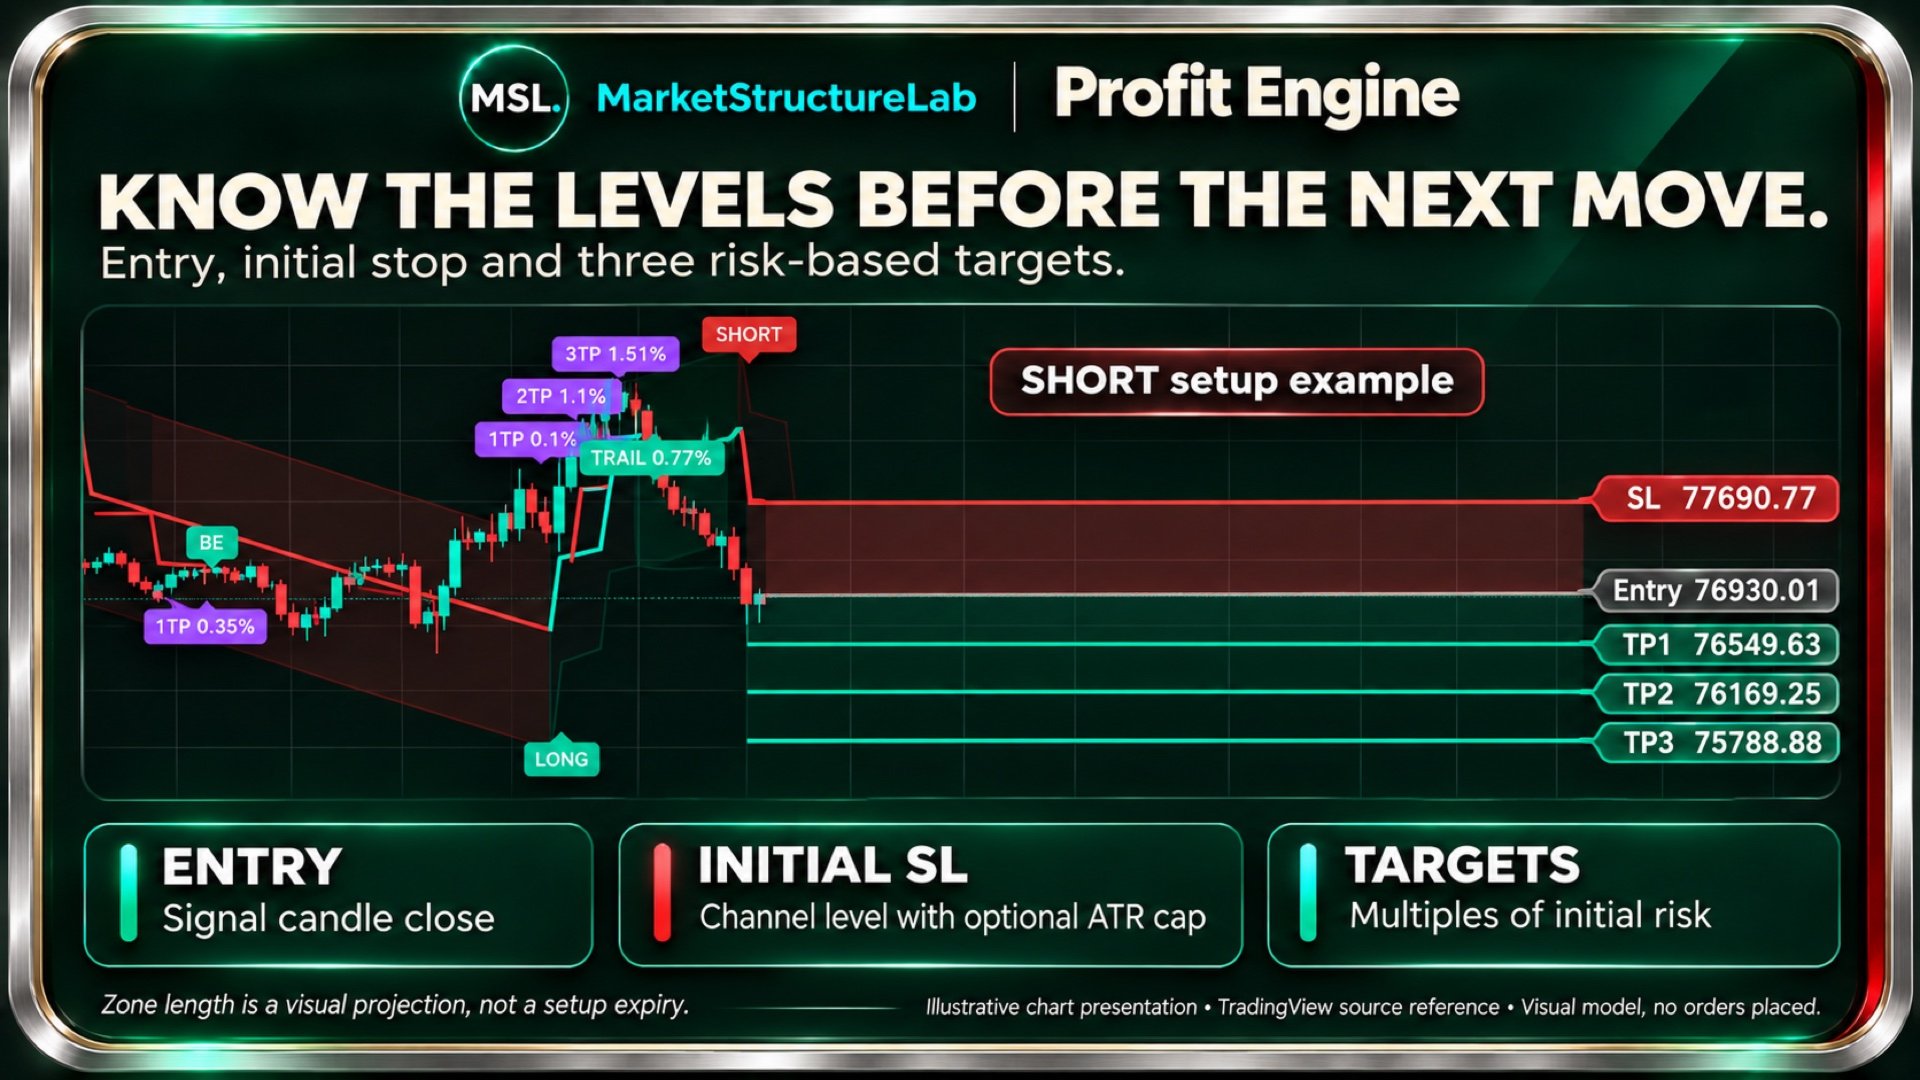
After a new signal, Profit Engine automatically builds a level map for the latest setup:

  • Entry — the modeled entry level based on the signal candle’s closing price.
  • Stop Loss — the initial protective level beyond the opposite channel boundary, with an additional buffer.
  • TP1, TP2 and TP3 — successive targets calculated from the distance between Entry and the initial stop.

The red zone highlights initial risk, while the target zones show potential movement in the signal’s direction. Price labels help you assess the levels without additional chart drawings.

Target distances are adjustable. The default settings are 0.5R, 1R and 1.5R, where R is the initial distance between entry and stop.

Follow the Setup Beyond the First Target

Reaching TP1 starts the next stage of the setup. When enabled, Profit Engine activates:

  • Entry protection — moves the modeled stop toward the Entry level.
  • ATR trailing — tightens the protective level as price moves favorably.
  • Stop history — shows how the active protective level changed over time.

Labels such as BE, TRAIL, SL and TP1 CLOSE help explain what happened to the setup. A newly calculated stop takes effect from the next candle.

You can follow the complete sequence: signal, target touches, protection changes and setup completion.

Statistics You Can Read at a Glance

The dashboard displays:

  • TREND — the channel’s direction.
  • Last Signal — the latest LONG or SHORT signal.
  • Setup — the latest setup’s status.
  • Price Move — price change measured in the direction of the latest setup.
  • TP1 Touched, TP2 Touched and TP3 Touched — the frequency with which each target was reached within a shared sample.

This helps you assess how often price reached different targets on the selected chart with your chosen settings.

TP Touched values are target-touch rates, not winning-trade percentages or account returns. The sample size is adjustable and defaults to 50 setups.

Customize the Chart to Your Workflow

Display the complete layout or keep only the elements you need: channel, signals, levels, zones, stop history and dashboard.

Colors, transparency and font sizes are adjustable, helping you maintain readability and focus on the information you use when making decisions.

Profit Engine Is Designed for Traders Who Want To:

  • Move quickly from a signal to assessing entry, stop and targets.
  • Reduce manual chart marking.
  • Follow the latest setup and changes to its protective level.
  • Review historical target touches on the selected instrument.
  • Use a consistent visual approach for both LONG and SHORT analysis.

Input Parameters

Channel and Signal Filters

  • Re-anchor Threshold (ATR) — price-deviation threshold for repositioning the channel center.
  • Center Drift Damping — controls the smoothing of the center’s movement.
  • Channel ATR Length — ATR period used to calculate the channel.
  • Band Width % — controls the width of the channel boundaries.
  • Confirm Flip With Close (Price Side Filter) — checks the price’s position relative to the center when direction changes.
  • Min Flip Distance (ATR) — minimum distance between price and the center required for a new signal.

Levels and Zones

  • Show Active Trade Zone — displays risk and target zones.
  • Show Entry / SL / TP Lines — displays entry, stop and target lines.
  • Trade Zone Length, Bars — projection length in candles; does not define the setup’s expiry.
  • TP1 / TP2 / TP3 Risk/Reward — target distances expressed as multiples of initial risk; values must increase from TP1 to TP3.
  • SL Buffer ATR — additional initial-stop buffer beyond the channel boundary.

Protection and Trailing

  • Limit Initial Stop Distance — limits the initial stop distance using ATR.
  • Protection ATR Length — ATR period used for protective calculations.
  • Initial Stop ATR Multiplier — ATR multiplier used to limit the initial stop distance.
  • Enable Trailing After TP1 — enables modeled trailing after TP1.
  • Trailing ATR Multiplier — trailing distance expressed in ATR units.
  • Protect Entry After TP1 — enables entry-level protection after TP1.
  • Show Historical Active Stop — displays the history of the active stop.

Appearance

  • Show Trend Bands / Show Trend Fill — displays channel boundaries and fill.
  • Show LONG / SHORT Labels — displays signal labels.
  • Show Stop Exit Labels — displays setup-exit labels.
  • Hide Trend Fill Inside Active Trade Zone — hides the channel fill inside the active zone.
  • LONG Color / SHORT Color / TP Label Color — colors for directions and target-touch labels.
  • Band Transparency / Fill Transparency — transparency of channel boundaries and fill.
  • Risk Zone Transparency — transparency of the initial-risk zone.
  • TP1 / TP2 / TP3 Zone Transparency — transparency of target zones.
  • Trade Zone Border Transparency — transparency of zone borders.
  • Label Font Size — font size for chart labels.
  • Keep Projected Level Labels In View — keeps projected price labels within the visible chart area.

Dashboard

  • Show Dashboard — displays the information panel.
  • TP Outcome Sample — statistical sample size, from 5 to 100 setups.
  • Dashboard Font Size — dashboard font size.
  • Dashboard Right Margin / Dashboard Top Margin — dashboard offsets from the right and top edges.

Alerts

  • LONG / SHORT Signal Alerts — notifications for new signals.
  • Signal Alerts On Closed Bars Only — signal notifications after the candle closes.
  • Stop Exit Alerts — notifications when a setup exits at its stop.
  • TP1 Close Exit Alerts — notifications for exits labeled TP1 CLOSE.
  • Trailing Activated Alerts — notifications when trailing activates.
  • Entry Protection Activated Alerts — notifications when entry protection activates.

Alerts are displayed in the MetaTrader 5 terminal.

How the Indicator Works

Profit Engine is an analytical indicator with a visual setup-management model. It calculates and displays levels but does not place trading orders.

The closed-bar signal alert setting controls notification timing; it does not freeze the indicator’s calculations.

Reaching TP3 does not automatically close a setup. A new signal replaces the previous setup.

Statistics are based on recorded modeled setups and do not include commissions, position size or partial closures. Readings depend on the settings, price data and available instrument history.
추천 제품
Aurum mid quant pro
N'da Lemissa Kouame
AURUM MID-QUANT PRO v5.60 Quantitative Excellence for Gold (XAU/USD) & Volatility Trading Gain a professional edge over institutional markets with AURUM MID-QUANT PRO , an advanced Price Action Pattern Detection and Breakout Engine designed exclusively for MetaTrader 5 . Built specifically to capture the unique volatility of Gold (XAU/USD) and other major financial instruments, this powerful indicator combines high-precision algorithmic pattern recognition with real-time dynamic accumulation z
WB Camarilla Pivot Point
Wilbert Sales Bagtas
WB Camarilla Pivot Point Indicator See the Levels. Read the Reaction. Prepare for the Move. Stop guessing where price might turn. Start watching where the market must prove itself. The WB Camarilla Pivot Point Indicator is a powerful chart-analysis tool designed to help traders identify important support and resistance levels, recognize potential breakout opportunities, and monitor possible price reversals using the proven Camarilla pivot-point concept. Built for traders who want a cleaner, more
Manyal trading system, CovEchoTrend Robot, focuses on reliability and flexibility. By employing statistical analysis methods to study the relationships between the base indicator and market patterns, the system enables a deeper understanding of market processes. Intelligent pattern analysis: The application of statistical data processing helps identify key trend reversal points more accurately, signaling significant market shifts. Informed decision-making is based on the intersection of indicato
Orderflow Super Candles - Simple Footprint Chart Indicator Platform: MetaTrader 5 (MT5)  (The last screenshot shows the use of the DOM tool in conjunction with the product.) 1. Product Introduction Orderflow Super Candles is a professional charting tool based on underlying Tick data analysis, designed to provide traders with a deep "X-ray" view of the market. By parsing the buy and sell volume distribution within each candlestick, this indicator visualizes the hidden market microstructure. It
The  OBV MTF  is an Enterprise-grade On-Balance Volume indicator that transforms standard OBV into a complete trading system. It combines gradient-aware momentum analysis, divergence detection, multi-timeframe alignment, and dynamic customisable midpoint-filtering in a single intuitive professional volume analysis tool. Core Features 1. 5-State Momentum Engine Aqua (Strong Bullish) : OBV slope rising with positive acceleration SteelBlue (Weak Bullish) : OBV rising but losing momentum Gray (Neutr
MFOP Market Forecast
Oscar Josue Pin Bacuzoy
Develop this indicator for periods of 30 minutes or more, focus on getting market trends right and making sure they are met. MFOP v8.1 gets straight to the point: it scans the market and tells you exactly when there is enough strength to enter a trade. This indicator doesn't do magic, it uses mathematical algorithms to filter out market noise, not enter into false breakouts and show you clear BUY (blue arrow) and SELL (red arrow) opportunities. It is designed and optimized specifically to take
Informative Trend
Vitalii Zakharuk
the fundamental technical indicator Informative Trend, which allows you to assess the current market situation in order to enter the market of the selected currency pair in a trend and with minimal risk. It basically uses the process of identifying the rate of change in price growth and allows you to find entry and exit points from the market. The indicator was created on the basis of the original indicators for searching for extreme points and is well suited for determining a reversal or a la
Rocket Trend
Andriy Sydoruk
The Rocket Trend indicator is trending. The indicator draws two-color points connected by lines along the chart. This is a trend indicator, it is an algorithmic indicator. It is easy to work and understand when a blue circle appears, you need to buy, when a red one appears, sell. The indicator is used for scalping and pipsing, and has proven itself well. Rocket Trend is available for analyzing the direction of the trend for a specific period of time. Ideal for novice traders learning the laws o
Introduction to Fractal Pattern Scanner Fractal Indicator refers to the technical indicator that makes use of the fractal geometry found in the financial market. Fractal Pattern Scanner is the advanced Fractal Indicator that brings the latest trading technology after the extensive research and development work in the fractal geometry in the financial market. The most important feature in Fractal Pattern Scanner is the ability to measure the turning point probability as well as the trend probabil
이 지표는 실제 거래에 완벽한 자동 파동 분석 지표입니다! 사례... 참고:   웨이브 그레이딩에 서양식 이름을 사용하는 데 익숙하지 않습니다. Tang Lun(Tang Zhong Shuo Zen)의 명명 규칙의 영향으로 기본 웨이브를   펜   으로 명명하고 2차 웨이브 밴드를   세그먼트   로 명명했습니다. 동시에, 세그먼트에는 추세 방향이 있습니다.   주요 추세 세그먼트에는   이름이 지정되지만(이 이름 지정 방법은 향후 노트에서 사용됩니다. 먼저 말씀드리겠습니다.) 알고리즘은 굴곡 이론과 거의 관련이 없으므로 그렇게 해서는 안 됩니다. 이는 나의 시장 분석을   통해 요약된 끊임없이 변화하고 복잡한 운영 규칙을   반영합니다. 밴드는 더 이상 사람마다 다르지 않도록 표준화되고 정의되었습니다. 인위적인 간섭의 드로잉 방법은 시장 진입을 엄격하게 분석하는 데 핵심적인 역할을 합니다. 이 지표를 사용하는 것은 거래 인터페이스의 미학을 개선하고 원래의 K-line 거래를
TPSproTREND PrO MT5
Roman Podpora
4.55 (20)
TPSproTrend PRO       - 이는 시장을 자동으로 분석하여 추세 및 추세 변화에 대한 정보를 제공하고 거래 진입 시점을 표시하는 추세 지표입니다.       다시 그릴 필요 없이!       새 버전       트렌드 라인즈 프로       — 개선된 진입점 감지 알고리즘, 추가 신호 필터링 및 업데이트된 시각화 기능. 지침 (러시아어)       -   지침       영어         -   MT4 버전 주요 이점 화면 재그리기 없이 신호를 보냅니다.       모든 신호가 고정되어 있습니다. 화살표가 나타나면 -           그것은 더 이상 변하거나 사라지지 않을 것입니다. 잘못된 신호의 위험 없이 안정적인 데이터를 기반으로 거래 결정을 내릴 수 있습니다. 바로 사용 가능한 매수/매도 진입점 이 지표는 거래 진입에 가장 적합한 시점을 자동으로 판단하여 차트에 화살표로 표시합니다. 추측이나 주관적인 분석이 아닌, 명확한 신호만 있습니다. 자동 손절매 및
ICT Institutional Zones Pro
Celestine Anyango Wabomba
ICT Institutional Zones Pro — Trade with Institutional Precision Stop wasting time manually drawing key ICT levels every day. ICT Institutional Zones Pro is a professional-grade MT5 indicator built for traders who use ICT (Inner Circle Trader) and Smart Money Concepts (SMC) to read market structure with precision. This indicator automatically maps the most important institutional levels directly on your chart, helping you instantly identify where smart money is likely accumulating, distributing
ENGLISH VERSION (for MQL5 Market) Product Description: RSI Trend & Volatility Dashboard (Multi-Timeframe Filter) This professional dashboard provides traders with an ultimate market overview inside a single chart. It continuously monitors the trend direction across 5 timeframes simultaneously: M5, M15, M30, H1, and D1 [MQL5]. No more tedious chart switching or multi-window clutter – see everything from quick scalping moves to global institutional daily trends in real-time [MQL5]. Key Adva
Gf Breakout
Kayode George Absi
A ZigZag indicator for MetaTrader 5 that finds swing highs and lows, spots W-bottom and M-top patterns, and gives a BUY or SELL signal when the second leg of a pattern forms at an H1 swing point and price breaks the trendline. 1. Key advantages See the structure at a glance. Clear red ZigZag lines join the major swings, with a down arrow on every swing high and an up arrow on every swing low. Trade with the higher timeframe. On M1, M5 or M15, a signal only appears when the second leg sits on an
Ultimate Double Top & Bottom (Pro Volume Matrix) Stop trading retail breakouts. Start trading Institutional Traps. The   Ultimate Double Top & Bottom   is not a standard, lagging pattern scanner. It is a highly advanced, non-repainting structural engine equipped with a proprietary   3-Leg Volume Matrix . Designed exclusively for Smart Money Concepts (SMC) and order flow traders, this indicator mathematically dissects the tick volume inside M and W patterns to reveal true institutional intent:  
Apex Heat Zone
Alier Nunez Fonseca
Daily VP Professional
Ammar Nahil Haj Ali
Daily VP Professional – Intraday Volume Profile for MT5 Daily VP Professional is a powerful, institutional-grade Volume Profile indicator built specifically for day traders, scalpers, and market structure analysts on MetaTrader 5. While standard technical indicators rely solely on time-based calculations, Daily VP Professional organizes volume directly by price levels across daily trading sessions. This exposes key institutional accumulation and distribution zones, giving you clear visibility in
FREE
BinaWin NoTouch
Juan Fernando Urrego Alvarez
BinaWin NoTouch is an indicator that sends an alert signal when the trade is in the right position to wait for the breakdown of a side market. It is specially designed to trade under the “No Touch” strategy of the Binary.Com platform with synthetic indexes N.10, N.25, N.50, N.75 and N.100 Similarly, trading can be done with the conventional CALL and PUT strategy of any Binary Options platform. Requirements to use the indicator: 1. Have an account at Binary.Com 2. Configure the Binary.Com d
FREE
거래량 프로파일 멀티모드: 지표 방식이 아닌, 원하는 방식으로 거래량을 분석하세요. 대부분의 거래량 프로파일 지표는 거래자들이 미리 정해진 분석 범위 안에 갇히도록 만듭니다. 하지만 시장은 고정된 틀 안에서 움직이지 않는데, 분석까지 그럴 필요가 있을까요? 볼륨 프로파일 멀티 모드는 거래량 분석 시점, 장소, 방법을 완전히 자유롭게 결정할 수 있도록 해줍니다. 시장 구조 분석, 거래 세션 프로파일링, 더 높은 시간대의 활동 모니터링, 또는 진행 중인 경매 추적 등 어떤 목적이든 이 지표는 사용자의 거래 스타일에 맞춰 조정되므로 사용자가 거래 스타일에 맞춰야 할 필요가 없습니다. 직관적인 워크플로우를 원하는 초보자와 유연성을 요구하는 전문가를 위해 설계된 Volume Profile Multi-Mode는 네 가지 강력한 프로파일링 방법을 하나의 고도로 상호작용적이고 맞춤 설정 가능한 거래 도구로 결합합니다. 4가지 강력한 프로파일링 모드 1.       플렉서블 박스 : 대시보드에서 토
Price Action Concept
Subrata Das
5 (1)
Price Action Suvo - Ultimate SMC & Trend Indicator  Key Features 1. Advanced Market Structure (BOS & CHoCH) Dual Structure Analysis:   Automatically identifies both   Internal Structure   (short-term) and   Swing Structure   (major trends). BOS & CHoCH:   Clearly marks   Break of Structure (BOS)   and   Change of Character (CHoCH)   with distinct styles. Visual Perfection: Internal:   Dotted lines for minor structure. Swing:   Solid lines for major structure. No Overlap:   Fixed logic prevent
FREE
Ugenesys AI MT5
Odaine Ramon Mcmillan
uGenesys AI - 90% Accurate Daytrading Indicator Introducing the ultimate forex trading indicator system, uGenesys AI, powered by cutting-edge AI technology and advanced analytical techniques, including Time-Series Analysis and Genetic Algorithms. Our AI-powered trading system leverages the power of time-series analysis to identify trends and patterns in historical price data, allowing traders to make informed predictions about future market movements. By analyzing vast amounts of data, our syst
가격이 유동성을 탐색할 수 있는 위치 파악 Liquidity Reaction Map MT5는 확인된 가격 구조를 기반으로 잠재적인 매수측 및 매도측 유동성 영역을 식별하는 차트 기반 시장 분석 지표입니다. 스윙 포인트, 동일 고점과 동일 저점, 전일 및 전주 레벨, 세션 고점과 저점, 심리적 라운드 가격을 하나의 정리된 유동성 지도에 결합합니다. 서로 가까운 레벨은 하나로 병합할 수 있으며 강도, 현재 가격과의 거리, 여러 출처의 일치 정도에 따라 순위가 결정됩니다. 이 지표는 가격이 유동성 영역에 접근하거나, 해당 유동성을 스윕하거나, 거부되거나, 돌파할 수 있는 위치를 분석하는 데 도움을 줍니다. 거래를 개시하거나 관리하지 않습니다. 유동성 출처 유동성 지도는 다음 항목을 기반으로 유동성을 식별할 수 있습니다. 확인된 스윙 고점과 저점 동일 고점과 동일 저점 전일 고점과 저점 전주 고점과 저점 완료된 세션의 고점과 저점 심리적 라운드 가격 레벨 설정 가능한 여러 시간대 매수측 유
Power House
Sabrina Hellal
PowerHouse v3 MT5 – Advanced Smart Money Concepts, KAMA Ribbon & MTF Matrix Short Summary: An institutional-grade SMC & ICT trading system featuring confirmed CHoCH/BOS market structure breaks, a 7-factor confluence engine (Grade A/B/C), adaptive trend ribbon, automated trade plans with live Won/Lost points metrics, and a 6-timeframe dashboard. Product Overview PowerHouse v3 is a professional-grade analytical indicator built for disciplined Forex, Indices, and Crypto traders on MetaTrader 5. Eng
Impulse fractals indicator - is counter-trend oriented complex market fractal pattern.  Market creates bull/bear impulse, trend starts, fractals on impulsed wave are an agressive pullback signals. Buy arrow is plotted when market is bearish and it's impulse showed up-side fractal, and sell arrow is plotted when market is bullish and it's impulse showed dn-side fractal. Main indicator's adjustable inputs : impulsePeriod - main period of impulse histogram  filterPeriod  - smoothes impulse accordi
BTC 퀀텀 AI 스캘퍼 PRO 메타트레이더 5용 전문가용 비트코인 ​​AI 트레이딩 지표 BTC 퀀텀 AI 스캘퍼 PRO는 고전적인 기술 분석, 시장 심리 분석, 그리고 독자적인 AI 기반 확률 엔진을 결합한 차세대 비트코인 ​​트레이딩 시스템입니다. 이동 평균이나 오실레이터에만 의존하는 기존 지표와 달리, 이 시스템은 다음과 같은 여러 핵심 시장 요소를 동시에 분석합니다. • 공포/탐욕 지수 • 펀딩 비율 • 펀딩 비율 델타 • 미결제 약정 델타 • 롱/숏 비율 • 매수/매도 비율 • 거래량 델타 • 암호화폐 뉴스 심리 이러한 데이터 소스를 기반으로, 이 지표는 독자적인 AI 점수를 계산하고 가장 강력한 거래 기회만을 식별합니다. 주요 기능 매수/매도 신호 확률 기반 거래 필터링 TP1 및 TP2 목표가 설정 동적 손절매 실시간 알림 추세 확인 시스템 시각적 거래 관리 레벨 추천 사용 사례 • 비트코인 ​​스캘핑 • 데이 트레이딩 • 모
Trading concept: When price touches or exceeds the upper circle boundary = potential sell signal (overbought) When price touches or falls below the lower circle boundary = potential buy signal (oversold) The circle acts like a dynamic support/resistance band around the opening price The numbered points (1-24) help identify where in the cycle the price currently is This is similar to using Bollinger Bands or other envelope indicators, but with a fixed radius instead of standard deviations.
XFlow
Maxim Kuznetsov
XFlow shows an expanding price channel that helps determine the trend and the moments of its reversal. It is also used when accompanying transactions to set take profit/stop loss and averages. It has practically no parameters and is very easy to use - just specify an important moment in the history for you and the indicator will calculate the price channel. DISPLAYED LINES ROTATE - a thick solid line. The center of the general price rotation. The price makes wide cyclical movements around the
TMA Centered Bands Indicator
Irina Cherkashina
5 (1)
The TMA Centered Bands Indicator for MT5 draws bands on the chart and shows the overall price trend. It displays three bands - the lower and upper boundaries of the channel and the median.   The bands are made up of moving averages, and each of them has an MA period. The name TMA comes from triangular moving averages, as the indicator draws triangular bands.   The price will fluctuate between these ranges whenever the trend changes direction, thus creating entry and exit points.   How to trade
FREE
NRP Smc Pro
Black Panther AI
NRP SMC PRO EA — Product Description Short Description Professional Smart Money Concepts Expert Advisor engineered for XAUUSD, combining institutional market structure analysis, Fair Value Gaps, liquidity sweeps, and prop-firm-focused risk management. Includes optional news filtering, trading sessions, trade journaling, and advanced capital protection. NRP SMC PRO EA — Institutional Smart Money Automation for MT5 NRP SMC PRO EA is a professional Smart Money Concepts Expert Advisor built around c
ROC acceleration-deceleration is the manual system for medium-term scalping. Indicator based on custom ROC system which defines bullish/bearish market and especially  acceleration-deceleration of tendention in the market's main direction. Buy arrow is plotted during bearish market when current trend decelerates and sell  arrow is plotted during bullish market when current trend decelerates. Main Indicator's Features Signals are not repaint,non-late or disappear(exept cases when system recalculat
이 제품의 구매자들이 또한 구매함
Entry Points Pro for MT5
Yury Orlov
4.52 (153)
Entry Points Pro는 주문을 넣기 전에 어디에서 진입하고, 스탑을 어디에 두고, 어떤 랏으로 거래할지 보여 줍니다. 가격 지금 199 USD이며, 이 가격으로는 8카피입니다. 이후 가격은 249 USD, 최종 가격은 349 USD입니다. 저는 시장에서 트레이딩으로 돈을 벌고 그것을 보여 드립니다. 그래서 이 인디케이터를 모두에게 팔 필요가 없습니다. 스스로 생각하는 트레이더를 위한 도구이지, 마법 버튼이 아닙니다. 돌파가 없으면 거래도 없습니다. 회색 화살표는 취소된 신호입니다. 가격이 신호 캔들을 돌파하지 못했으므로 진입도 손실도 없습니다. 화살표는 캔들이 마감될 때 나타나며 리페인팅되지 않습니다. 설정은 두 가지: 예치금과 거래당 리스크. 결제 전에 확인하세요: 무료 데모는 MT5 전략 테스터에서 작동하며 2분이면 됩니다. 구매 후에는 제가 직접 설정을 도와 드리겠습니다. 2019년, 저는 이 지표가 무엇을 할 수 있는지 전 세계에 보여 주었습니다. 실계좌에서 지표의
Gann Made Easy MT5
Oleg Rodin
5 (13)
Gann Made Easy 는 mr.의 이론을 사용하여 최고의 거래 원칙을 기반으로 하는 전문적이고 사용하기 쉬운 Forex 거래 시스템입니다. W.D. 간. 이 표시기는 Stop Loss 및 Take Profit Levels를 포함하여 정확한 BUY 및 SELL 신호를 제공합니다. PUSH 알림을 사용하여 이동 중에도 거래할 수 있습니다. 구매 후 거래 방법 안내 및 유용한 추가 지표를 무료로 받으시려면 저에게 연락주세요! 아마도 Gann 거래 방법에 대해 이미 여러 번 들었을 것입니다. 일반적으로 Gann의 이론은 초보자 거래자뿐만 아니라 이미 거래 경험이 있는 사람들에게도 매우 복잡한 것입니다. Gann의 거래 방식은 이론적으로 적용하기 쉽지 않기 때문입니다. 나는 그 지식을 연마하고 Forex 지표에 최고의 원칙을 적용하기 위해 몇 년을 보냈습니다. 표시기는 적용하기가 매우 쉽습니다. 차트에 첨부하고 간단한 거래 권장 사항을 따르기만 하면 됩니다. 지표는 지속적으로 시장 분석
Ultra Indicator
Ihor Otkydach
5 (1)
ULTRA는 “올인원” 방식으로 작동하는 기술적 지표로, 시장을 독자적으로 분석하고, 매매 신호를 생성하며, 손절매 주문 설정 수준을 표시하고, 이익을 실현하거나 손실을 최소화하기 위해 포지션을 청산해야 할 시점을 제안합니다. 다시 말해, 시장을 분석하는 법을 모르거나, 가격 수준(손절매를 어디에 설정할지)을 파악하지 못하거나, 자금 관리에 어려움을 겪더라도 상관없습니다. ULTRA가 그 모든 것을 대신 해줄 테니까요! 구매자 특전 : ULTRA 지표를 구매하신 후, 저에게 비공개 메시지를 보내주시면 “ULTRA BOT”을 무료 선물로 드립니다. 이 도구는 해당 지표의 신호를 바탕으로 개설한 거래를 관리하는 데 도움을 주는 특별한 도구입니다(각 거래에 대해 손절매를 설정하고, 최상의 결과를 얻을 수 있도록 전략의 규칙에 따라 거래를 자동으로 청산해 줍니다).  또한 구매자분들께 다양한 자산에 바로 적용할 수 있는 설정값을 제공해 드리고 있으며, 이를 통해 지표가 최대 효율로 작동할
Boba Analysis Suite
Trade Ready Solutions LLC
5 (2)
Boba Analysis Suite Boba Analysis Suite는 MetaTrader 5용 분석 지표입니다. 시장 구조, 주요 가격 영역, 전반적인 시장 상황을 하나의 차트 화면에 통합하여 표시합니다. 트레이더이자 트레이딩 코치로서의 실무 경험을 바탕으로 개발되었으며, 시장 방향 평가, 주요 가격 수준 식별, 여러 시간대의 종합적인 분석 등 체계적인 분석 과정을 지원합니다. 시장 맥락을 고려한 분석 개별 신호의 의미는 시장 상황에 따라 달라집니다. Boba Analysis Suite는 현재 차트 상황을 더 넓은 시장 구조와 연결하고, 사전에 정한 규칙에 따라 매매 아이디어를 검토할 수 있도록 돕습니다. 주요 분석 기능은 다음과 같습니다. 추세 및 시장 구조: 시장 방향과 관련 구조적 맥락을 평가합니다. 주요 가격 영역 및 수준: 추가 분석이 필요한 중요한 영역을 차트에 시각적으로 표시합니다. 여러 시간대: 서로 다른 시간대의 정보를 통합하여 전반적인 시장 상황을 평가합니다.
M1 Sniper MT5
Oleg Rodin
5 (7)
M1 SNIPER 는 사용하기 쉬운 거래 지표 시스템입니다. M1 시간대에 맞춰 설계된 화살표 지표입니다. 이 지표는 M1 시간대 스캘핑을 위한 단독 시스템으로 사용할 수 있으며, 기존 거래 시스템의 일부로도 사용할 수 있습니다. 이 거래 시스템은 M1 시간대 거래용으로 특별히 설계되었지만, 다른 시간대에도 사용할 수 있습니다. 원래는 XAUUSD와 BTCUSD 거래를 위해 이 방법을 설계했지만, 다른 시장 거래에도 유용하다는 것을 알게 되었습니다. 이 지표의 신호는 추세 방향과 반대로 거래될 수 있습니다. 저는 지표의 신호를 활용하여 양방향으로 거래할 수 있도록 돕는 특별한 거래 기법을 알려드립니다. 이 방법은 특별한 동적 지지선과 저항선 가격 영역을 활용하는 것을 기반으로 합니다. 구매하시면 M1 SNIPER 화살표 지표를 바로 다운로드하실 수 있습니다. 또한, 아래 스크린샷에 표시된 Apollo Dynamic SR 지표는 M1 SNIPER 도구를 사용하는 모든 사용자에게 무료로
Apex Patterns PRO 인디케이터 구매 시 - 기반 Expert Advisor 무료 제공. 자체 최적화 차트 패턴 및 브레이크아웃 분석 시스템 기존의 패턴 스캐너는 고정된 파라미터에 의존하므로 시장 변동성과 구조가 변화할 때 성능이 저하되는 경우가 많습니다. Apex Patterns PRO는 구조적 차트 패턴 인식, 모멘텀 필터링, 통계적 자체 최적화를 하나의 분석 프레임워크로 결합하여 변화하는 시장 환경에 적응하도록 설계되었습니다. 적응형 스캐닝 엔진 자체 최적화 패턴 모드 최근 과거 데이터를 바탕으로 적절한 패턴 파라미터를 자동으로 탐색하여, 정적인 설정 대신 현재 시장 행보에 맞춰 인디케이터의 구조 감지 방식을 적응시킵니다. 스마트 브레이크아웃 필터링 클래식 패턴 인식과 모멘텀, 거래량, 프라이스 액션 지표를 결합합니다. 모든 브레이크아웃을 동일하게 다루는 대신, 시장의 기저 구조를 평가하여 현재 통계적 환경에 부합하는 셋업을 식별합니다. 주요 기능 리페인트 없는 고
Auto Optimized SpeedAngle 은 지속적인 워크포워드 최적화(Walk-Forward Optimization, WFO)를 통해 곡선 적합(curve-fitting)을 제거한 기관 수준의 모멘텀 벡터화 시스템입니다. 시장 체제가 바뀔 때 성능이 떨어지는 정적 입력에 의존하는 대신, 이 지표는 표본 외(Out-of-Sample, OOS) 검증을 사용하여 매개변수를 동적으로 재보정하며, 표시되는 신호가 과거의 우연이 아닌 진정한 통계적 우위를 나타내도록 보장합니다. 핵심 기관용 프레임워크 워크포워드 최적화 엔진: 핵심 알고리즘은 수천 가지의 룩백(lookback) 및 임계값 조합을 지속적으로 스캔하며, 데이터를 인샘플(in-sample)과 표본 외(out-of-sample) 세트로 엄격하게 분리합니다. 미지의 데이터 환경에서 수학적 우수성이 증명된 경우에만 새로운 매개변수 구성을 채택합니다. 정량적 목적 함수: 순수한 총이익을 쫓는 대신, 최적화 엔진은 기관 수준의 안정성
SQN Max indicator for MT5 by ITC
Renaud Herve Francois Candel
Sqn Max Indicator Sqn Max is an exclusive indicator to trade the market with high effectiveness. The indicator is based on price action, volatility and trend. This indicator is as simple as possible but not too simple. The indicator can generate alerts to ease the trading process. You don't have to stay all day in front of your screen. The indicator can be used with any class of assets and with any time frame. It is possible to achieve better results trading our list of selected assets. We achi
Divergence Bomber
Ihor Otkydach
4.89 (94)
이 지표를 구매하신 분께는 다음과 같은 혜택이 무료로 제공됩니다: 각 거래를 자동으로 관리하고, 손절/익절 수준을 설정하며, 전략 규칙에 따라 거래를 종료하는 전용 도우미 툴 "Bomber Utility" 다양한 자산에 맞게 지표를 설정할 수 있는 셋업 파일(Set Files) "최소 위험", "균형 잡힌 위험", "관망 전략" 모드로 설정 가능한 Bomber Utility의 셋업 파일 이 전략을 빠르게 설치, 설정, 시작할 수 있도록 돕는 단계별 영상 매뉴얼 주의: 위의 모든 보너스를 받기 위해서는 MQL5 개인 메시지 시스템을 통해 판매자에게 연락해 주세요. 독창적인 커스텀 지표인 “Divergence Bomber(다이버전스 봄버)”를 소개합니다. 이 지표는 MACD 다이버전스(괴리) 전략을 기반으로 한 올인원(All-in-One) 거래 시스템입니다. 이 기술 지표의 주요 목적은 가격과 MACD 지표 간의 다이버전스를 감지하고, **향후 가격이 어느 방향으로 움직일지를 알려주
통화 강도 마법사는 성공적인 거래를 위한 올인원 솔루션을 제공하는 매우 강력한 지표입니다. 표시기는 여러 시간 프레임의 모든 통화 데이터를 사용하여 이 또는 해당 외환 쌍의 힘을 계산합니다. 이 데이터는 특정 통화의 힘을 확인하는 데 사용할 수 있는 사용하기 쉬운 통화 지수 및 통화 전력선의 형태로 표시됩니다. 필요한 것은 거래하려는 차트에 표시기를 부착하는 것뿐입니다. 표시기는 거래하는 통화의 실제 강세를 보여줍니다. 지표는 또한 추세와 거래할 때 유리하게 사용할 수 있는 구매 및 판매 거래량 압력의 극한값을 보여줍니다. 지표는 또한 피보나치에 기반한 가능한 대상을 보여줍니다. 표시기는 PUSH 알림을 포함한 모든 유형의 알림을 제공합니다. 구매 후 연락주세요. 나는 당신과 거래 팁을 공유하고 당신에게 무료로 훌륭한 보너스 지표를 줄 것입니다! 나는 당신에게 행복하고 유익한 거래를 기원합니다!
Dynamic Forex28 Navigator MT5
Bernhard Schweigert
5 (1)
다중 통화 강도 및 모멘텀 지표 MT5 Dynamic Forex28 Navigator는 오랫동안 사랑받아 온 인기 지표들의 진화형으로, 다섯 가지의 힘을 하나로 결합했습니다. Advanced Currency Strength28 Indicator (리뷰 700개) Advanced Currency IMPULSE with ALERT (리뷰 530개) Currency Strength EXOTICS GOLD Impulse with Alert CS28 Combo Signals (최근 보너스) 지표 네 개를 따로 구매해 차트에 겹쳐 놓을 필요가 없습니다. 28개 Forex 페어의 강도, 이를 이끄는 시장의 모멘텀, 그리고 두 가지 모두의 알림이 하나의 강력한 지표로 통합되어 한 창, 한 차트에서 확인할 수 있습니다. 위 프로그램들은 MQL5 Market에서 1,200개 이상의 리뷰를 받았으며 2016년부터 MT4 커뮤니티의 필수 지표로 자리잡았습니다. Dynamic Forex28 Navigato
Scalper Vault MT5
Oleg Rodin
5 (1)
Scalper Vault는 당일 매매(intraday trading)에서 일관된 성과를 내고자 하는 트레이더를 위해 설계된, 강력하고 모든 기능을 갖춘 트레이딩 시스템입니다. 이 고정밀 지표는 외환(Forex) 및 바이너리 옵션 트레이더 모두에게 기관급 분석을 제공하는 독립적인 종합 트레이딩 시스템 역할을 합니다. 구매 후 저에게 연락해 주시면, 트레이딩 팁과 함께 특별한 보너스를 제공해 드립니다! Scalper Vault는 추측에 의존하거나 복잡한 수동 분석을 할 필요를 없애주며, 사용하기 쉬운 트레이딩 기법을 통해 오직 매매 실행에만 집중할 수 있도록 돕습니다. 정확한 추세 추종 신호: 핵심 알고리즘이 시장 구조를 분석하여, 지배적인 시장 추세 방향과 일치하는 고확률 신호만을 제공함으로써 잘못된 진입을 획기적으로 줄여줍니다. 정밀한 고점 및 저점 탐지: 시장의 움직임이 소진되는 지점을 스캔하여 잠재적인 반전 구간을 식별합니다. 간(Gann) 이론 기반의 매수/매도 구간: 수학적
Azimuth Pro
Ottaviano De Cicco
5 (7)
Azimuth Pro V2: Synthetic Fractal Structure and Confirmed Entries for MT5 Overview Azimuth Pro is a multi-level swing structure indicator by Merkava Labs . Four nested swing layers, swing-anchored VWAP, ABC pattern detection, three-timeframe structural filtering, and closed-bar confirmed entries — one chart, one workflow from micro-swings to macro-cycles. This is not a blind signal product. It is a structure-first workflow for traders who care about location, context, and timing. Halloween P
ARICoins
Temirlan Kdyrkhan
ARICoin is a powerful trading companion designed to generate high-probability entry signals with dynamic TP/SL/DP levels based on volatility. Built-in performance tracking shows win/loss stats, PP1/PP2 hits, and success rates all updated live. Key Features: Buy/Sell signals with adaptive volatility bands Real-time TP/SL/DP levels based on ATR Built-in MA Filter with optional ATR/StdDev volatility Performance stats panel (Success, Profit/Loss, PP1/PP2) Alerts via popup, sound, push, or email Cust
Adaptive Price Action Engine 지표를 구매하면 EA(자동매매 프로그램)가 무료 멀티 타임프레임 기반 자기 최적화 추세 & 캔들 패턴 분석 시스템 시장은 끊임없이 변화하며, 모든 Price Action 패턴이 모든 시장 환경에서 동일한 가치를 가지는 것은 아닙니다. Adaptive Price Action Engine 은 변화하는 시장 환경에 적응할 수 있도록 설계되었으며, 추세 구조, 멀티 타임프레임 분석, 캔들 패턴 및 통계적 최적화 를 하나의 분석 프레임워크로 결합합니다. 두 가지 적응형 모드 Dual Alpha Trend Mode 낮은 타임프레임과 높은 타임프레임에서 적합한 Alpha Trend 파라미터를 자동으로 탐색하여, 최근 시장 움직임에 맞춰 추세 분석을 조정합니다. Candlestick + Alpha Mode Alpha Trend를 통한 시장 국면 분석과 22개의 상승 및 하락 캔들 패턴 을 결합합니다. 모든 패턴을 동일하게 취급하는 대신, 다양
PZ Swing Trading MT5
PZ TRADING SLU
5 (5)
Protect against whipsaws: revolutionize your swing trading approach Swing Trading is the first indicator designed to detect swings in the direction of the trend and possible reversal swings. It uses the baseline swing trading approach, widely described in trading literature. The indicator studies several price and time vectors to track the aggregate trend direction and detects situations in which the market is oversold or overbought and ready to correct. [ Installation Guide | Update Guide | Tro
Advance AI Scanner
Mohamed Samsudeen
5 (1)
Advance AI Scanner is a multi-symbol analysis indicator for MetaTrader 5. It scans Forex pairs, metals, energy, stock indices and cryptocurrencies at the same time and rates each instrument with its own self-training model. It explains in plain English what moved each market and why, and it estimates how far upcoming economic news usually moves each symbol, measured on your broker's own price history. $199 instead of $499. 10 copies left at this price. One time purchase  Installation and User
Neuro Poseidon MT5
Daria Rezueva
4.68 (53)
Neuro Poseidon is a new indicator by Daria Rezueva. It combines precise trading signals with adaptive TP/SL levels - creating best possible trades as a result! Message me and get  Neuro Poseidon Assistant  as a gift to automize your trading process! What makes it stand out? 1. Proven profitability on all assets and timeframes 2. Only confirmed BUY and SELL signals present on the chart 3. Adaptive TP & SL levels generated by the software for each trade 4. Easy to understand - suitable for al
SIO Oscillator
Davit Beridze
SIO Oscillator: 자기 최적화 세미분산 불균형 오실레이터 지표를 구매하시면 이를 기반으로 한 전문가 어드바이저(EA)를 무료로 받으실 수 있습니다. 대부분의 오실레이터는 모든 가격 움직임을 똑같이 취급합니다. SIO는 상승 압력과 하락 압력을 분리하여 둘 사이의 불균형을 측정하고, 매수자와 매도자 중 어느 쪽이 실제로 시장을 주도하고 있는지 보여줍니다. 불균형이 극단에 도달하면 SIO는 진입가, 손절(Stop Loss), 익절(Take Profit) 수준이 포함된 명확한 신호를 표시합니다. SIO의 차별점은 고정된 설정에 의존하지 않는다는 것입니다. 내장된 자기 최적화 엔진이 현재 종목과 시간 프레임에 맞는 파라미터를 지속적으로 탐색하고, 사용하기 전에 검증합니다. 두 가지 신호 모드 평균 회귀(Mean Reversion): 불균형의 극단에서 거래하며 균형으로의 복귀를 노립니다. 추세 추종(Trend Following): 지속적이고 우세한 불균형의 방향으로 거래합니다. 자
Advanced Supply Demand MT5
Bernhard Schweigert
4.53 (15)
현재 33% 할인! 초보자나 전문 트레이더를 위한 최고의 솔루션! 이 보조지표는 우리가 다수의 독창적 기능과 새로운 공식을 통합한 독특하고 고품질이며 저렴한 거래 도구입니다. 이 업데이트를 통해 이중 시간대를 표시할 수 있습니다. 더 높은 TF를 표시할 수 있을 뿐만 아니라 차트 TF와 더 높은 TF 모두를 표시할 수 있습니다: 중첩 영역 표시. 모든 Supply Demand 트레이더들이 좋아할 것입니다. :) 중요한 정보 공개 Advanced Supply Demand의 잠재력을 극대화하려면 다음을 방문하십시오. https://www.mql5.com/ko/blogs/post/720245   진입 또는 목표의 명확한 트리거 포인트를 정확히 찾아냄으로 해서 거래가 어떻게 개선될지 상상해 보십시오. 새로운 알고리즘을 기반으로 매수자와 매도자 간의 잠재적인 불균형을 훨씬 더 쉽게 분간할 수 있습니다. 왜냐하면 가장 강한 공급영역과 가장 강한 수요 영역과 과거에 어떻게 진행 되었는지를(이전
ScalpPoint
Temirlan Kdyrkhan
ScalpPoint is a powerful trading companion designed to generate high-probability entry signals with dynamic TP/SL/DP levels based on volatility. Built-in performance tracking shows win/loss stats, PP1/PP2 hits, and success rates — all updated live. Key Features: Buy/Sell signals with adaptive volatility bands Real-time TP/SL/DP levels based on ATR Built-in MA Filter with optional ATR/StdDev volatility Performance stats panel (Success, Profit/Loss, PP1/PP2) Alerts via popup, sound, push, or emai
Superhero
Ihor Otkydach
5 (3)
SUPERHERO 지표는 “올인원” 방식으로 설계된 다중 통화 거래 시스템입니다. 이 지표는 시장을 독자적으로 분석하여 포지션을 개설하고 청산할 시점에 대한 신호를 제공합니다. 손절매(Stop Loss) 및 익절(Take Profit) 주문을 활용하며, 위험 대비 수익 비율(R:R)은 1:1입니다. 이 시스템은 스마트폰으로 푸시 알림을 전송할 수 있으므로, PC에 묶여 있을 필요 없이 “이동 중에도” 매매를 할 수 있습니다. 이는 자체 거래 전문 회사에 안성맞춤입니다. 모든 고객님께 드리는 특별 혜택: 이 지표를 구매하시는 모든 분께는 제가 특별히 준비한 유틸리티를 선물로 드릴 예정이며, 이 유틸리티는 다음과 같은 기능을 제공합니다: 손절매 및 익절 주문을 자동으로 설정합니다 가격이 목표 수준에 도달하면 자동으로 포지션을 청산합니다 미결제 주문 거래를 지원합니다 평균화 거래 모드를 지원합니다 이 훌륭하고 매우 편리한 유틸리티를 선물로 받고 싶으시다면, SUPERHERO 지표를 구매하
Bill Williams Advanced
Siarhei Vashchylka
5 (11)
Bill Williams Advanced is designed for automatic chart analysis using Bill Williams' "Profitunity" system. The indicator analyzes four timeframes at once. Manual (Be sure to read before purchasing) Advantages 1. Analyzes the chart using Bill Williams' "Profitunity" system. Signals are displayed in a table in the corner of the screen and on the price chart. 2. Finds all known AO and AC signals, as well as zone signals. Equipped with a trend filter based on the Alligator. 3. Finds "Divergence Bar
Naked Forex Kangaroo Tail Pro Indicator Kangaroo Tail Pro Indicator is a pattern recognition indicator for Forex, Stocks, Indices, Futures, Commodities and Cryptos. The Kangaroo Tail is a multi-bar pattern. The Kangaroo Tail pattern is very effective and is very simple to trade. The strategy that comes with the Kangaroo Tail is based on price action. The indicator does what it was designed for: displaying Kangaroo Tail patterns.     Don't expect to follow the up and down arrows and make mone
AriFocus
Temirlan Kdyrkhan
AriFocus - Non-Repainting Buy/Sell Signals AriFocus - one clear signal. AriFocus marks buy and sell signals directly on the chart and suggests a stop-loss level for each one. Every signal is confirmed on bar close and never repaints. - Buy/sell arrows, confirmed on bar close - Suggested stop-loss level for every signal - Trend band and candle coloring to show direction at a glance - 10 ready-made presets, or your own settings (14 calculation methods) - Pop-up, push and email alerts with entr
Volatility Master for MetaTrader is a real-time dashboard tool that scans up to  50 symbols  to identify high-volatility , trending markets instantly. With bullish/bearish signals, customizable alerts, and a user-friendly interface, it helps you avoid range-bound conditions and focus on high-probability trades. Clarity leads to confidence. Trade confidently and protect your capital effectively with this powerful dashboard. We don't offer free or bonus indicators in exchange of reviews from you.
FX Sniper Orange indicator for MT5
Renaud Herve Francois Candel
FX Sniper Orange Indicator FX Sniper Orange is an exclusive indicator to spot situations where market has gone too far and market could reverse soon after. The indicator displays arrows in your chart indicating probable future price action (see screenshot attached). FX Sniper Orange never repaints. Once candle is closed signal is confirmed and arrow will never disappear. Users of the indicator can setup alerts when new arrows are displayed in the chart. Inputs of the indicator are: Distanc
ARIPoint
Temirlan Kdyrkhan
1 (4)
ARIPoint is a powerful trading companion designed to generate high-probability entry signals with dynamic TP/SL/DP levels based on volatility. Built-in performance tracking shows win/loss stats, PP1/PP2 hits, and success rates all updated live. Key Features: Buy/Sell signals with adaptive volatility bands Real-time TP/SL/DP levels based on ATR Built-in MA Filter with optional ATR/StdDev volatility Performance stats panel (Success, Profit/Loss, PP1/PP2) Alerts via popup, sound, push, or email Cu
SkyHammer Signal Pro
Shengzu Zhong
5 (5)
SkyHammer Signal Pro Entry, SL, TP 레벨이 고정되는 전문 No-Repaint 추세 신호 인디케이터 SkyHammer Signal Pro는 명확하고 고정되며 검증 가능한 신호를 원하는 트레이더를 위해 설계된 구조적인 추세 및 모멘텀 신호 인디케이터입니다. 특히 M1 및 M5 같은 낮은 시간대에서 가장 효과적으로 작동합니다. 이 인디케이터는 시장의 고점이나 저점을 예측하려고 하지 않습니다. 대신 신호를 생성하기 전에 확인된 시장 구조, 추세 방향, 모멘텀 강도, 건강한 변동성, 그리고 목표까지의 충분한 공간을 기다립니다. 주요 기능 고정 신호 메커니즘 신호가 확인되면 화살표, Entry, Stop Loss, TP1, TP2 레벨이 차트에 영구적으로 고정됩니다. 이후 캔들 움직임 때문에 신호가 사라지거나, 이동하거나, 변경되지 않습니다. 이를 통해 트레이더는 각 신호를 명확하게 검토할 수 있으며, 실시간 시장에서 신호가 사라지는 일반적인 문제를 피할 수 있습니다
초보자 또는 전문가 트레이더를 위한 최고의 솔루션! 이 지표는 우리가 독점 기능과 비밀 공식을 통합했기 때문에 독특하고 고품질이며 저렴한 거래 도구입니다. 단 하나의 차트로 28개 통화 쌍 모두에 대한 경고를 제공합니다. 새로운 추세 또는 스캘핑 기회의 정확한 트리거 포인트를 정확히 찾아낼 수 있기 때문에 거래가 어떻게 개선될지 상상해 보십시오! 새로운 기본 알고리즘을 기반으로 구축되어 잠재적인 거래를 훨씬 더 쉽게 식별하고 확인할 수 있습니다. 이는 통화의 강세 또는 약세가 가속되는지 여부를 그래픽으로 표시하고 가속 속도를 측정하기 때문입니다. 자동차의 속도계처럼 생각하면 됩니다. 가속화할 때 Forex 시장에서 동일한 일이 분명히 더 빠르게 발생합니다. 즉, 반대 방향으로 가속화되는 통화를 페어링하면 잠재적으로 수익성 있는 거래를 식별한 것입니다. 통화 모멘텀의 수직선과 화살표가 거래를 안내합니다! 역동적인 Market Fibonacci 23 레벨은 경고 트리거로 사용되며
제작자의 제품 더 보기
Liquidation Radar
Andrei Lukoianov
Crypto Liquidation Radar First, a LIQ event. Then, the price reaction. Direction confirmation is a separate step. After a sharp rise or fall, the main question is: will the move continue, or is the market preparing to reverse? Crypto Liquidation Radar helps you assess this situation on your MetaTrader 5 chart. It highlights unusual price movements with increased volume, shows the strength of each detected event, and marks the confirmed LONG or SHORT direction. Circles draw attention to events. T
MSL Liquidity Zones
Andrei Lukoianov
Liquidity Zones is a free MetaTrader 5 indicator by MarketStructureLab. It automatically highlights support and resistance zones, counts separate price returns and marks broken zones. The indicator helps you keep important price areas in view and assess how the market reacts to them. Colored zones, compact labels and historical levels make it useful for both beginners and experienced traders with their own analysis methods. Main features Zones based on confirmed price swings. Support zones come
FREE
PSAR Strategy
Andrei Lukoianov
PSAR Strategy See the trend direction and spot changes on one chart. PSAR Strategy is a trend indicator for MetaTrader 5 that combines Parabolic SAR, an EMA direction filter, and an ADX trend strength filter . Colored dots show the current PSAR state, large circles highlight direction changes, and transparent shading makes the chart easier to read. Alerts can notify you when a direction change meets your selected filter conditions. Clear Chart Display Turquoise dots below price — bullish PSAR st
FREE
MSL Friendly Trend
Andrei Lukoianov
Friendly Trend is a MetaTrader 5 indicator by MarketStructureLab. It helps you see the trend direction, notice changes in its state and compare conditions across several timeframes. The indicator displays a smooth adaptive line, a colored ribbon and BULLISH / BEARISH labels. A compact dashboard shows the states of four selected timeframes and their combined result. Beginners can use it as a visual guide. Experienced traders can use it as an additional filter within their own analysis process. Wh
FREE
Trend State Signals
Andrei Lukoianov
Trend State Signals is a free indicator for MetaTrader 5 by MarketStructureLab. It helps you see the current trend state and notice changes in direction through an adaptive line and BULLISH / BEARISH labels. Use it to assess the market visually or as an additional confirmation tool in your trading strategy. Beginners get a clear guide on the chart. Experienced traders get an adjustable filter for market direction. What you see on the chart Colored line: turquoise shows a bullish filter state, wh
FREE
MSL Trade Master
Andrei Lukoianov
Trade Master Check the direction before entering. Get an alert when it changes. You have found a level, a pattern, or another area of interest. The next question is: does your idea follow the current market direction or go against it? Trade Master provides a clear visual reference directly on your MetaTrader 5 chart. A green ribbon shows a bullish state, while a red-pink ribbon shows a bearish state. A contrasting marker highlights direction changes, and terminal alerts help you notice them. The
Pr0fit Navigator
Andrei Lukoianov
Profit Navigator — from confirmed signals to targets and setup tracking on one chart. A LONG or SHORT signal appears. What happens next? Which targets have been reached? Where is the active stop? Are the conditions for reentry in place after an exit? Profit Navigator brings signals, three targets, a dynamic stop and statistics into one clear workflow. You can follow both the signal and the setup’s subsequent development — directly on your MetaTrader 5 chart. Less manual drawing. Less searching f
필터:
리뷰 없음
리뷰 답변