Trend Range Breakout Pro

  • 지표
  • Carlos Dante Diaz
    Carlos Dante Diaz
    안녕하세요, 저는 아르헨티나 출신의 프로그래머이자 알고리즘 트레이더인 Carlos Díaz입니다. 트레이더로서 10년 이상의 경험이 있습니다. 저는 MetaEditor와 MetaTrader 5의 Strategy Tester를 사용해 모든 Expert Advisor를 MQL5로 설계하고 프로그래밍하고 테스트합니다.
    여러 상품을 오랫동안 거래하면서 봇을 만들 때 중요한 실무적인 세부 사항들을 배웠습니다. 스프레드, 체결, 슬리피지, 그리고 브로커와 심볼마다 다른 고유한 조건들입니다. 이 경험을 제가 공개하는 모든 EA에 담고 있습니다.
  • 버전: 1.0
  • 활성화: 10
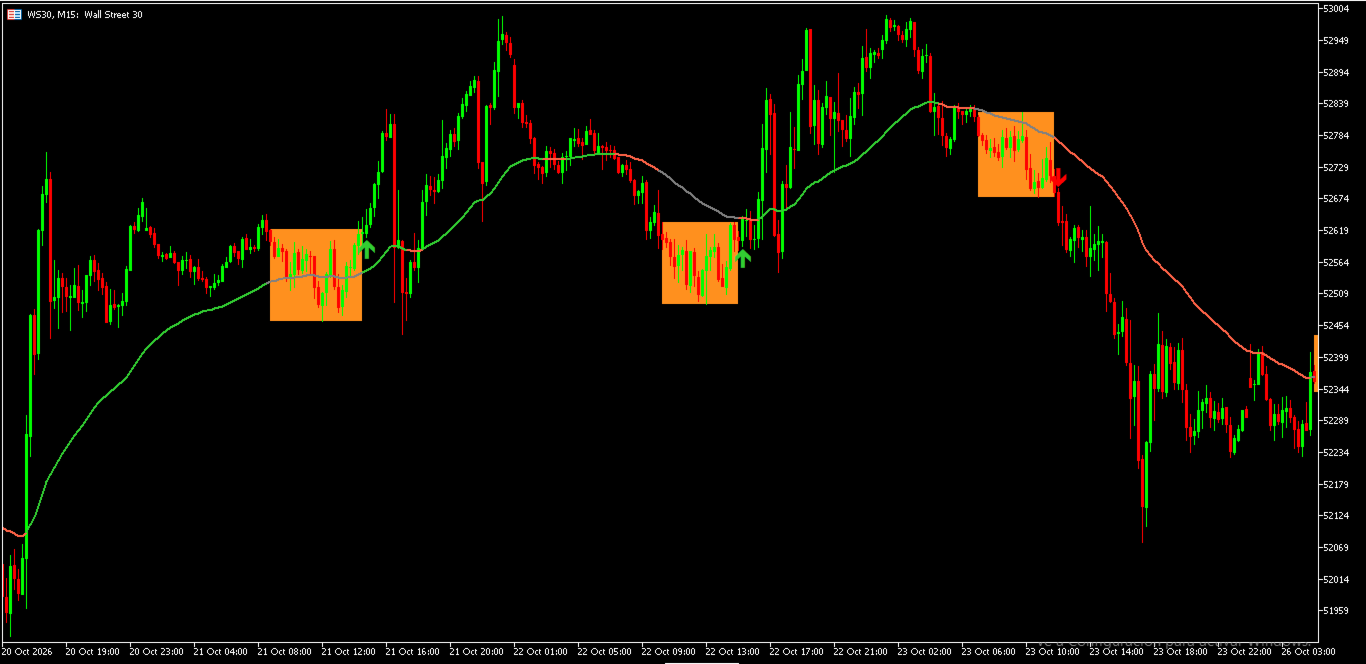
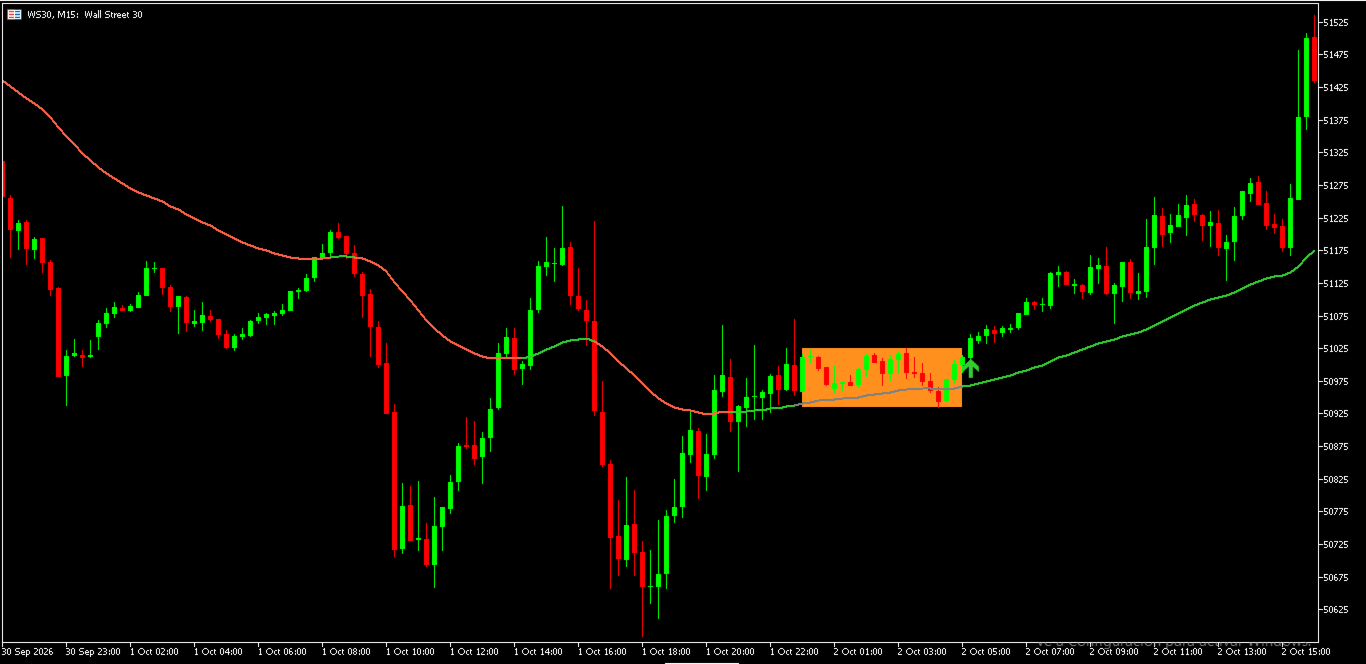
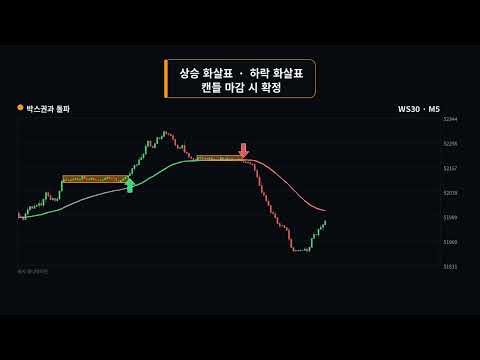
Trend Range Breakout Pro는 차트상의 횡보 구간(콘솔리데이션)을 자동으로 감지하여 가격이 해당 구간을 벗어나는 횡보 돌파 순간을 시각적으로 보여줍니다.

차트 표시 항목

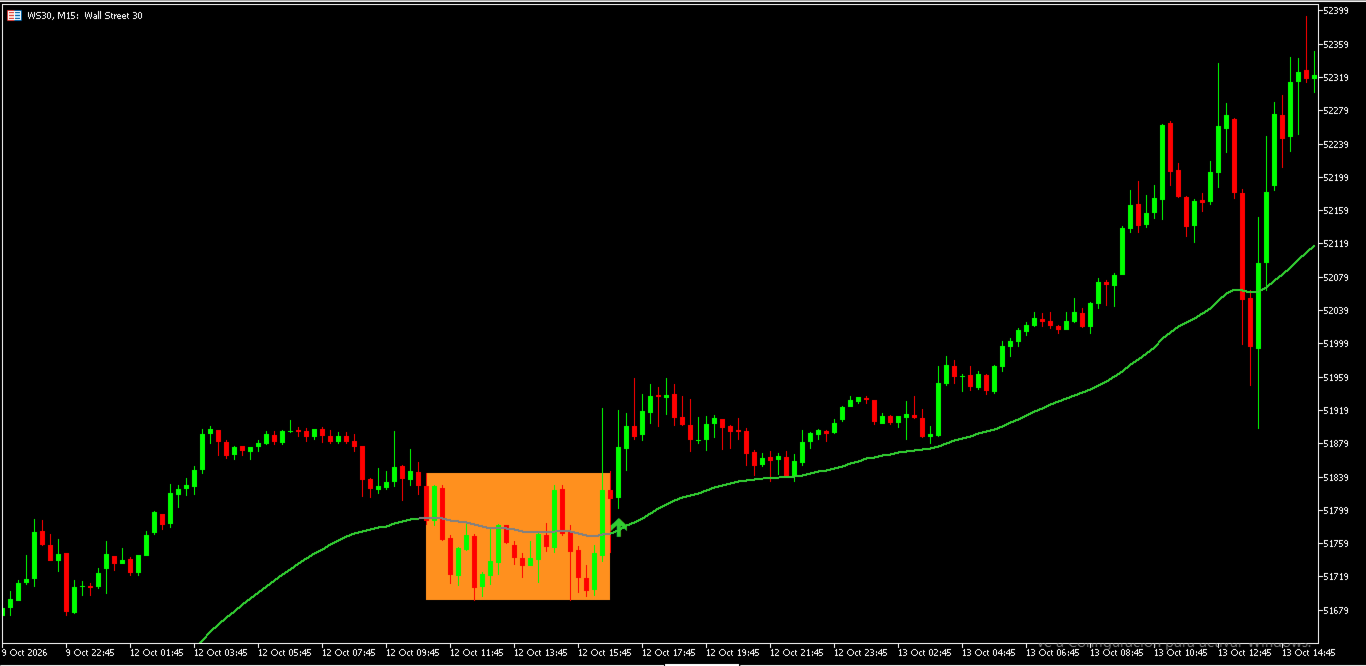
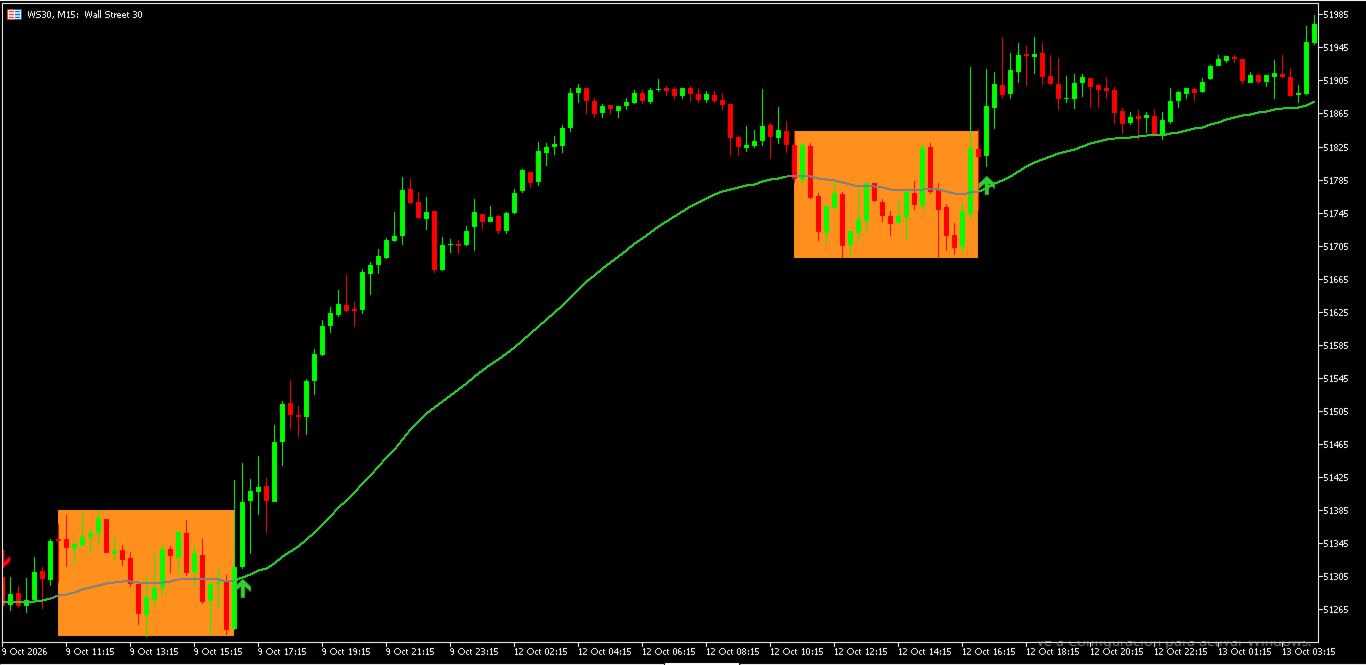
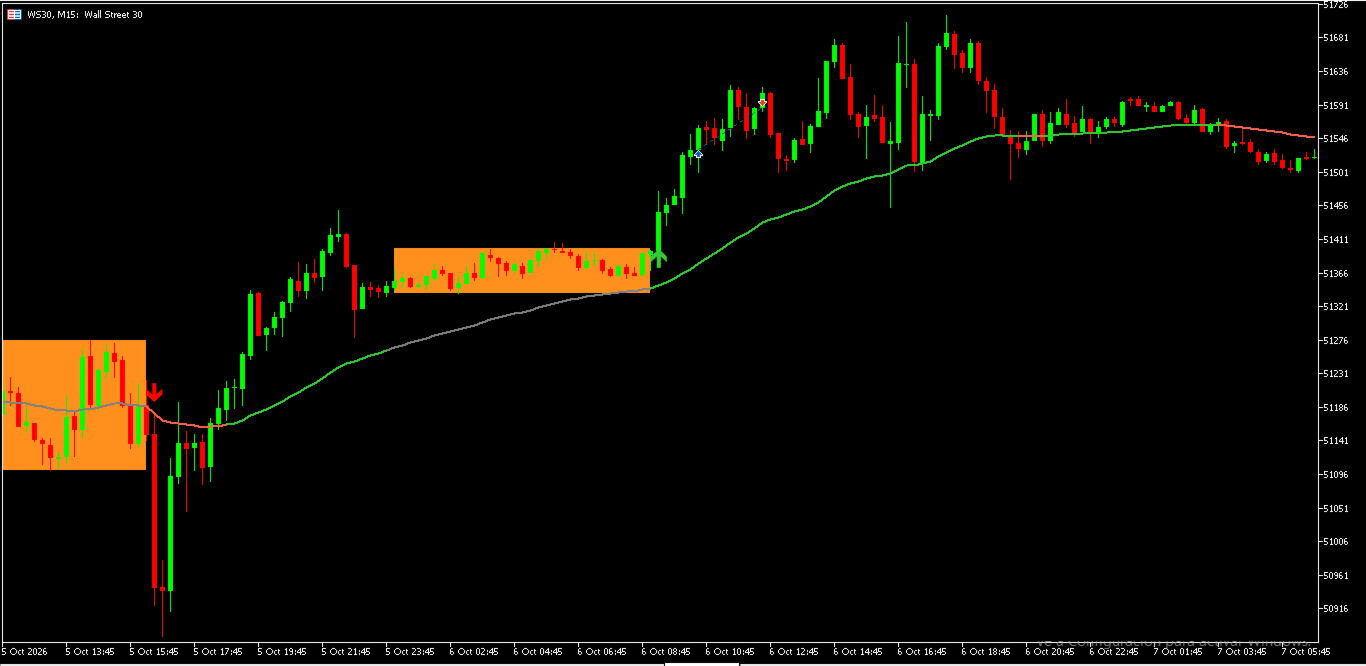
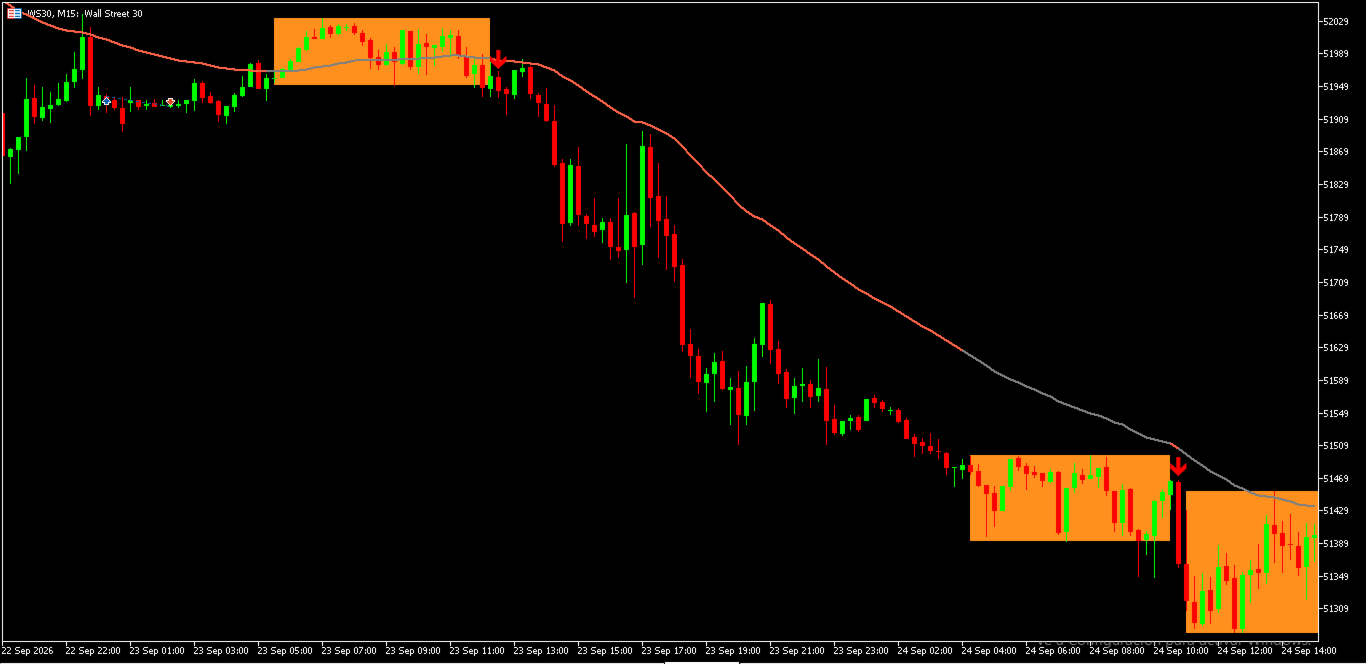
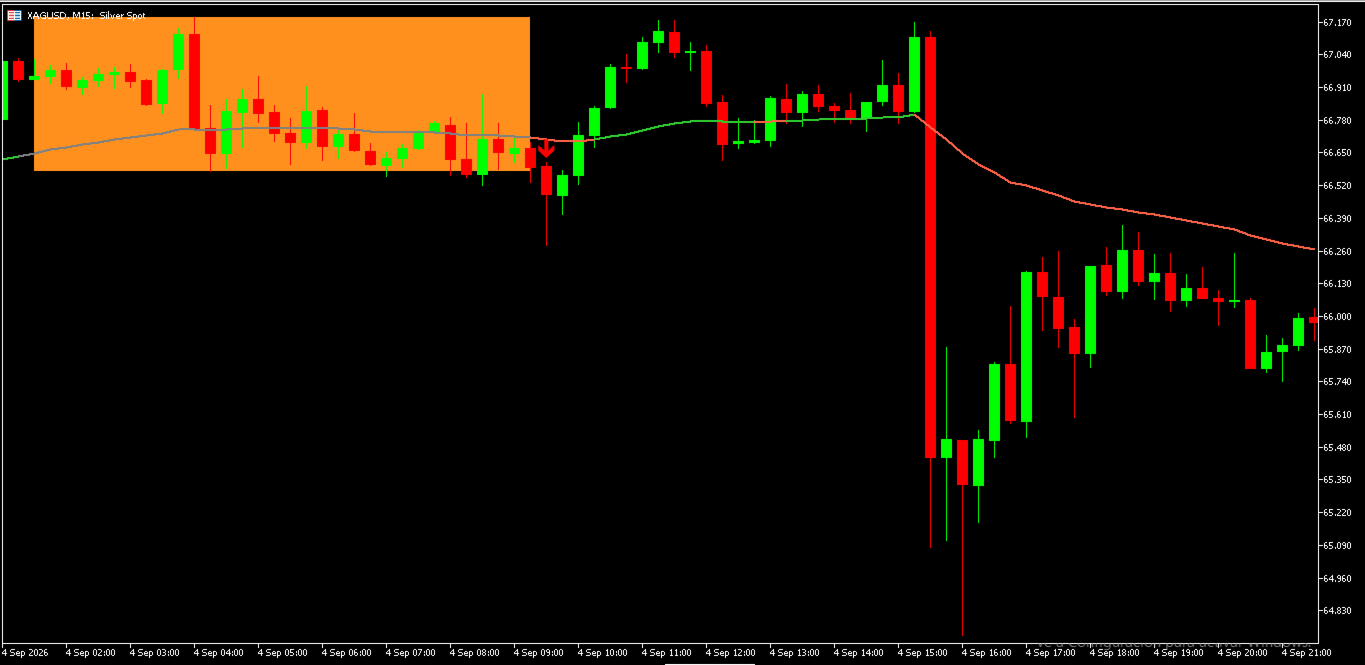
  • 횡보 구간 (박스): 가격이 좁은 범위 내에서 움직일 때, 지표는 캔들이 생성됨에 따라 오른쪽으로 확장되는 사각형을 그리며 구간이 끝날 때까지 유지됩니다.

  • 트렌드 라인: 이동평균선 기반의 라인으로 시장 상황에 따라 색상이 변경됩니다. 초록색 — 상승 트렌드, 빨간색 — 하락 트렌드, 회색 — 가격이 횡보 구간 내 위치.

  • 돌파 화살표: 캔들 종가가 횡보 구간 경계를 벗어나 마감되면 상향 화살표(매수/상승 돌파) 또는 하향 화살표(매도/하락 돌파)가 표시되고 사각형이 닫힙니다.

  • 알림 (Alert): 옵션 설정에 따라 돌파가 발생할 때마다 화면 팝업 알림 및 스마트폰 Push 알림을 받을 수 있습니다.

작동 원리 지정된 개수의 캔들(기본값 20개)의 최대 변동 폭이 ATR 기준 최대 높이(기본값 3.0 ATR) 이내에 수렴할 때 횡보 구간으로 인식합니다. 돌파는 캔들의 종가가 구간 경계선에 여유 버퍼(기본값 0.1 ATR)를 더한 값을 벗어나 마감(CLOSE)될 때만 최종 확정됩니다. 화살표는 이미 마감된 완성 봉을 기준으로 계산되므로, 캔들이 생성되는 동안 화살표가 생겼다 사라지는 리페인팅 현상이 없습니다.

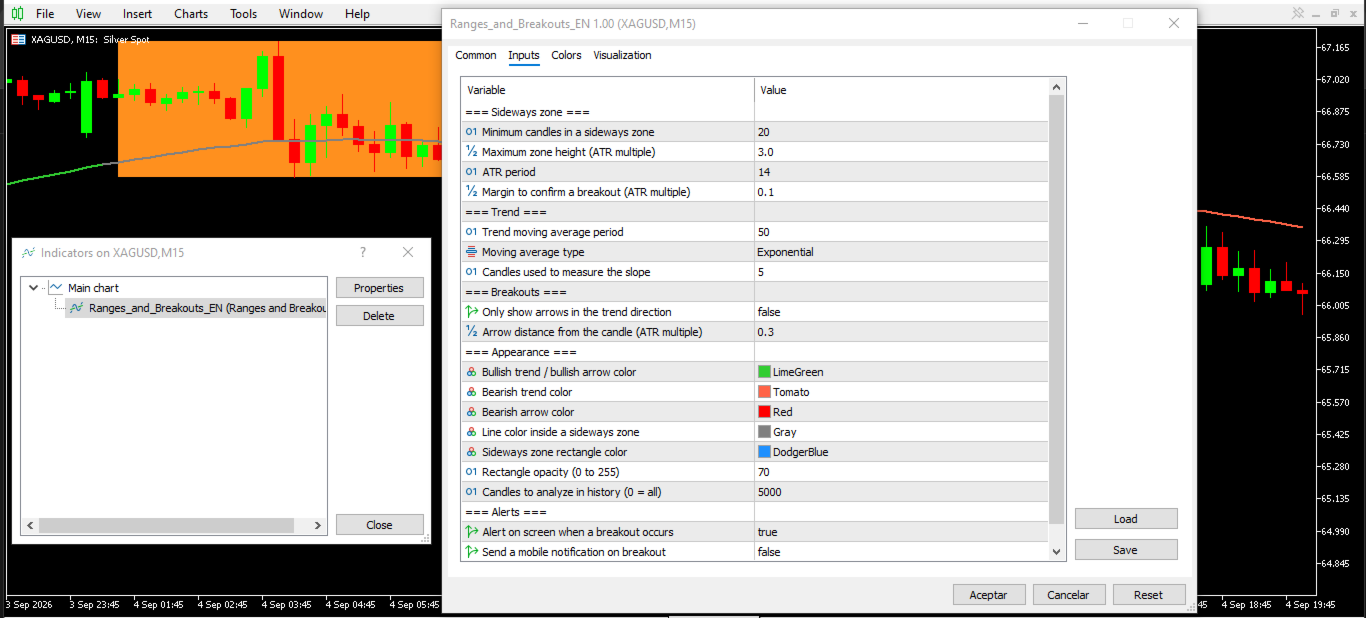
주요 매개변수 설정

  • RangeBars — 횡보 구간을 구성하는 최소 캔들 개수

  • RangeATRFactor — 횡보 구간의 최대 높이(ATR 단위). 값이 작을수록 좁은 구간, 클수록 넓은 구간 감지

  • BreakoutMarginATR — 돌파 확정을 위한 추가 버퍼 마진

  • TrendPeriod / TrendMethod / SlopeBars — 트렌드 라인 상세 설정

  • OnlyWithTrend — 주 트렌드 방향과 일치하는 돌파 화살표만 표시

  • 색상, 사각형 투명도, 캔들과 화살표 간격 및 분석 대상 캔들 수 설정

  • AlertOnScreen / AlertPush — 팝업 및 Push 알림 설정

개발자 안내 (EA / 스크립트 연동) EA(자동매매 프로그램)에서 iCustom 또는 CopyBuffer 함수를 사용하여 지표 버퍼 값을 직접 읽어올 수 있습니다:

  • 버퍼 0 (Buffer 0) — 트렌드 라인 값

  • 버퍼 1 (Buffer 1) — 트렌드 라인 색상 인덱스 (0 — 상승, 1 — 하락, 2 — 횡보)

  • 버퍼 2 (Buffer 2) — 매수(상승) 돌파 화살표

  • 버퍼 3 (Buffer 3) — 매도(하락) 돌파 화살표 화살표 버퍼에는 신호가 발생한 캔들의 화살표 표시 가격이 저장되며, 신호가 없는 일반 캔들에는 빈 값(EMPTY_VALUE )이 저장됩니다.

트레이더들이 이 지표를 사용하는 이유

  • 수동으로 박스를 그릴 필요 없이 횡보 구간을 한눈에 파악 가능

  • 모든 종목 및 모든 타임프레임에서 돌파 신호가 명확하게 표시됨

  • 기존 매매 전략, 오실레이터 지표 또는 거래량 지표와 쉽게 결합 가능

주의사항

  • 본 도구는 지표(Indicator)일 뿐이며, 자동으로 주문을 넣거나 포지션을 청산하지 않습니다.

  • MetaTrader 5 (MT5)의 모든 심볼(종목) 및 모든 타임프레임에서 작동합니다.

  • 과거의 수익이 미래의 수익을 보장하지 않습니다. 금융 거래에는 리스크가 따르므로 적절한 리스크 관리를 수행하고 실전 투입 전 데모 계좌에서 충분히 테스트하시기 바랍니다.
추천 제품
RBreaker
Zhong Long Wu
RBreaker Gold Indicators는 금 선물을 위한 단기 데이 트레이딩 전략으로, 추세 추종과 데이 내 반전의 두 가지 거래 방식을 결합합니다. 추세 장에서 수익을 포착할 수 있을 뿐만 아니라, 시장이 반전될 때 적시에 이익을 확정하고 추세에 맞춰 반대 포지션을 잡을 수 있습니다. 이 전략은 미국 잡지 Futures Truth에서 15년 연속으로 가장 수익성 높은 트레이딩 전략 상위 10위 안에 선정되었습니다. 긴 라이프사이클을 자랑하며, 현재까지 국내외에서 널리 사용되고 연구되고 있습니다. 본 지표는 2026년 금 선물의 움직임을 반영하여 14일 ATR 지표를 기반으로 돌파 계수 A, 관찰 계수 B, 반전 계수 R을 보다 합리적인 값으로 정의했습니다. 매우 훌륭한 지표이며, 안정적인 연간 수익성을 달성했습니다. 강력히 추천합니다~ 위 지표는 변동성이 높은 상품에 적합하며, 매개변수는 금 선물, 주가 지수 선물 등에 적합합니다. 다른 상품이 필요한 경우 돌파 계수 A
Fabii Half Trend Baseline
Fabien Georges Andre Guillemaud
상위 시간대 추세에 맞서는 거래를 멈추세요. 기준선 두 개, 차트 하나. 리페인트 없음. 모든 통화쌍, 모든 시간대. 2분 안에 차트에 적용. Strategy Tester에서 무료 데모를 사용해 볼 수 있습니다. Get more indicators here Baselines, volatility filters and oscillators. No repaint. 필요한 이유 차트의 선이 초록색으로 바뀌어서 진입합니다. 그런 다음 상위 시간대를 열어 보니 더 큰 추세는 반대 방향입니다. 신호는 진짜였습니다. 하지만 그 뒤의 추세는 당신 편이 아니었습니다. 더 큰 추세에 맞서는 거래는 그때마다 진입의 우위를 깎습니다. 제공하는 것 Fabii Half Trend Baseline은 현재 시간대의 추세와 상위 시간대의 추세를 한 차트에 보여 주므로, 창을 바꿔 가며 큰 그림을 확인할 필요가 없습니다. 상위 시간대의 두 번째 기준선이 메인 선 뒤에 그려져서, 다른 차트를 열지 않고도 더 큰
Trend Master V2
Oratile Pitsoane
What Is Trend Master Pro? Trend Master Pro   is a professional-grade trend trading indicator built for MetaTrader 5. It was designed with one goal in mind — to keep you on the right side of the market at all times by combining three powerful technical tools into a single, clean, easy-to-read display directly on your price chart. Instead of cluttering your screen with multiple separate indicators, Trend Master Pro fuses an   EMA Ribbon trend filter , a   ZigZag swing point engine , and a   breako
Structure King AI Signal
Shingala Gautamkumar
Structure King AI Signal Structure King AI Signal is a professional MetaTrader 5 trading indicator designed to help traders analyze market structure, trend direction, multi-timeframe confirmation and trade management from one clean dashboard. Key Features • Market Structure & Trend Analysis • BUY / SELL Signals • Multi-Timeframe (HTF) Confirmation • Entry Price Levels • Dynamic Stop Loss (SL) • TP1 / TP2 / TP3 Levels • ATR Volatility Analysis • ADX Trend Strength Filter • Adaptive Market Filter
Maximum Trend Arrows OT MT5
Mulweli Valdaz Makulana
STRICTLY FOR BOOM INDEX ONLY!!!!! Here I bring the Maximum Trend Arrows OT1.0 MT5 indicator. This indicator is made up of a combination of different trend indicators for entries and exits, for entries an orange arrow will paint on the chart below the current market and a red flag for closing of trades and it produces buy arrows only. When the orange arrow appears, it will appear along with it's sound to notify you. The 1H timeframe is recommended, don't use it anywhere else than on the 1H timefr
CosmiCLab FIBO
Kirils Subins
CosmiCLab SMC FIBO CosmiCLab SMC FIBO is a professional trading indicator designed for traders who use Smart Money Concepts (SMC), market structure analysis and Fibonacci retracement levels. The indicator automatically detects market swings and builds Fibonacci levels based on the latest impulse movement. It also identifies market structure changes such as BOS (Break of Structure) and CHOCH (Change of Character), helping traders understand the current market direction. CosmiCLab SMC FIBO also pr
Heiken_Ashi_Bars - MT5용 고급 추세 시각화 도구 개요 Heiken_Ashi_Bars 는 시장의 노이즈를 필터링하고 진정한 기본 추세를 강조하도록 설계된 강력하고 시각적으로 직관적인 사용자 지정 지표입니다. 기존의 캔들스틱 차트는 불규칙하여 거짓 신호와 섣불린 청산을 유발할 수 있습니다. 이 지표는 가격 데이터를 평균화하여 가격 움직임을 부드럽게 만들어 추세 지속, 반전 및 수익성 있는 진입 구간을 훨씬 쉽게 파악할 수 있도록 해줍니다. 주요 기능 및 장점 강력한 노이즈 감소: 사소한 가격 급등 및 횡보 노이즈를 필터링합니다. 명확한 시각적 신호: 색상으로 구분된 막대를 통해 강세 및 약세 모멘텀을 한눈에 파악할 수 있습니다. 리페인트 없음 (No Repaint): 막대가 마감되면 신호가 고정됩니다. 과거 막대를 다시 계산하지 않습니다. 고도로 최적화됨: 터미널 지연이 없도록 깔끔하게 코딩되었습니다. 다양한 활용: 모든 금융 상품(외환, 지수, 금속, 암호화폐)에서
Reversal Master for MT5
Alexey Minkov
5 (1)
Reversal Master for MT5 Reversal Master for MT5 is a non‑repainting reversal indicator for MetaTrader 5. It helps you detect potential market reversal points and shows the maximum favourable price movement after each historical signal, so you can better understand how price behaved after similar situations in the past. The MT5 version keeps the familiar reversal‑signal logic of the original Reversal Master for MT4, but adds improved visualisation, historical statistics and a points summary panel
Trade smarter, not harder: Empower your trading with Harmonacci Patterns This is arguably the most complete harmonic price formation auto-recognition indicator you can find for the MetaTrader Platform. It detects 19 different patterns, takes fibonacci projections as seriously as you do, displays the Potential Reversal Zone (PRZ) and finds suitable stop-loss and take-profit levels. [ Installation Guide | Update Guide | Troubleshooting | FAQ | All Products  ] It detects 19 different harmonic pric
PatternDetector
Thien Thanh Tran
PatternScope — Multi-Pattern Recognition for MT5 PatternScope is a multi-pattern recognition indicator for MetaTrader 5. It scans price action for classic chart patterns, confirms breakouts, and draws clear   Entry, Stop Loss and Take Profit   levels. A compact dashboard shows the latest pattern, bias and Risk:Reward. Patterns:   Double Top/Bottom, Triple Top/Bottom, Head and Shoulders (and inverted), Bullish & Bearish Flag, Pennant, Rising & Falling Wedge, Triangle, Rectangle, Cup and Handle —
NQX Smooth Trend Flip Weekly Bias은(는) MetaTrader 5용 시그널 인디케이터입니다: 평활 추세 전환 시그널(주간 바이어스 방향으로만 시그널을 냅니다). 상승·하락 이후 평활 캔들의 색 전환을 감지하는 NQX 독자 로직입니다. 주간 바이어스 방향으로만 시그널을 냅니다. 제안 진입가, 짧은 손절, 먼 목표가(3:1, 5:1, 10:1, 스윙에서는 최대 20:1)를 표시하며, 결정은 당신이 합니다. 차트에 표시되는 내용 - 확정된 시그널 캔들에 화살표 표시(확정된 시그널은 절대 리페인트되지 않습니다). - 제안 진입가, 짧은 손절, 먼 제안 목표가(기본값: 리스크의 6배), 그리고 3 x 1, 5 x 1, 10 x 1 참조선. - 레벨에 도달하면 차트에 라벨(목표가 또는 손절)이 표시됩니다. - 마지막 시그널과 표시된 히스토리에 나타난 시그널 수를 보여주는 패널. - 새 시그널 발생 시 팝업 및 푸시 알림(선택 사항). NQX 전용 로직: 다른 어떤 NQ
Noize Absorption Index
Ekaterina Saltykova
Noize Absorption Index - is the manual trading system that measures the difference of pressure between bears forces and bulls forces. Green line - is a noize free index that showing curent situation. Zero value of index shows totally choppy/flat market.Values above zero level shows how powerfull bullish wave is and values below zero measures bearish forces.Up arrow appears on bearish market when it's ready to reverse, dn arrow appears on weak bullish market, as a result of reverse expectation.
Has rsi signal
Evgenii Savinov
HAS RSI Signal — SL/TP 자동 계산 기능이 포함된 전문 트렌드 지표 HAS RSI Signal 은 검증된 클래식 지표와 현대적인 노이즈 필터링 알고리즘을 결합한 강력한 트레이딩 도구입니다. 이 지표는 Heiken Ashi Smoothed (HAS) 캔들과 RSI 오실레이터를 통해 시장을 분석하며, 추세 반전이나 과매수/과매도 구간 이탈 시 트레이더에게 명확한 진입 신호를 제공합니다. 주요 장점: 이중 필터링: Heiken Ashi Smoothed를 사용하여 시장의 '노이즈'를 제거하고, RSI를 통해 모멘텀의 강도를 확인합니다. 자동 레벨 계산: 단순히 신호만 주는 것이 아니라, 변동성( ATR )을 기반으로 최적의 손절매(Stop Loss) 및 이익 실현(Take Profit) 레벨을 자동으로 계산합니다. 시각적 편의성: 신호가 차트 위에 컬러 캔들 형태로 직접 표시되어 복잡하지 않고 직관적으로 추세를 파악할 수 있습니다. 알림 시스템: 터미널 알람, 사운드, 스마
Price Magnet — Price Density and Attraction Levels Indicator Price Magnet is a professional analytical tool designed to identify key support and resistance levels based on statistical Price Density. The indicator analyzes a specified historical period and detects price levels where the market spent the most time. These zones act as “magnets,” attracting price action or forming a structural base for potential reversals. Unlike traditional Volume Profile tools, Price Magnet focuses on price-time d
Terra Infinity
Ivan Simonika
Terra Infinity is a flat indicator. This improved version of the CalcFlat indicator has three additional lines that significantly increase its effectiveness. Unlike its predecessor with two static levels, Terra Infinity adds three dynamic lines above the main histogram, which are interpreted as follows: base signal line, minimum signal line, maximum signal line. These lines are formed using the additional parameter Avg, which is the average value of the histogram. Averaging produces a line cl
Premium level Pro
Dmitriy Kashevich
Premium level is a unique indicator with more than 80% accuracy of correct predictions! This indicator has been tested for more than two months by the best Trading Specialists! The author's indicator you will not find anywhere else! From the screenshots you can see for yourself the accuracy of this tool! 1 is great for trading binary options with an expiration time of 1 candle. 2 works on all currency pairs, stocks, commodities, cryptocurrencies Instructions: As soon as the red arrow app
Divergent Stochastic Filter II Catch Reversals Early, Filter Noise, Trade with Confidence The Edge: Why This Stochastic is Different  Every trader knows the Stochastic oscillator. But knowing when to trust its signals, that's the real challenge. The Divergent Stochastic Filter II transforms this classic indicator into a precision reversal detection system by adding critical elements: divergence intelligence, signal filtering and exhaustion detection.  While standard Stochastic oscillators fire s
Trend Monitor MT5
Pavel Zamoshnikov
4.5 (2)
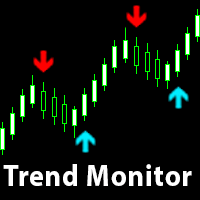
The indicator generates early signals basing on ADX reading data combined with elements of price patterns. Works on all symbols and timeframes. The indicator does not redraw its signals. You see the same things on history and in real time. For better visual perception signals are displayed as arrows (in order not to overload the chart). Features The best results are obtained when the indicator works on two timeframes. For example: M30 – the indicator shows the main trend; M5 – the indicator gen
Smart Support And Resistance Indicator See the Market Levels That Matter. Make your chart clearer and your technical analysis more organized with Smart Support And Resistance Indicator — a powerful trading tool designed to help traders identify important support and resistance levels directly on their MetaTrader 5 charts. Whether you trade Forex, Gold, Indices, or other available markets, this indicator helps you focus on key price areas, monitor potential market reactions, and analyze price act
NeuralTick의 CleanTrend — 과거를 절대 다시 그리지 않는(No Repaint) 추세 지표입니다. 역사적으로는 아름답게 보이지만 실제 거래에서는 신호를 다시 그리는 지표들에 지치셨나요? 소음과 속임수에 지친 트레이더들이 CleanTrend를 선택하는 세 가지 이유: 100% 다시 그리지 않음. 라인 색상이 영원히 고정됩니다. 어떤 바(bar)도 사후에 변경되지 않습니다 — 전략 테스터에서 직접 확인하세요. 이중 노이즈 필터. 가격이 설정된 임계값(MinMove)을 초과 하고 여러 바(ConfirmBars)에 걸쳐 방향을 유지한 경우에만 신호가 나타납니다. 횡보장에서의 「톱니」 현상과 이별하세요. 상황을 놓치지 않는 알림 시스템. 팝업 창, 소리, 저널 기록, 스마트폰으로의 푸시 알림(MetaTrader 5 앱). 터미널이 종료되어 있어도 추세 변화를 즉시 파악할 수 있습니다. CleanTrend는 차트를 패널로 어지럽히지 않습니다 — 깔끔한 컬러
TrendDetect
Pavel Gotkevitch
The Trend Detect indicator combines the features of both trend indicators and oscillators. This indicator is a convenient tool for detecting short-term market cycles and identifying overbought and oversold levels. A long position can be opened when the indicator starts leaving the oversold area and breaks the zero level from below. A short position can be opened when the indicator starts leaving the overbought area and breaks the zero level from above. An opposite signal of the indicator can b
SMC Indicator BOS And CHoCH
Massimiliano Tuzzolino
SMC Indicator BOS & CHoCH analyze market structure using Smart Money Concepts The indicator combines BOS (Break of Structure), CHoCH (Change of Character), Fair Value Gaps (FVG), Liquidity Sweep logic and ATR filtering to provide a structured view of market movements and potential trading opportunities. The indicator automatically identifies swing highs and swing lows and monitors structural breaks in the market. BOS (Break of Structure) identifies potential continuation of the current market st
# DRAWDOWN INDICATOR V4.0 - The Essential Tool to Master Your Trading ## Transform Your Trading with a Complete Real-Time Performance Overview In the demanding world of Forex and CFD trading, **knowing your real-time performance** isn't a luxury—it's an **absolute necessity**. The **Drawdown Indicator V4.0** is much more than a simple indicator: it's your **professional dashboard** that gives you a clear, precise, and instant view of your trading account status. --- ## Why This Indicator
TRI Visualizer
Yoshimi Mon 三 Ura
TRI Visualizer MT5 – Thermodynamic Market Analysis Overview The TRI (Thermal Range Indicator) Visualizer Enhanced is a rare market analysis indicator that goes beyond conventional technical analysis, applying principles of thermodynamics from physics. It interprets market price fluctuations as “thermodynamic energy,” enabling the highly accurate detection of subtle market changes that are often overlooked. Innovative Mechanisms 1. Dual Calculation Engines Classic TRI Mode Formula: |Close
Royal Aurum Confluence는 어디서 진입하고 청산할지, 금 가격이 실제로 어디까지 움직일 수 있을지 더 이상 추측에 의존하고 싶지 않은 트레이더를 위해 개발된 MetaTrader 5 지표입니다. 출시 가격: $49 . 구매 20건마다 가격이 $10씩 인상되며, 최종 가격인 $199 에 도달할 때까지 적용됩니다. 다음 가격: $59 . Royal Aurum Companion 이 추가 비용 없이 포함됩니다. Royal Aurum Confluence와 함께 사용하도록 설계된 수동 주문 실행 및 포지션 관리 보조 도구입니다. 구매 후 MQL5 받은편지함을 통해 메시지를 보내 주세요. Companion 파일과 전체 워크플로 자료(세트 파일 및 사용자 가이드)를 24시간 이내에 전달해 드립니다. 많은 트레이더가 XAUUSD에서 손실을 보는 이유는 추세를 읽지 못해서가 아닙니다. 신호가 나온 뒤의 모든 판단을 감에 맡기기 때문입니다. 손절선을 너무 가까이 또는 너무 멀리 설정하고,
Automated Trendlines MT5
Georgios Kalomoiropoulos
추세선은 외환 거래에서 기술적 분석의 가장 필수적인 도구입니다. 불행히도, 대부분의 거래자는 올바르게 그리지 않습니다. 자동 추세선 표시기는 시장의 추세 움직임을 시각화하는 데 도움이 되는 진지한 거래자를 위한 전문 도구입니다. 추세선 강세 추세선과 약세 추세선에는 두 가지 유형이 있습니다. 상승 추세에서 Forex 추세선은 가격 움직임의 가장 낮은 스윙 포인트를 통해 그려집니다. 최소 두 개의 "최저 저점"을 연결하면 추세선이 생성됩니다. 하락 추세에서 추세선은 가격 움직임의 가장 높은 스윙 포인트를 통해 그려집니다. 최소 두 개의 "최고 최고점"을 연결하면 추세선이 생성됩니다. 추세선이 깨질 때? 강세 추세선은 약세 양초가 강세 추세선 아래에서 닫히고 양초의 고점이 추세선 위에 있을 때 깨집니다. 약세 추세선은 강세 양초가 약세 추세선 위로 마감되고 양초 저점이 추세선 아래에 있을 때 깨집니다. 추세선이 삭제되면? 강세 추세선은 전체 양초가 강세 추세선 아래에
ATrend
Zaha Feiz
4.63 (19)
ATREND: 작동 방식 및 사용 방법 ### 작동 방식 MT5 플랫폼을 위한 "ATREND" 지표는 기술 분석 방법론의 조합을 활용하여 트레이더에게 강력한 매수 및 매도 신호를 제공하도록 설계되었습니다. 이 지표는 주로 변동성 측정을 위해 평균 진폭 범위(ATR)를 활용하며, 잠재적인 시장 움직임을 식별하기 위한 트렌드 탐지 알고리즘과 함께 사용됩니다. 구매 후 메시지를 남기면 특별 보너스 선물을 받게 됩니다. ### 주요 특징: - 동적 트렌드 탐지: 이 지표는 시장 트렌드를 평가하고 신호를 조정하여 트레이더가 현재 시장 상황에 맞춰 전략을 조정할 수 있도록 돕습니다. - 변동성 측정: ATR을 사용하여 시장의 변동성을 측정하며, 이는 최적의 손절매(SL) 및 이익 실현(TP) 수준을 결정하는 데 중요합니다. - 신호 시각화: 이 지표는 차트에 매수 및 매도 신호를 시각적으로 표시하여 트레이더의 의사 결정을 향상시킵니다. ### 운영 단계 #### 입력 및 설정 - TimeFr
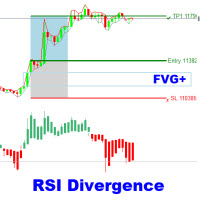
The RSI Divergence + FVG Signal indicator combines Relative Strength Index (RSI) Divergence with Fair Value Gap (FVG) detection to generate high-probability buy and sell signals based on both momentum shifts and institutional imbalance zones. Core Features: RSI Divergence Detection : Identifies both regular and hidden bullish/bearish divergences between price and RSI. Divergences indicate potential trend reversals or continuation. FVG Zone Recognition : Detects Fair Value Gaps (imbalances caused
"Impulses and Corrections 5" is created to help traders navigate the market situation. The indicator shows multi-time frame upward and downward "Impulses" of price movements. These impulses are the basis for determining the "Base" , which is composed of zones of corrections of price movements, as well as "Potential" zones for possible scenarios of price movement. Up and down impulses are determined based on a modified formula of Bill Williams' "Fractals" indicator. The last impulse is always "U
##   ONLY GOLD ##   Тiльки Золото ## **Mercaria Professional Trading Zones - Complete Guide** ## **Mercaria Professional Trading Zones - Повний посібник** ### **How Mercaria Zones Work / Як працюють зони Mercaria** **English:** Mercaria Zones is an advanced trading indicator that identifies high-probability support and resistance areas using ZigZag extremes combined with mathematical zone calculations. The indicator works on multiple timeframes simultaneously, providing a comprehensive view
이 제품의 구매자들이 또한 구매함
Boba Analysis Suite
Trade Ready Solutions LLC
5 (2)
Boba Analysis Suite Boba Analysis Suite는 MetaTrader 5용 분석 지표입니다. 시장 구조, 주요 가격 영역, 전반적인 시장 상황을 하나의 차트 화면에 통합하여 표시합니다. 트레이더이자 트레이딩 코치로서의 실무 경험을 바탕으로 개발되었으며, 시장 방향 평가, 주요 가격 수준 식별, 여러 시간대의 종합적인 분석 등 체계적인 분석 과정을 지원합니다. 시장 맥락을 고려한 분석 개별 신호의 의미는 시장 상황에 따라 달라집니다. Boba Analysis Suite는 현재 차트 상황을 더 넓은 시장 구조와 연결하고, 사전에 정한 규칙에 따라 매매 아이디어를 검토할 수 있도록 돕습니다. 주요 분석 기능은 다음과 같습니다. 추세 및 시장 구조: 시장 방향과 관련 구조적 맥락을 평가합니다. 주요 가격 영역 및 수준: 추가 분석이 필요한 중요한 영역을 차트에 시각적으로 표시합니다. 여러 시간대: 서로 다른 시간대의 정보를 통합하여 전반적인 시장 상황을 평가합니다.
ScalpPoint
Temirlan Kdyrkhan
ScalpPoint is a powerful trading companion designed to generate high-probability entry signals with dynamic TP/SL/DP levels based on volatility. Built-in performance tracking shows win/loss stats, PP1/PP2 hits, and success rates — all updated live. Key Features: Buy/Sell signals with adaptive volatility bands Real-time TP/SL/DP levels based on ATR Built-in MA Filter with optional ATR/StdDev volatility Performance stats panel (Success, Profit/Loss, PP1/PP2) Alerts via popup, sound, push, or emai
ARICoins
Temirlan Kdyrkhan
ARICoin is a powerful trading companion designed to generate high-probability entry signals with dynamic TP/SL/DP levels based on volatility. Built-in performance tracking shows win/loss stats, PP1/PP2 hits, and success rates all updated live. Key Features: Buy/Sell signals with adaptive volatility bands Real-time TP/SL/DP levels based on ATR Built-in MA Filter with optional ATR/StdDev volatility Performance stats panel (Success, Profit/Loss, PP1/PP2) Alerts via popup, sound, push, or email Cust
Azimuth Pro
Ottaviano De Cicco
5 (7)
Azimuth Pro V2: Synthetic Fractal Structure and Confirmed Entries for MT5 Overview Azimuth Pro is a multi-level swing structure indicator by Merkava Labs . Four nested swing layers, swing-anchored VWAP, ABC pattern detection, three-timeframe structural filtering, and closed-bar confirmed entries — one chart, one workflow from micro-swings to macro-cycles. This is not a blind signal product. It is a structure-first workflow for traders who care about location, context, and timing. Halloween P
Neuro Poseidon MT5
Daria Rezueva
4.68 (53)
Neuro Poseidon is a new indicator by Daria Rezueva. It combines precise trading signals with adaptive TP/SL levels - creating best possible trades as a result! Message me and get  Neuro Poseidon Assistant  as a gift to automize your trading process! What makes it stand out? 1. Proven profitability on all assets and timeframes 2. Only confirmed BUY and SELL signals present on the chart 3. Adaptive TP & SL levels generated by the software for each trade 4. Easy to understand - suitable for al
AriFocus
Temirlan Kdyrkhan
AriFocus - Non-Repainting Buy/Sell Signals AriFocus - one clear signal. AriFocus marks buy and sell signals directly on the chart and suggests a stop-loss level for each one. Every signal is confirmed on bar close and never repaints. - Buy/sell arrows, confirmed on bar close - Suggested stop-loss level for every signal - Trend band and candle coloring to show direction at a glance - 10 ready-made presets, or your own settings (14 calculation methods) - Pop-up, push and email alerts with entr
UZFX {SSS} 스캘핑 스마트 시그널 v5.0 MT5는 급변하는 시장에서 정확한 실시간 시그널을 필요로 하는 스캘퍼, 데이 트레이더, 스윙 트레이더를 위해 설계된 리페인팅이 없는 고성능 트레이딩 지표입니다. (UZFX-LABS)에서 개발한 이 지표는 가격 움직임 분석, 추세 확인 및 스마트 필터링을 결합하여 모든 통화 쌍과 시간대에서 높은 확률의 매수 및 매도 신호, 경고 신호, 추세 지속 기회를 생성합니다. 거래에 대한 망설임을 멈추고, 명확성, 정밀성, 그리고 규율 있는 시장 실행을 원하는 트레이더를 위해 설계된 체계적인 신호 시스템을 따르기 시작하세요. 제 말을 믿으세요. 이 지표는 MQL5에서 구할 수 있는 최고의 지표 중 하나입니다. 그러니 절대 놓치지 마세요!! “현명한 트레이더를 위한 스마트 신호” 지금 최신 버전 5.0이 출시되었으며, 사전 공지 없이 가격이 최대 $499.99까지 인상될 수 있으니 기회를 놓치기 전에 서둘러 구매하세요!! 최종 구매 전! 무료 체
ARIPoint
Temirlan Kdyrkhan
1 (4)
ARIPoint is a powerful trading companion designed to generate high-probability entry signals with dynamic TP/SL/DP levels based on volatility. Built-in performance tracking shows win/loss stats, PP1/PP2 hits, and success rates all updated live. Key Features: Buy/Sell signals with adaptive volatility bands Real-time TP/SL/DP levels based on ATR Built-in MA Filter with optional ATR/StdDev volatility Performance stats panel (Success, Profit/Loss, PP1/PP2) Alerts via popup, sound, push, or email Cu
안녕하세요, 트레이더 여러분! 많은 개인 투자자들이 느린 웹 스크립트에 의존하고 있습니다. 수익성 있는 거래를 위해서는 체계적인 프레임워크가 필수적입니다. Astro AI 지표는 단순한 차트 오버레이가 아닙니다. 터미널에서 직접 실행되는 두 개의 에이전트로 구성된 정교한 신경망입니다. 시스템 기술 상세 설명: 1. 에이전트 1: 분석가 (그래픽 신경망 – GNN) 시장은 개별 가격 막대로 이루어진 것이 아니라 상호 연결된 데이터 네트워크입니다. 기능: 에이전트 1은 그래픽 신경망을 사용하여 이러한 복잡하고 비선형적인 관계를 파악합니다. 장점: 기존 지표는 과거 이동 평균만을 고려하는 반면, 저희 GNN은 시장의 심층적인 구조적 관계를 실시간으로 처리하여 개별 트레이더의 거래량이 시장에 큰 영향을 미치기 전에 숨겨진 상관관계를 찾아냅니다. 2. 에이전트 2: 실행기 (근접 전략 최적화 – PPO) 패턴 인식은 절반의 성공일 뿐입니다. 현재 시장 변동에 기반하여 올바른
CGE Trading Suite
Carl Gustav Johan Ekstrom
5 (3)
Institutional-Grade Analytics for MT5 The full analytical edge of a professional trading desk, built into your MT5 chart. A full guided tour walks you through every feature step by step. Standard retail platforms lack the depth required for professional market analysis. The CGE Trading Suite bridges this gap, transforming MetaTrader 5 into a comprehensive workspace. By integrating 18 proprietary modules into a single, unified chart interface, the suite eliminates fragmented analysis. It provide
Zain Gold Scalping
Ahmed Gamal Abdel Nasser Mohamed
A complete price-action analysis tool built around dual independent entry logic, each confirmed against a volatility band, combined with a configurable set of nine optional confirmation filters that let you shape exactly how conservative or aggressive the tool's signals behave. Core Strategy Two independent entry setups, each triggering only when price moves outside a dynamic volatility band — giving two distinct ways to spot potential reversal points, which can be used together or separately.
OmniSync Projection
Antonio-alin Teculescu
5 (1)
Chronos Fractal Engine is an innovative price projection indicator for MetaTrader 5, designed to transform your technical analysis by intelligently identifying and projecting historical price patterns. Built upon an advanced correlation algorithm and the fractal principles of the market, this powerful tool visualizes potential future price movements, giving you a unique edge in your trading decisions. What is Chronos Fractal Engine? At its core, the Chronos Fractal Engine employs a sophisticat
Matreshka
Dimitr Trifonov
5 (2)
Matreshka self-testing and self-optimizing indicator: 1. Is an interpretation of the Elliott Wave Analysis Theory. 2. Based on the principle of the indicator type ZigZag, and the waves are based on the principle of interpretation of the theory of DeMark. 3. Filters waves in length and height. 4. Draws up to six levels of ZigZag at the same time, tracking waves of different orders. 5. Marks Pulsed and Recoil Waves. 6. Draws arrows to open positions 7. Draws three channels. 8. Notes support and re
Gem SIGNAL
Shengzu Zhong
5 (1)
GEM Signal Pro GEM Signal Pro는 MetaTrader 5용 추세추종형 지표로, 차트에서 더 명확한 신호, 더 구조적인 트레이드 설정, 그리고 더 실용적인 리스크 관리를 원하는 트레이더를 위해 설계되었습니다. 단순한 화살표만 표시하는 것이 아니라, GEM Signal Pro는 전체 트레이드 아이디어를 더 깔끔하고 읽기 쉬운 방식으로 보여줍니다. 조건이 확인되면 진입가, 손절가, 목표가를 차트에 표시하여 트레이더가 설정을 더 효율적으로 검토할 수 있도록 도와줍니다. 작동 방식 이 지표는 먼저 내부 로직에 따라 유효한 초기 신호를 식별합니다. 확인 조건이 충족되면, GEM Signal Pro는 차트에 전체 설정을 표시합니다. 이를 통해 트레이더는 거래 구조를 더 명확하게 보고, 수동 분석 작업을 줄일 수 있습니다. 차트에 표시되는 거래 레벨 확인된 신호에 대해, GEM Signal Pro는 다음을 표시할 수 있습니다. 진입가 손절가 목표가 1 목표가 2 목표가 3 손
Ace Trend
Mikhail Sergeev
5 (3)
우리는 당신에게 트렌드 거래의 세계에서 게임의 규칙을 변경하는 혁신적인 지표를 제시한다. 이 표시기는 성능을 재고하고 거래 경험을 전례없는 높이로 높이도록 설계되었습니다. 우리의 표시기는 경쟁 업체와 차별화 된 고급 기능의 고유 한 조합을 자랑합니다. "실제 가격 요인"의 첨단 기술은 가장 어렵고 휘발성 시장 상황에서도 탁월한 안정성을 보장합니다. 불안정한 패턴,깨진 지표 및 의식적이고 통제 된 거래에 작별 인사를하십시오. 표시기는 단지 아름다운 그림이 아닙니다! 지표는 거래자의 편으로 확률을 이동시켜 이익을 얻어야 합니다. 표시 신호(완전 자동 모드)에 따라 거래 결과에 익숙해: https://www.mql5.com/ko/signals/2339244 표시기는 형성된 막대에 다시 그리지 않습니다. 막대가 형성된 경우 표시기 판독 값은 변경되지 않습니다. 이 표시기는 모든 시간대에 작동합니다. 표준은 시간대입니다. 귀하의 의견은 매우 중요합니다! 당신은 어떤 질문,제안이,또는 당신의
RelicusRoad Pro MT5
Relicus LLC
4.96 (25)
거래를 더 이상 감으로 하지 마세요. 언제 진입할지, 어디서 청산할지, 시장이 어느 쪽으로 기울어 있는지를 한 차트에서 확인하세요. RelicusRoad Pro는 20개 가까운 도구를 인디케이터 하나에 담았고, 내 매매 방식에 맞는 도구만 켜서 쓰면 됩니다. 명확한 진입. 명확한 청산. 차트마다 확실한 계획. 이런 경험, 익숙하지 않으신가요? 매수하면 1분 뒤 가격이 반대로 돌아섭니다. 너무 일찍 청산하고, 그다음 움직임이 나 없이 이어지는 것을 지켜봅니다. 지표를 5개 띄우면 답도 5가지가 나옵니다. 손절(스톱로스)은 그냥 감입니다. 우리가 이걸 만든 이유 우리는 18년 동안 외환 거래를 해 왔습니다. RelicusRoad는 처음에 우리끼리 쓰려고, 전문 트레이더 모임을 위해 비공개로 만들었습니다. 이유는 개인적이었습니다. 같은 선을 손으로 계속 그리는 일에 지쳤고, 스스로 정한 규칙을 어기고, 차트에서 정말 중요한 한 가지를 놓치곤 했습니다. 우리에게 통한 것은 일관성입니다. 매
Chimera Volume
Marko Milenkovic
MetaTrader 5용 Chimera Volume 고급 거래량 분석 및 시장 활동 시각화 Chimera Volume은 MetaTrader 5 전용 사용자 정의 지표로, 정규화된 거래량 활동을 분석하고 역동적인 시각적 프레임워크를 통해 시장 참여도의 변화를 보여주도록 설계되었습니다. 이 지표는 적응형 정규화 알고리즘을 사용하여 틱 거래량 데이터를 처리하며, 다양한 시장 상황 속에서 거래량의 강도, 매집 단계, 활동 변화를 구조화된 형태로 생성합니다. 원시 거래량 값을 표시하는 일반 거래량 지표와 달리, Chimera Volume은 추가 계산을 적용하여 시장 활동의 상대적 변화를 강조하고 차트의 가독성을 향상시킵니다. 주요 기능 루트 인텐트 히스토그램 (Root Intent Histogram): 정규화된 거래량 강도와 시장 참여도를 시각화하는 동적 히스토그램입니다. 적응형 색상 전환을 사용하여 활동 증가 시기와 참여 감소 시기를 명확하게 구분합니다. 관성 라인 (Inertia Line
Orderflow Big Trade 추정 델타 히트맵으로 캔들 내부에 숨겨진 매수·매도 압력 포착 일반 캔들 차트 내부 에서 일어나는 결정적인 거래 활동을 놓치고 계신가요? Orderflow Big Trade 는 고도화된 변동폭 및 종가 가중치 알고리즘을 사용하여 그룹화된 가격대별 매수 및 매도 압력을 추정합니다. 단순 거래량에만 의존하는 대신, 프라이스 액션 동역학을 명확한 시각적 델타 맵으로 변환하여 기관의 물량 흡수(Absorption), 모멘텀 돌파, 갇힌 트레이더(Trapped Traders), 그리고 주요 구간의 수용 및 거절을 즉각 식별할 수 있도록 돕습니다. [ 무료 데모 버전 다운로드 ] 지금 바로 실제 차트에서 모든 기능을 테스트해보세요. 구매 전 설정 변경, 시각적 명확성 확인, 본인의 매매 전략과의 적합성을 부담 없이 경험하실 수 있습니다. 트레이딩 핵심 강점 캔들 내부 델타 추정: 캔들의 고저 범위와 종가 위치를 분석하여 특정 가격 클러스터
TrendMaestro5
Stefano Frisetti
note: this indicator is for METATRADER4, if you want the version for METATRADER5 this is the link:  https://www.mql5.com/it/market/product/108106 TRENDMAESTRO ver 2.5 TRENDMAESTRO recognizes a new TREND from the start, he never makes mistakes. The certainty of identifying a new TREND is priceless. DESCRIPTION TRENDMAESTRO identifies a new TREND in the bud, this indicator examines the volatility, volumes and momentum to identify the moment in which there is an explosion of one or more of these da
Have you ever wondered why most systems are not effective in live trading? My answer is that it's all the fault of the so-called "Smart Money" or the institutional ones,, they constantly create spikes first up then down and vice versa to screw all the retail investors by tearing away their capital, confusing them and making the markets move randomly without any rules. But in all this there is a famous strategy, which in 2009 won the world championship, exploiting and rowing against the instituti
Quantum Momentum Guard (QMG) Breakout and Momentum Indicator for MetaTrader 5 Overview Quantum Momentum Guard (QMG) is a technical indicator for MetaTrader 5 designed to identify potential breakout opportunities by combining momentum analysis, breakout conditions, and mathematical validation. The indicator evaluates market conditions to generate directional signals when its configured criteria are met. It is designed primarily for XAUUSD (Gold) and can also be used on other financial instruments
Title:FX-AIEA Supply and Demand Zone Indicator (MT5) — Technical Overview Version: 2.51 | Platform: MetaTrader 5 Introduction Supply and demand zones are considered a core manifestation of institutional order flow, providing a more direct reflection of buying and selling pressure than traditional support/resistance levels. This indicator attempts to automate the identification of high-probability supply and demand zones using an adaptive ZigZag algorithm, reducing the subjectivity and time asso
ORB Seeker MT5
Marcela Goncalves De Oliveira
한정 수량 판매 및 제품 희소성 유지를 위한 특별 가격입니다! 단돈 599달러! 구매 후 저에게 연락 주시면 보너스 ORB Seeker EA와 개인 최적화 설정 파일을 보내드립니다. 깔끔한 세션 브레이크아웃을 자신감 있게 활용하세요! ORB Seeker MT5는 정확성, 단순성, 유연성 및 명확한 차트 구조를 원하는 트레이더를 위해 개발된 전문적인 시가 범위 돌파(ORB) 지표입니다. 이 프로그램은 모든 금융 상품에 대해 장전 거래 또는 사용자 지정 세션 범위를 자동으로 표시하고, 진입, 손절매, 목표 수익 및 선택적으로 50% 부분 목표 수익 수준을 포함한 명확한 돌파 신호를 제공합니다. 모든 계산은 실시간으로 차트에 직접 표시됩니다. 런던 개장, 뉴욕 세션, 아시아 세션 또는 사용자 지정 시장 시간대를 선택하여 거래하세요. ORB Seeker MT5는 사용자가 선택한 세션 시간에 맞춰 작동하므로 시장 범위, 돌파 레벨 및 거래 레벨을 정확하게 확인할 수 있습니다. 모든 구매
OrderFlow Absorption – MT5용 전문 델타 & 흡수 신호 인디케이터 OrderFlow Absorption으로 진정한 오더플로우 분석의 힘을 경험하세요. MetaTrader 5를 위한 궁극의 델타 히스토그램 및 흡수 신호 인디케이터입니다. 가격 움직임의 이면에서 실제로 무슨 일이 일어나는지 알고 싶은 트레이더를 위해 설계된 이 도구는, 시장을 움직이는 숨겨진 매수/매도 압력과 흡수 이벤트를 드러냅니다. 주요 기능 델타 히스토그램 시각화:   매수와 매도 압력을 색상별 히스토그램으로 즉시 확인할 수 있습니다. 흡수 신호 감지:   고급 로직으로 강세 및 약세 흡수 이벤트를 식별하여 반전 신호를 미리 알려줍니다. 차트 마커:   흡수 신호가 차트에 직접 표시되어 시각적으로 쉽게 확인할 수 있습니다. 팝업 알림:   새로운 흡수 신호가 발생하면 실시간으로 알림을 받을 수 있습니다. 사용자 지정 임계값:   약한 신호는 필터링하고, 확률이 높은 기회에 집중할 수 있습니다.
Zain Gold ScalpingV5
Ahmed Gamal Abdel Nasser Mohamed
Zain Gold Scalping V5 is a technical analysis indicator for MetaTrader 5 designed for Forex and Gold markets. It provides chart-based market information, trend analysis, signal conditions, and an on-screen dashboard to help traders analyze price movement across multiple timeframes. Main Features The indicator supports multiple timeframes, including M1, M5, M15, M30, H1 and higher timeframes. It can be used with Gold (XAUUSD), Forex currency pairs, indices and other supported instruments. The in
IQ FX Gann Levels a precision trading indicator based on W.D. Gann’s square root methods . It plots real-time, non-repainting support and resistance levels to help traders confidently spot intraday and scalping opportunities with high accuracy. William Delbert Gann (W.D. Gann) was an exceptional market analyst, whose trading technique was based on a complex blend of mathematics, geometry, astrology, and ancient mathematics which proved to be extremely accurate. We don't offer free or bonus indic
The indicator is designed to close positions on the market in time. For example: to take profits ahead of schedule if the price has not reached TakeProfit, and the market is turning around. The indicator analyzes the momentum, not the trend. He does not give any information about the trend. The indicator is well suited for finding divergence. The Ershov 38 Parrots indicator dynamically adjusts to the market and detects price movement impulses of medium and high amplitude. It almost does not rea
First time on MetaTrader, introducing IQ Star Lines, an original Vedic Astrology Based Intraday Trading Indicator. We don't offer free or bonus indicators in exchange of reviews from you. You won't need any free products with this indicator to make it work. ;) Enjoy! Welcome to the new and updated  IQ Star Lines , the ultimate fusion of ancient planetary cycles and modern quantitative trading, published for the first time on Metatrader. This is an indicator built by the developer, who has spent
VTrende Pro
Andrii Diachenko
5 (1)
VTrende Pro - MTF indicator for trend trading with a display panel for MT5 *** Videos can be translated into any language using subtitles (video language - Russian) Although the signals of the VTrende Pro indicator can be used as signals of a full-fledged trading system, it is recommended to use them in conjunction with the Bill Williams TS. VTrende Pro is an extended version of the VTrende indicator. Difference between Pro version and VTrende: - Time zones - Signal V - signal 1-2 waves -    S
Spike Fakeout Detector
Brighton Mufaro Mudzingwa
PainX 400 FAKEOUT DETECTOR MT5 Custom Indicator  ·  Sell-Side Bias  ·  Scalping  ·  RSI(6) Filtered   OVERVIEW   The Spike Fakeout Detector is a non repaint precision technical indicator built exclusively for Crash / PainX synthetic indices on the platform. It is engineered around one of the most consistent and exploitable patterns on this instrument — the false breakout above resistance followed by a sharp price drop. Crash/PainX is a growing index that produces a significant price drop appr
제작자의 제품 더 보기
Volume Profile Multiple — 알고리즘 트레이딩을 위한 버퍼 지원 다중 블록 볼륨 프로파일 타임프레임을 바꿀 때마다 볼륨 프로파일을 블록별로 다시 그리고 재계산하는 데 지치셨나요? Volume Profile Multiple 은 차트에 여러 개의 연속된 볼륨 프로파일을 자동으로 그려주어, 마지막으로 표시된 구간뿐만 아니라 시장의 각 구간에서 기관의 관심이 실제로 어디에 있었는지를 보여줍니다. 이 지표가 하는 일 이 지표는 가격 히스토리를 N개의 캔들 단위로 블록화합니다(블록 개수와 블록당 캔들 수는 자유롭게 설정 가능). 각 블록마다 완전한 볼륨 프로파일을 계산합니다: 컨트롤 포인트(POC), 밸류 에어리어 상단/하단(VAH/VAL), 그리고 고거래량 구간과 저거래량 구간(HVN/LVN)입니다. 그 결과 블록별 시장 구조를 시각화한 지도가 만들어지며, 이를 통해 실제 거래량 기반의 매집 구간, 지지/저항, 그리고 밸류 에어리어 간 가격 순환을 파악할 수 있습니다. 알고
Navigator Equilibrium: 시장 국면, 모멘텀, 피크, 다이버전스를 하나의 창에서 모멘텀 오실레이터, 추세 필터, 변동성 지표, 다이버전스 스캐너를 오가며 확인할 필요가 없습니다. Navigator Equilibrium은 이 모두를 색상으로 구분되는 하나의 창에 담았습니다. 모멘텀이 강해지는지 약해지는지, 누가 주도권을 쥐고 있는지, 시장이 추세 중인지 횡보 중인지, 그리고 가격과 모멘텀이 어디서 엇갈리는지를 한눈에 확인할 수 있습니다. 시장을 명확하게 읽고 싶은 재량 트레이더와, 깔끔하고 문서화된 버퍼가 필요한 EA 개발자를 위해 만들었습니다. 차별점 상승 또는 하락만 보여 주는 것이 아닌, 다섯 가지 상태의 히스토그램. 방향뿐 아니라 모멘텀이 강해지는지, 약해지는지, 과도하게 늘어난 피크 상태인지를 색상으로 보여 줍니다. 시장 상태를 알려 주는 제로 라인. 색이 바뀌면서 시장이 추세 중인지 횡보 중인지 알려 줍니다. "누가 주도하는가"를 한눈에. 히스토그램 막대 위
Kaizen Trader
Carlos Dante Diaz
Kaizen Trader — 일관성이 운을 이깁니다 계획 없이 충동적으로 매매하다가 매번 시장에게 지는 것에 지치셨나요? Kaizen Trader는 단순한 아이디어에서 출발했습니다. 피로나 충동 없이, 매 거래마다 동일한 리스크 관리 규칙을 따르는 자동화 시스템 — 이는 어떤 트레이더도 수동으로는 매일 유지할 수 없는 것입니다. Kaizen Trader는 MetaTrader 5용 Expert Advisor(EA)로, 주가지수와 금을 M15 시간대에서 거래 하도록 설계되었습니다 (나스닥, S&P 500, 다우존스, 닛케이 225*, XAUUSD 등). 차별점: 공허한 약속이 아닌, 진짜 리스크 관리 모든 거래는 사용자가 설정한 계좌 잔고 대비 리스크 비율 에 따라 거래 수량을 자동으로 계산합니다 — 무작위 고정 랏이 아닙니다 — 또한 해당 종목의 최근 변동성에도 맞춰 조정됩니다. 계좌의 성과는 단 한 번의 거래 결과나, 사용자가 적절한 순간에 화면을 지켜보고 있는지에 좌우되지 않습니
Streak Trader Pro
Carlos Dante Diaz
과도한 리스크나 원금 손실 없이 자산을 빠르게 증식하는 방법 Streak Trader Pro · 제품 설명 고정 리스크 관리를 사용하는 모든 트레이더는 이 느낌을 알고 있습니다. 손실을 복구하고 다시 수익을 내기 시작해도... 아무 일도 없었다는 듯 이전과 정확히 동일한 리스크만 계속 떠안게 됩니다. Streak Trader Pro 는 이러한 로지증을 완전히 바꿉니다. 거래당 위험을 완벽하게 통제하면서 계좌의 회복 구간을 자동으로 수익화합니다. 그 결과, 설정한 승수(Multiplier)와 한도(Cap)로 거래당 리스크 상한을 유지하면서 자산(Equity) 곡선을 한층 빠르게 성장시킬 수 있습니다 (단, 프로그래션 진행 중에는 약간의 드로다운이 더 발생할 수 있습니다). 항상 최신 버전을 다운로드하여 사용하세요. 업데이트에는 기능 개선 및 버그 수정이 포함되어 있습니다 (예: 최신 버전에서는 전체 파라미터 최적화 속도가 훨씬 빠릅니다). 최적화나 실전 매매를 진행하기
Vector Trend EA
Carlos Dante Diaz
Vector Trend EA 추세를 따라 거래하고, 시장이 유리할 때만 노출을 늘립니다 손실이 나고 있을 때 오히려 리스크를 늘리는 EA에 지치셨나요? Vector Trend EA는 정반대로 작동합니다. 항상 통제된 기본 리스크로 거래하며, 수익을 낸 후에만 투입 규모를 늘립니다. 그것도 짧은 주기 안에서, 명확한 상한선을 두고서요. 손실이 한 번이라도 발생하면 주기가 종료되고 기본 리스크로 돌아갑니다. 주요 특징: 두 개의 추세 필터 와 선택적 모멘텀 필터 를 갖춘 추세추종 전략으로, 약한 진입을 피합니다. 시장 변동성에 맞춘 손절과 목표가 . 목표가는 손절의 배수로 설정됩니다(2:1, 3:1, 1.5:1 등 원하는 대로). 안전 상한선이 있는, 설정 가능한 연승 프로그레션 . **잔고 대비 %**로 리스크를 설정하거나(자동 통화 환산 포함), 고정 랏 을 사용할 수 있습니다. 선택 가능한 트레일링 스탑 , 시간 필터 , 지정 시각 강제 청산 . 매수/매도 를 각각 따로 활성화할
Order Blocks Precision EA Order Blocks Precision EA는 지정가 대기 주문으로 오더 블록을 거래하는 MetaTrader 5용 자동매매 Expert Advisor입니다. 작동 방식 EA는 최소 세 개의 연속된 캔들로 이루어진 뚜렷한 방향성 움직임을 찾습니다. 움직임이 확인되면 그 움직임이 시작된 지점에 지정가 주문을 냅니다. 매수: 상승 움직임 직전의 마지막 음봉(빨간색 캔들)의 고가. 매도: 하락 움직임 직전의 마지막 양봉(초록색 캔들)의 저가. 손절(스톱로스)은 마지막 반대 방향 캔들의 범위를 기준으로 하며, 이익실현(테이크프로핏)은 손절 거리의 배수로 직접 설정합니다. 모든 주문은 손절과 이익실현이 이미 지정된 상태로 전송됩니다. EA는 마틴게일이나 그리드 기법을 사용하지 않습니다. 내장 필터 주문을 내기 전에 세 가지 필터가 시장 상황을 확인합니다. 방향성 강도 필터, 변동성 필터(변동성이 최근 자체 평균 대비 일정 범위 안에 있을 때만 거
Equilibrium Boxes
Carlos Dante Diaz
Equilibrium Boxes: POC, ATR 기반 분류, EA용 버퍼를 갖춘 동적 균형 구간 인디케이터 Equilibrium Boxes는 가격이 전개되는 동안 차트에 균형 구간을 그려 줍니다. 각 박스에는 상단(top), 하단(bottom), 그리고 POC(Point of Control)가 있습니다. 모멘텀이 이전 박스가 더 이상 유효하지 않다고 나타내면 새 박스가 생성되므로, 박스는 고정된 세션이나 범위에 묶이지 않고 시장을 따라갑니다. 또한 각 박스는 측정되고 분류되어, 균형이 얼마나 좁거나 넓은지, POC가 한쪽 경계에 붙어 있는지, 박스가 대칭인지를 한눈에 확인할 수 있습니다. 기존 볼륨 프로파일과의 차이 기존 볼륨 프로파일은 하나의 세션 또는 선택한 구간에서 거래량이 가격 수준별로 어떻게 분포하는지를 보여 줍니다. Equilibrium Boxes는 다른 질문에 답합니다. 지금 가격은 어디에서 균형을 이루고 있으며, 그 균형은 얼마나 좁은가? 박스는 모멘텀을 바탕으로 자
필터:
리뷰 없음
리뷰 답변