Smart Level Map MT5
- 지표
- 버전: 1.1
- 업데이트됨: 12 10월 2026
- 활성화: 5

Smart Level Map draws the price levels many traders check before they trade, all in one indicator.
Open a chart and the map is already there: no manual lines, no extra indicators.
What it shows
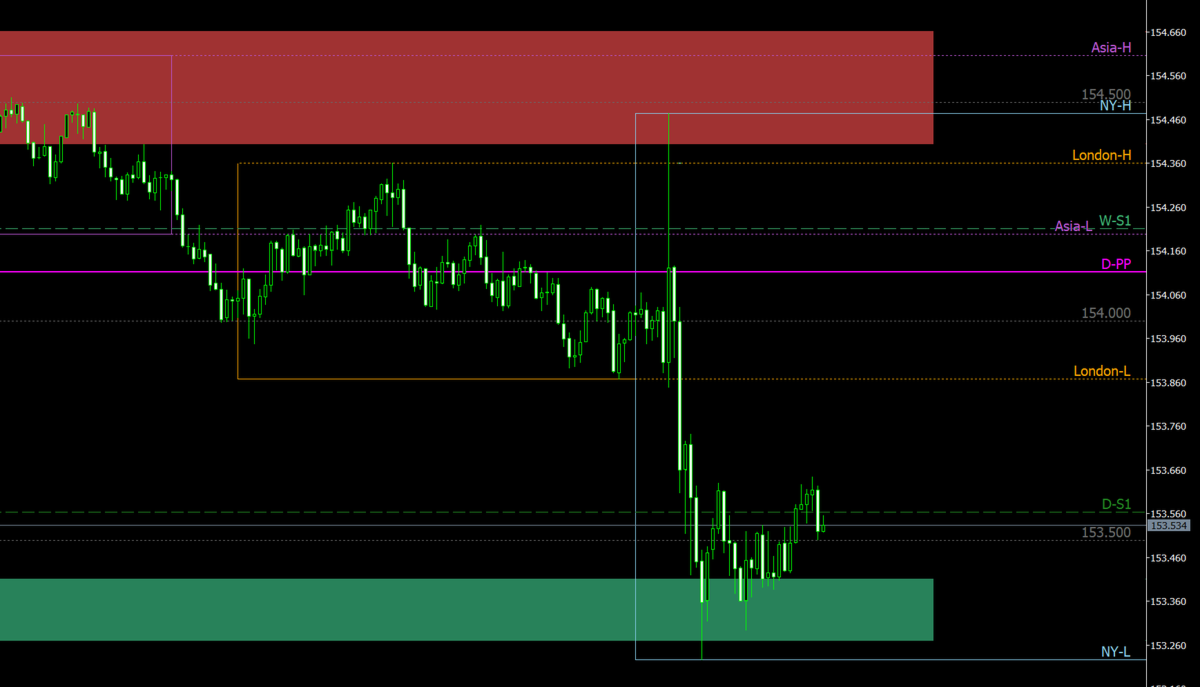
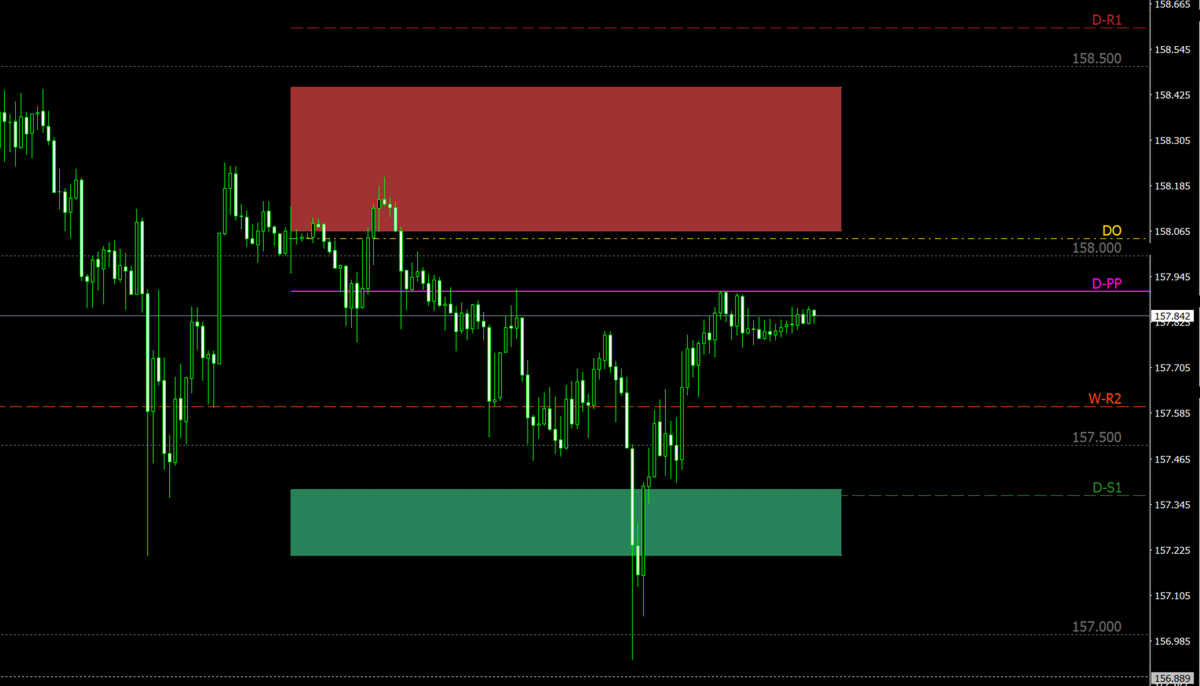
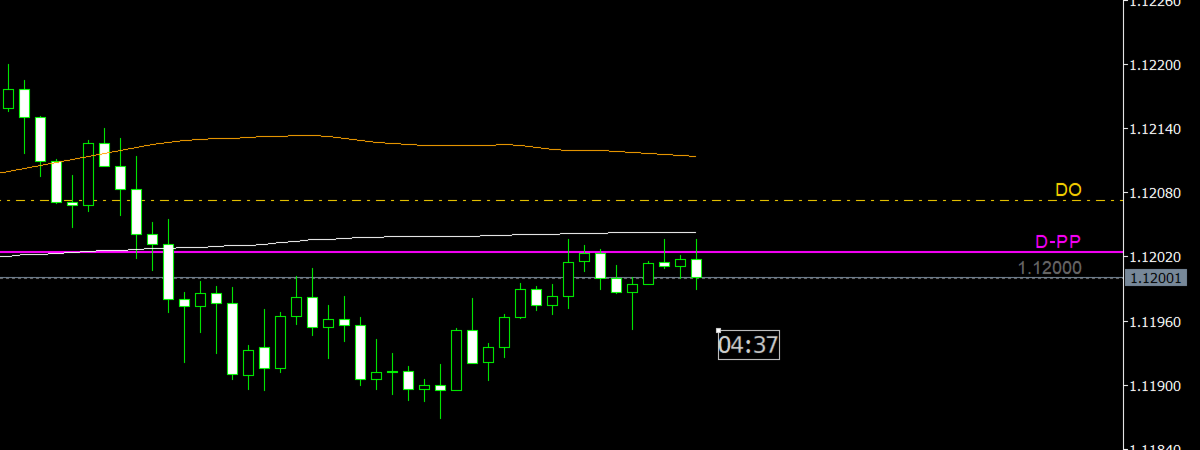
- Previous day high/low zones (wick zones) and the daily open (DO)
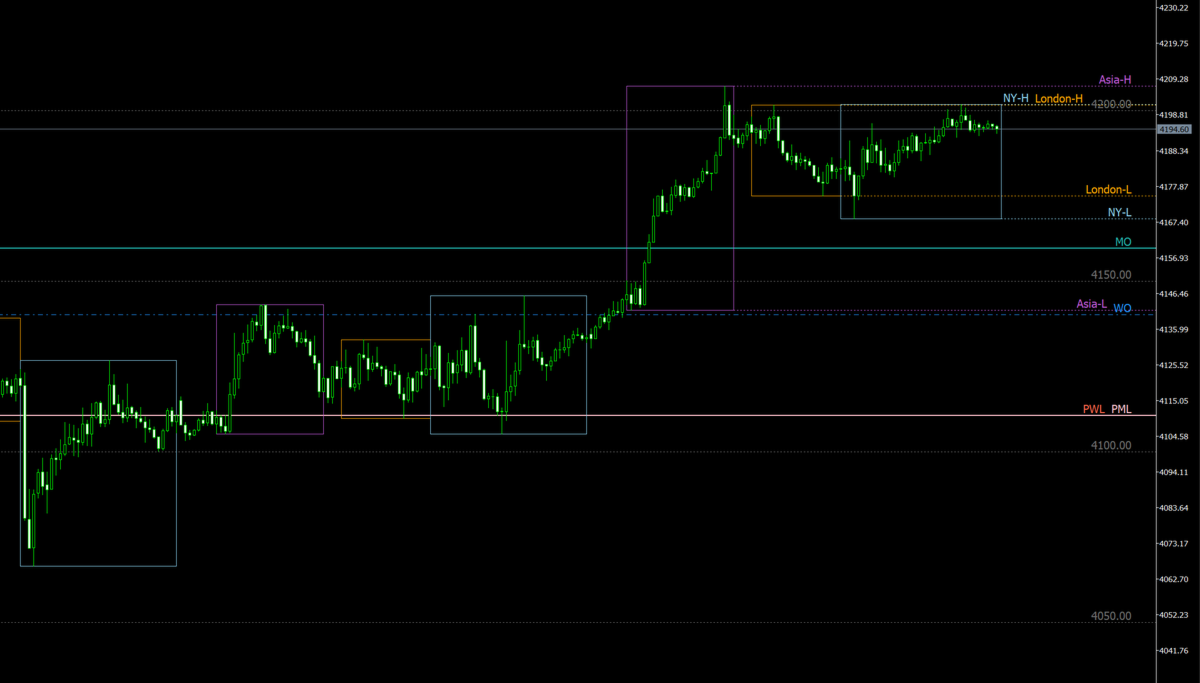
- Weekly open (WO), previous week high/low (PWH/PWL)
- Monthly open (MO), previous month high/low (PMH/PML)
- Daily pivot points (PP, R1-R3, S1-S3); weekly and monthly pivots can be turned on
- Asia, London and New York session boxes with their highs and lows (H1 and below)
- Round numbers around the current price
- Candle timer (time left on the current bar)
Made to stay readable
- Short English labels at the right edge (D-PP, PDH, Asia-H, ...). Hover a label to see its full name.
- When levels overlap, labels line up side by side instead of covering each other.
- Weekly and monthly lines start at the beginning of the current week and month, so the chart stays clean.
- Press X to hide or show everything at once (the timer stays).
Sessions in local market time
- Enter session hours in each market's own time (Tokyo, London, New York).
- Daylight saving time is handled automatically. Choose your broker's DST rule: US (most brokers), EU or None.
Notes
- Works on any symbol: forex, gold, indices, crypto.
- The indicator does not place trades and does not give buy/sell signals. It shows where the levels are; how you use them is your decision.
- No DLLs, no internet access.
Inputs
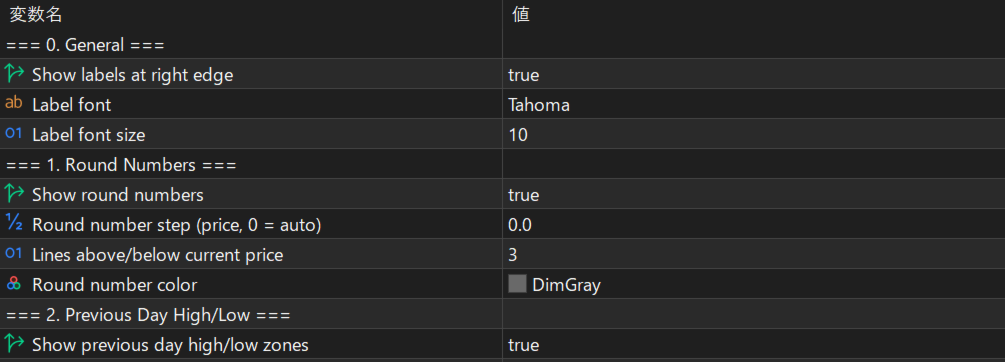
0. General: show labels, label font, label size
1. Round Numbers: on/off, step (0 = auto), lines above/below, color
2. Previous Day High/Low: zones, lines, colors, daily open
3. Weekly / Monthly Levels: WO, PWH/PWL, MO, PMH/PML and colors
4. Sessions: on/off, days to show, Asia/London/New York hours and colors, broker DST rule
5. Pivot Points: daily/weekly/monthly on/off and colors
6. Shortcut: show/hide key
7. Candle Timer: on/off, color, font size