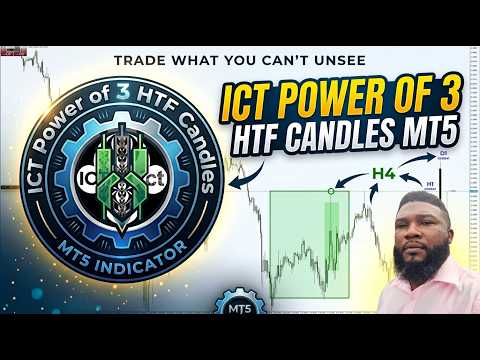
ICT Power of 3 HTF Candles
- 지표
- 버전: 1.1
- 업데이트됨: 9 10월 2026
- 활성화: 8

ICT Power of 3 HTF Candles
See the higher-timeframe candle forming while you trade the lower timeframe. The indicator projects HTF candles to the right of your chart, built live from your current symbol’s data. You can read the Power of 3 structure without switching timeframes.
Background: the Power of 3
The Power of 3 (PO3, also written AMD) is an ICT concept. It describes a candle, a session or a whole day as three phases that repeat on every timeframe.
- Accumulation: price moves sideways near the open in a tight range. Large participants build positions while the market looks quiet.
- Manipulation: price makes a false move against the real direction, often called the Judas swing. It sweeps liquidity above or below the range, trapping traders who chase the breakout and triggering stop orders.
- Distribution: price reverses and delivers the main move in the intended direction. It often runs through the opposite side of the range and closes near the high or low of the candle.
OHLC and OLHC: the order price travels
Every candle has the same four prices (open, high, low, close), but the order in which price reaches them tells a different story. Traders describe that order with two patterns.
- OLHC (Open, Low, High, Close): the bullish Power of 3. Price opens, drops to make the low (manipulation), then rallies to the high and closes near it (distribution). The low is set before the high, and the close finishes near the top of the range.
- OHLC (Open, High, Low, Close): the bearish Power of 3. Price opens, pushes up to make the high (manipulation), then sells off to the low and closes near it (distribution). The high is set before the low, and the close finishes near the bottom of the range.
In both patterns the first extreme is the false move and the second extreme is the real one. The wick beyond the open on the manipulation side is the Judas swing. The body that runs from the open to the close is the distribution.
On the chart, the forming candle’s high and low lines start from the point where each extreme was set. You can see at a glance whether the low or the high came first, and so whether the candle is following an OLHC or an OHLC path. Together with the live countdown, that shows which phase may be playing out while you plan entries on your lower timeframe.
Many traders map the same idea onto the trading day: Asia as accumulation, London as manipulation, New York as distribution.
What you get
- Projected HTF candles: body, wicks and an optional range box. You choose how many to show (default 4) and how far from the current price they sit.
- Live countdown: a timer above the forming candle shows the time until the HTF candle closes, with the timeframe title beside it.
- OHLC lines and prices: open, high, low and close lines with price labels for the forming candle. Each can be switched on or off.
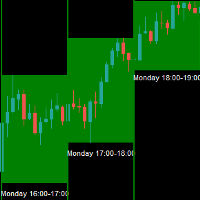
- Candle labels: intraday candles are labeled in New York time (9am, 10am, 11am…), daily candles by weekday (Mon, Tue, Wed…), weekly by date, and monthly by month. Broker server time converts automatically, DST-aware. There is also a manual override.
- 50% equilibrium line: shown on every candle, or only on the forming one.
- FVG / iFVG: HTF fair value gaps drawn beside the projected candles. A gap stops at the candle that first trades into it, and turns the inverted color once a later candle closes through it. Display it as a shaded box or as lines only.
- PSP: candles are recolored when they reverse against a correlated symbol (for example ES for NQ). It is off until you enter a correlated symbol.
- 3M and 6M candles: quarterly and half-year candles built from monthly data.
- Auto HTF (optional): picks the HTF candle from your chart timeframe.
- Several instances per chart: use the magic number to run more than one copy at once, for example H1 and Daily.
Settings
Everything is adjustable: colors, line styles, font sizes, candle count and spacing, HTF offset in hours, and each element on or off. Defaults are ready to use. Out of the box it shows H1 candles, so on H1 or higher charts choose a higher timeframe or enable Auto HTF.
Notes
- Works on any symbol and timeframe. It needs the lower-timeframe history to be loaded in order to build the candles.
- This is a chart-analysis tool. It does not place trades, send alerts or give signals.
Trading involves risk of loss. This indicator is a visual aid and is not financial advice. The Power of 3 and the OHLC / OLHC patterns are trading concepts, not a guarantee of how any candle will develop.
https://youtu.be/KILc1cie5yY