MiniBull Report
- 지표
-
Yusuf Levent Aksun
 플랫폼 엔지니어 & AWS 공인 전문가. 소프트웨어 개발, 클라우드 아키텍처, DevOps 전환 분야에서
20년 이상의 경험 보유.
현재 런던 World Wide Technology에서 플랫폼 엔지니어링 이니셔티브를 주도하며,
확장 가능한 인프라 솔루션을 구축하고 개발팀이 더 빠르고 안정적으로 제품을 출시할 수 있도록 지원.
🔹 AWS Certified Solutions Architect – Professional
🔹 AWS Certified DevOps Engineer – Professional - 버전: 1.7
- 업데이트됨: 28 9월 2026
# MiniBull Report (v1.06) — free
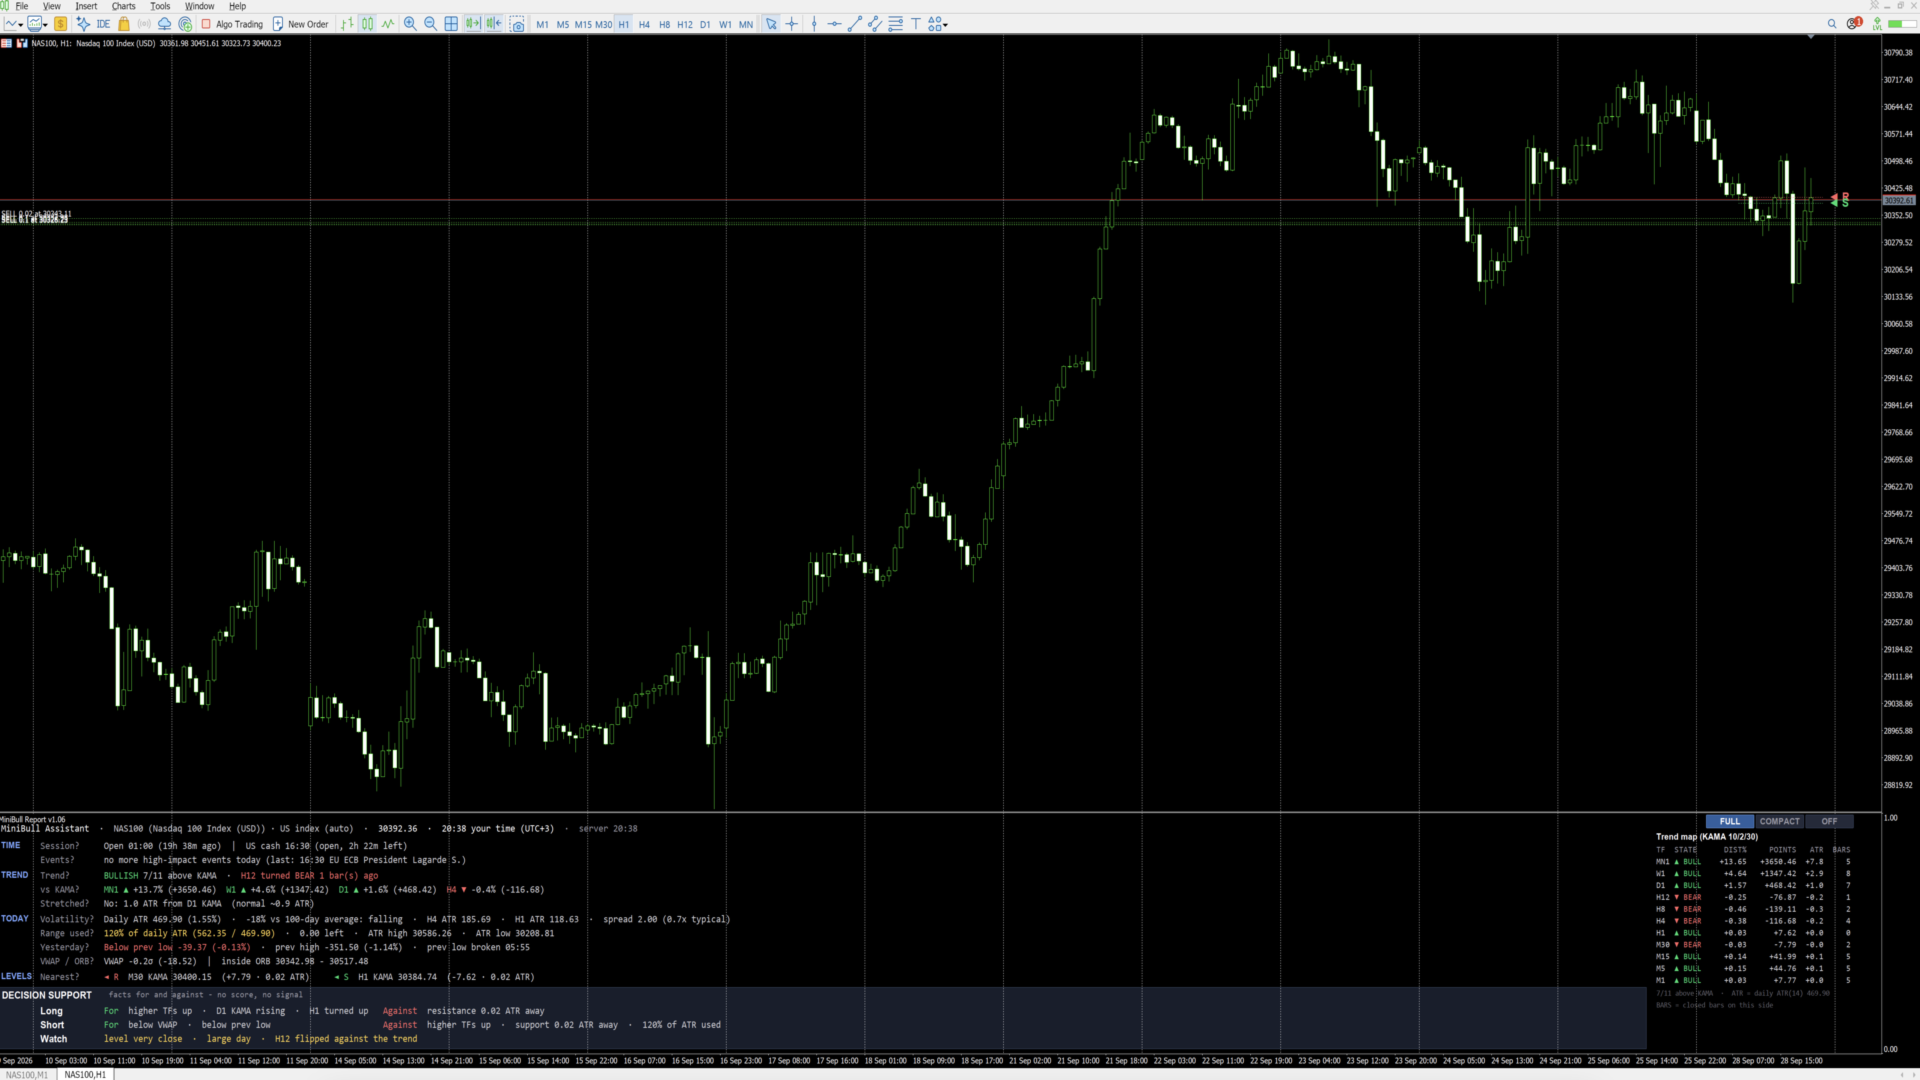
**Your market briefing in a sub-window. MiniBull Report answers the questions an intraday trader asks before every decision — in plain language, in your own time zone, and with the same answers on every chart timeframe.**
*Where is price against the monthly, weekly, daily and 4H trend? How far is it stretched? How much of today's typical range is used? Where are the nearest resistance and support? Is a high-impact event coming? What speaks for a long, what speaks against it?*
The report only describes the market. It never tells you to buy or sell, and it does not open, modify or close trades.
---
## What you see
### Full mode — for preparation
| Group | Questions answered |
|---|---|
| **TIME** | When did the session open? When does the main exchange open or close — in **your** local time? Which **high-impact events** (US, EU, UK, Japan) and **holidays** are on today's calendar? |
| **TREND** | Trend across 11 timeframes (MN1 to M1) · Price vs the KAMA of MN1, W1, D1 and H4 in %, price and ATR · Is price stretched from the daily KAMA, compared with its own normal distance? |
| **TODAY** | Daily ATR and whether volatility is rising or falling · How much of the daily ATR is used, plus the ATR high and low for today · Position vs yesterday's high and low, and whether they broke today · Distance to VWAP in sigma · Opening range status |
| **LEVELS** | The nearest resistance and support, with distance in price and in daily ATR |
| **DECISION SUPPORT** | Facts **for** and **against** a long, facts for and against a short, and a **watch** list. No score, no verdict — the decision stays yours. |
A **trend map** on the right shows all 11 timeframes: state, distance in %, in price and in ATR, KAMA slope, and how many closed bars price has stayed on that side.
### Compact mode — while trading
Four lines: **Trend**, **Levels**, **Long**, **Short**. Most of the screen stays free for the chart.
Three buttons in the corner — **FULL**, **COMPACT** and **OFF** — switch with one click; the active one is highlighted. OFF hides the report and shrinks the window to the button bar. The sub-window height adjusts itself (or turn auto height off and drag the border yourself).
---
## Key features
- **Same answer on every timeframe.** Everything is calculated from fixed timeframes (M1, M5, H1, H4, D1 and higher), never from the chart's own bars.
- **Your own time.** All times are shown in your computer's local time zone, with the server time next to it. Summer time of New York, London, Frankfurt and Tokyo is handled separately.
- **Symbol profile, detected automatically.** US indices, DAX / Euro indices, FTSE, Nikkei, Brent, WTI, gold, silver, forex and crypto each get the exchange opens that matter to them.
| Profile | Exchange opens shown |
|---|---|
| US indices | New York 09:30 |
| DAX, Euro indices | Frankfurt 09:00 |
| FTSE | London 08:00 |
| Nikkei | Tokyo 09:00 |
| Brent | London 08:00 · New York 09:00 |
| WTI | New York 09:00 |
| Gold, silver | London 08:00 · New York 08:20 |
| Forex | Tokyo · London · New York |
| Crypto | 24h market, day rolls at 00:00 UTC |
- **Economic calendar built in.** Uses MetaTrader 5's own calendar: high-impact events only, plus holidays. An event within 60 minutes turns yellow; within 15 minutes it gets an orange box. Hover the row to see the last released value against forecast and previous.
- **Spread check.** Current spread compared with the typical spread of recent days; a warning appears when it is twice as wide.
- **Nearest levels marked on the chart.** Small ◄ R and ◄ S markers show where the nearest resistance and support are.
- **Hover for details.** Broker trading hours, the definition of "yesterday" and the last economic release appear as tooltips.
- **Languages:** English (default) and Turkish, or automatic from the terminal language.
---
## Works alone — and even better together
MiniBull Report works fully on its own. Attach it to any chart and it calculates its own levels.
Used together with **MiniBull Session S/R MTF VWAP Auto**, it also:
- shows the **last BUY / SELL / RETEST arrow** of the main indicator in the TREND group;
- places its ◄ R / ◄ S markers on the main indicator's own level lines, with identical level names ("R (4H x60)", "Prev High", …).
---
## How to use
1. Attach MiniBull Report to a chart. It opens in its own sub-window below the price chart.
2. Check the header: symbol, detected profile, your local time and the server time.
3. Use **Full** mode before the session, **Compact** mode while trading.
4. Before a decision, read the **Decision support** box: facts for, facts against, and the watch list.
On the first start the terminal may need a few seconds to download the higher-timeframe history.
---
## Inputs (overview)
| Group | Main settings |
|---|---|
| Report | Language, start mode (Full / Compact / Off), optional hotkey, auto height, font sizes, trend map on/off, chart markers on/off, refresh interval |
| Thresholds | When the text says "stretched", "testing", "close", "large day", "extended", "spread high", and the event warning times |
| Levels | 1H / 4H / Daily lookbacks (48 / 60 / 20 by default — keep them equal to the main indicator), opening range length, KAMA and ATR settings |
| Economic calendar | On/off, country codes (US, EU, GB, JP by default) |
| Session & time zone | Session mode (auto), broker time zone (auto), your own time zone (auto from this computer) |
| Colors | Text, up/down, warning and box colors |
---
## Notes
- **Descriptive only.** The report states where price is and what happened; it does not predict direction and gives no trading signals.
- **Economic calendar** data comes from MetaTrader 5 and is available on live and demo accounts, not in the Strategy Tester. Event names are supplied by MetaQuotes.
- **Strategy Tester:** the report works in visual mode; there is no local clock in the tester, so times are shown in server time.
---
**Risk warning:** Trading leveraged products involves a high level of risk and may not be suitable for all investors. This indicator is an analysis tool and gives no investment advice.