AxisGuard Pro
- 지표
-
Muhammad Andiya Nafhan
 🚀 Aureon Markets
🌐 Forex Technology & Trading Solutions Provider
We provide professional tools and solutions for traders who seek better market analysis and trading efficiency.
📊 Our Focus:
✅ Trading Tools
✅ Market Analysis Solutions
✅ Trading Automation - 버전: 1.1
- 업데이트됨: 23 9월 2026
- 활성화: 5
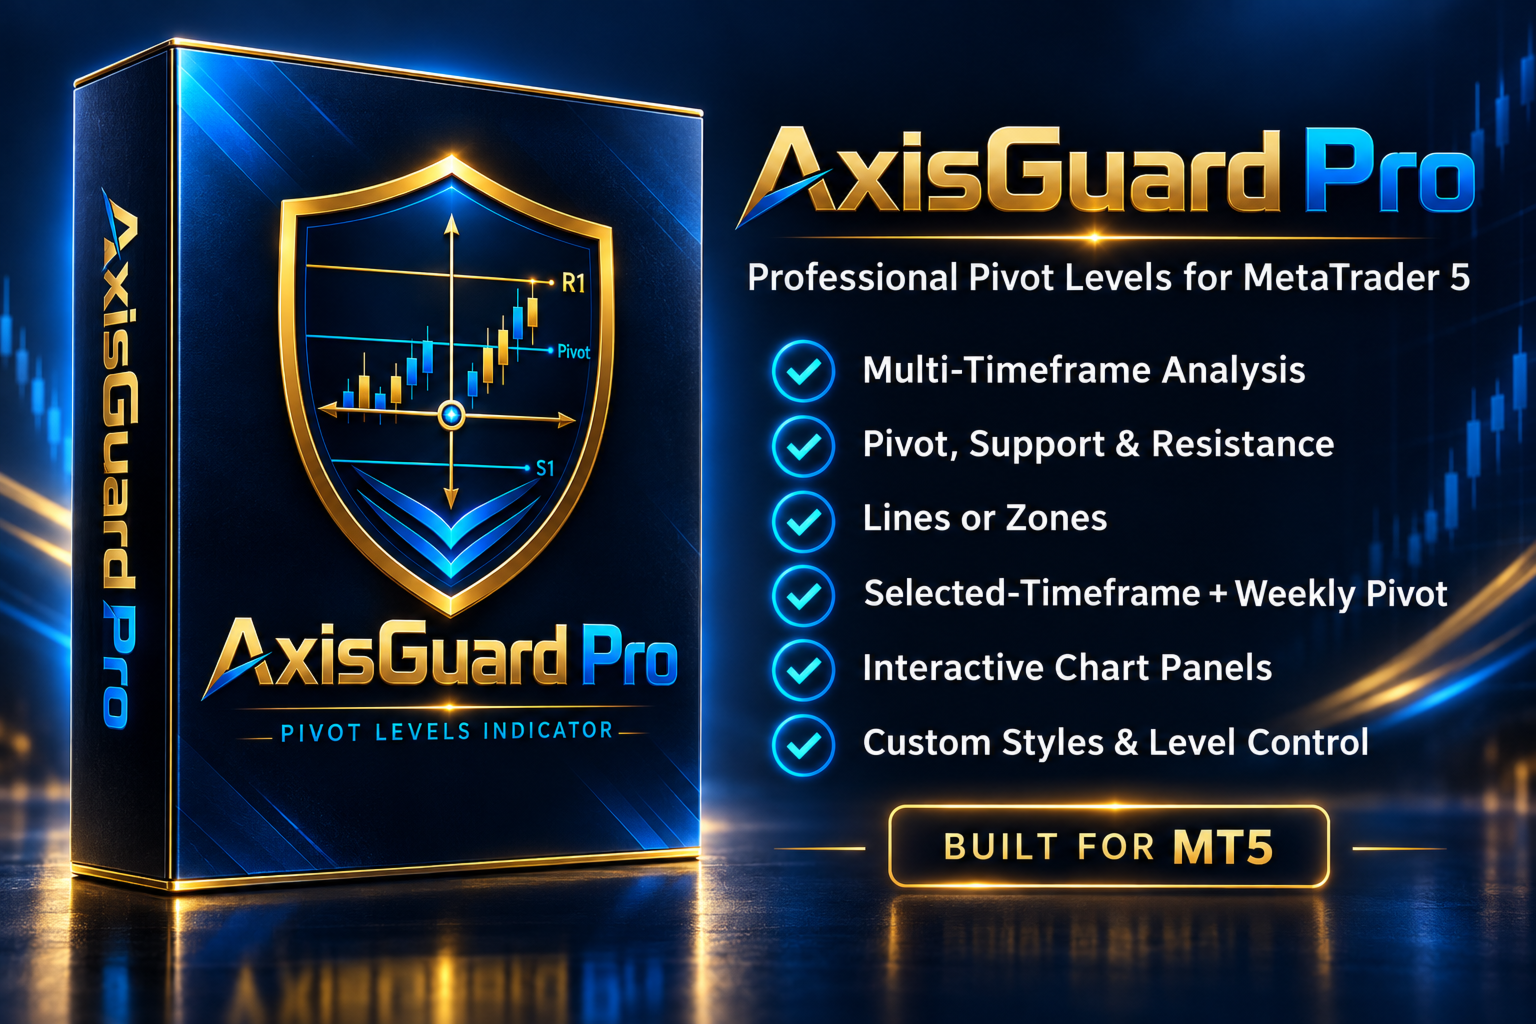
AxisGuard Pro
Professional Pivot, Support & Resistance Indicator for MetaTrader 5
━━━━━━━━━━━━━━━━━━
AxisGuard Pro is a professional analytical indicator designed to help traders identify important market levels without overcrowding the chart.
It provides a clean view of Pivot Points, Support and Resistance levels with powerful multi-timeframe control.
Suitable for:
✅ Forex
✅ Gold
✅ Indices
✅ Crypto
✅ Other MetaTrader 5 supported symbols
━━━━━━━━━━━━━━━━━━
⭐ Main Features
🔹 Multi-Timeframe Pivot Analysis
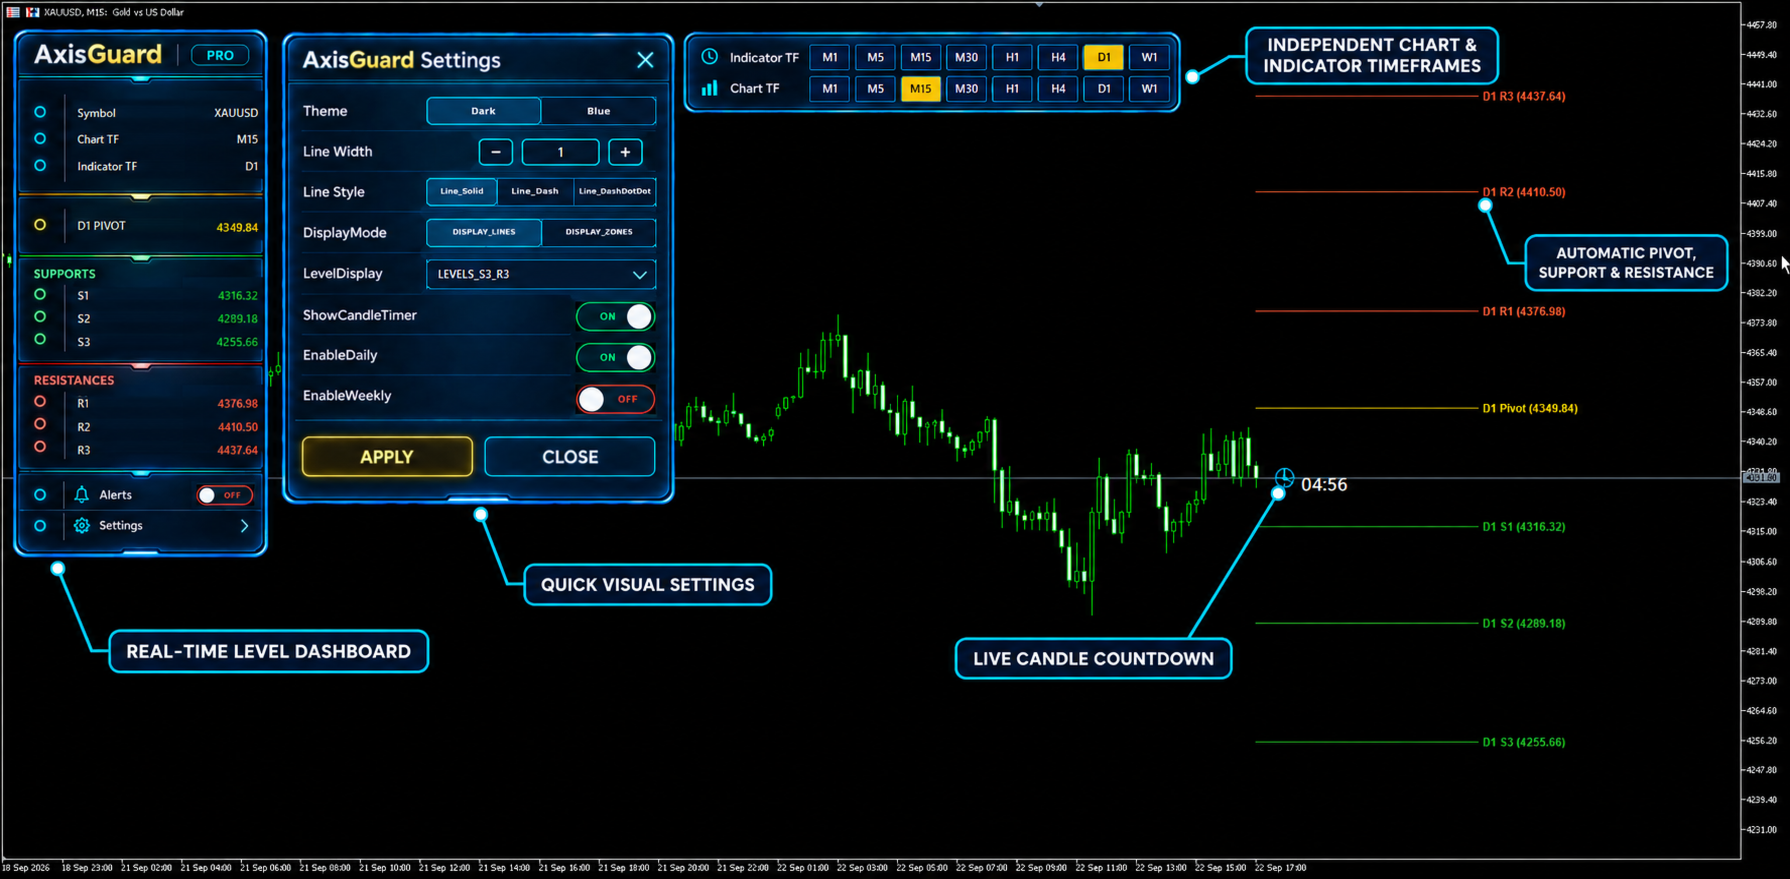
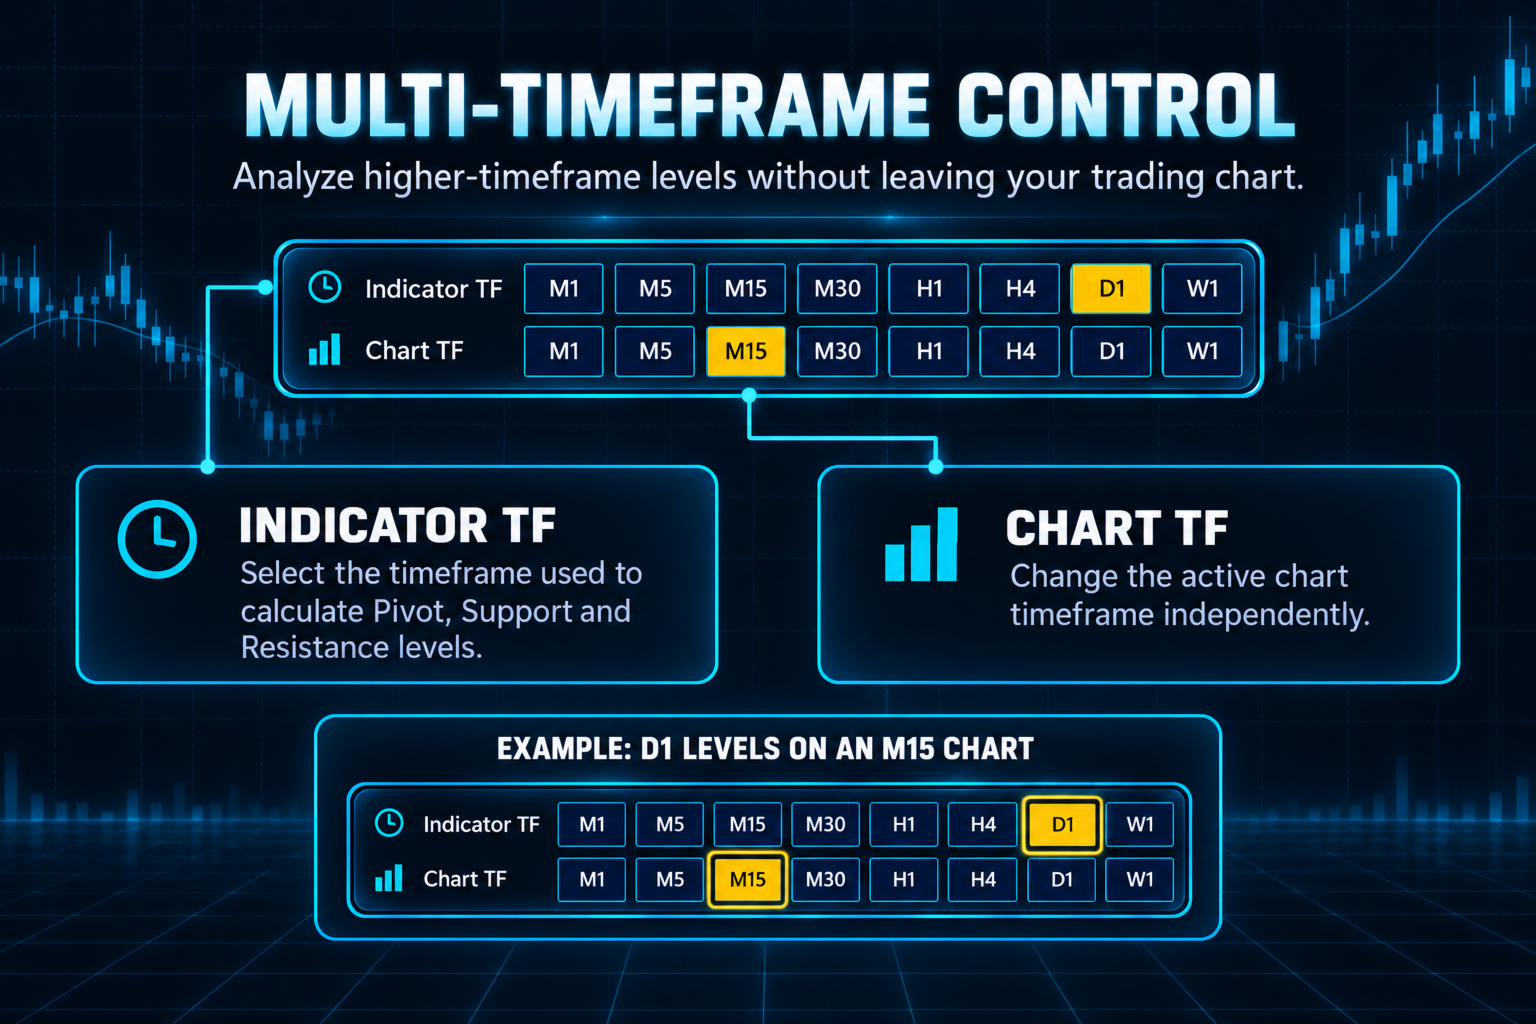
Analyze levels from a selected timeframe while trading on another chart timeframe.
Example:
Chart TF: M15
Indicator TF: D1
🔹 Pivot, Support & Resistance Levels
Displays:
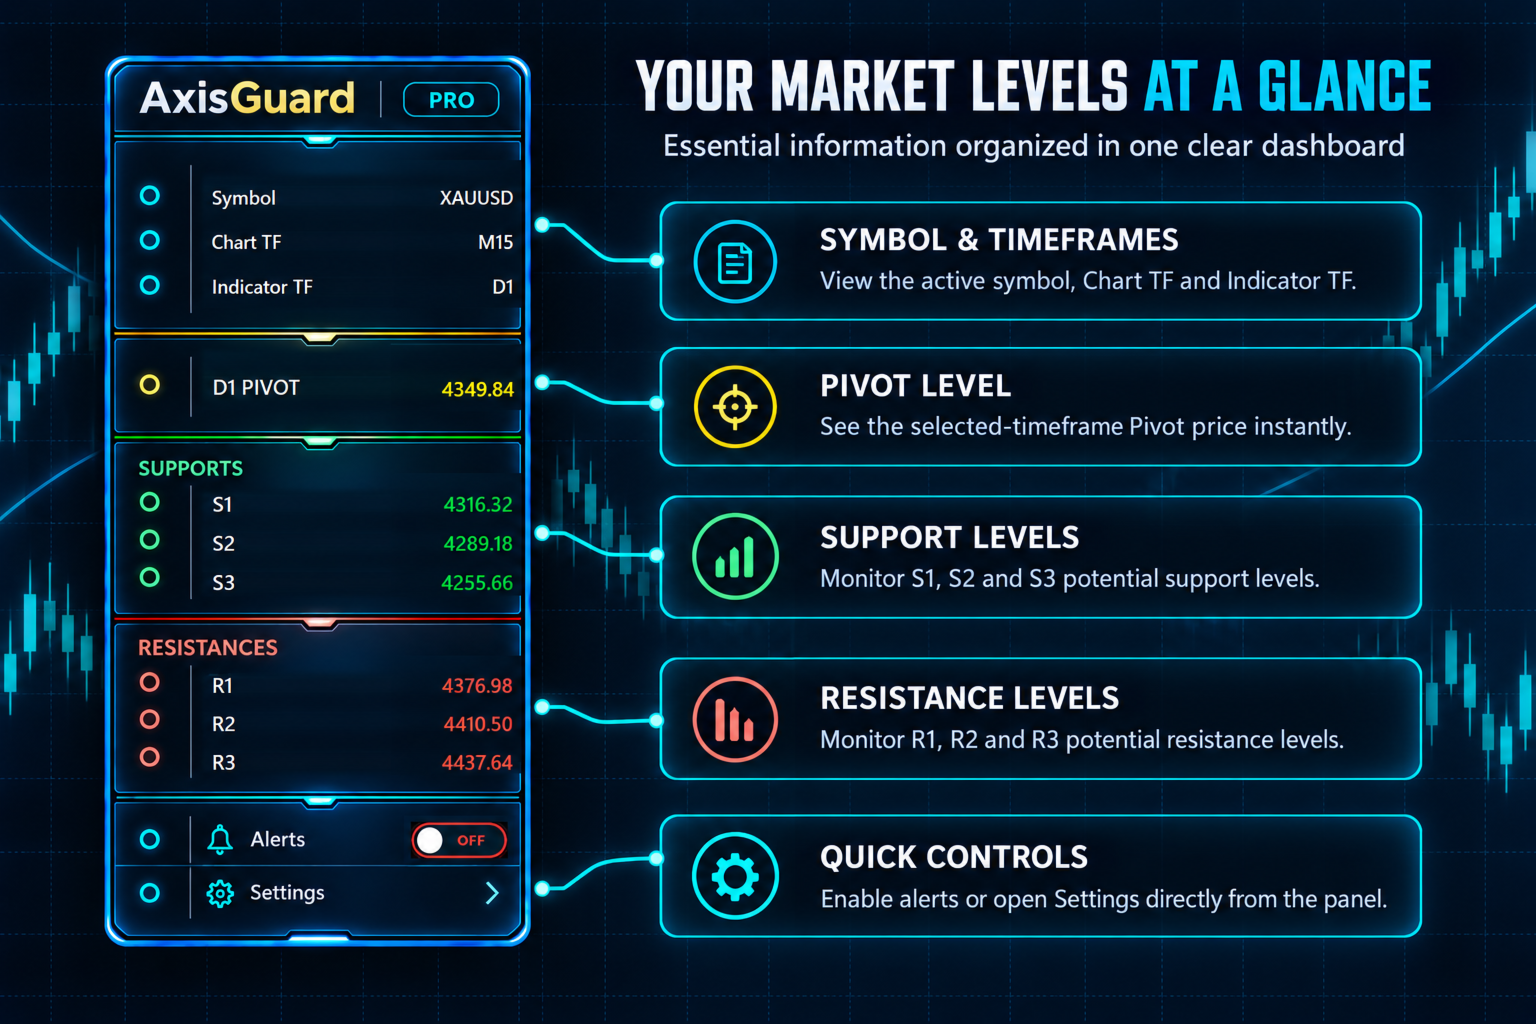
• Pivot
• S1 - S3 Support Levels
• R1 - R3 Resistance Levels
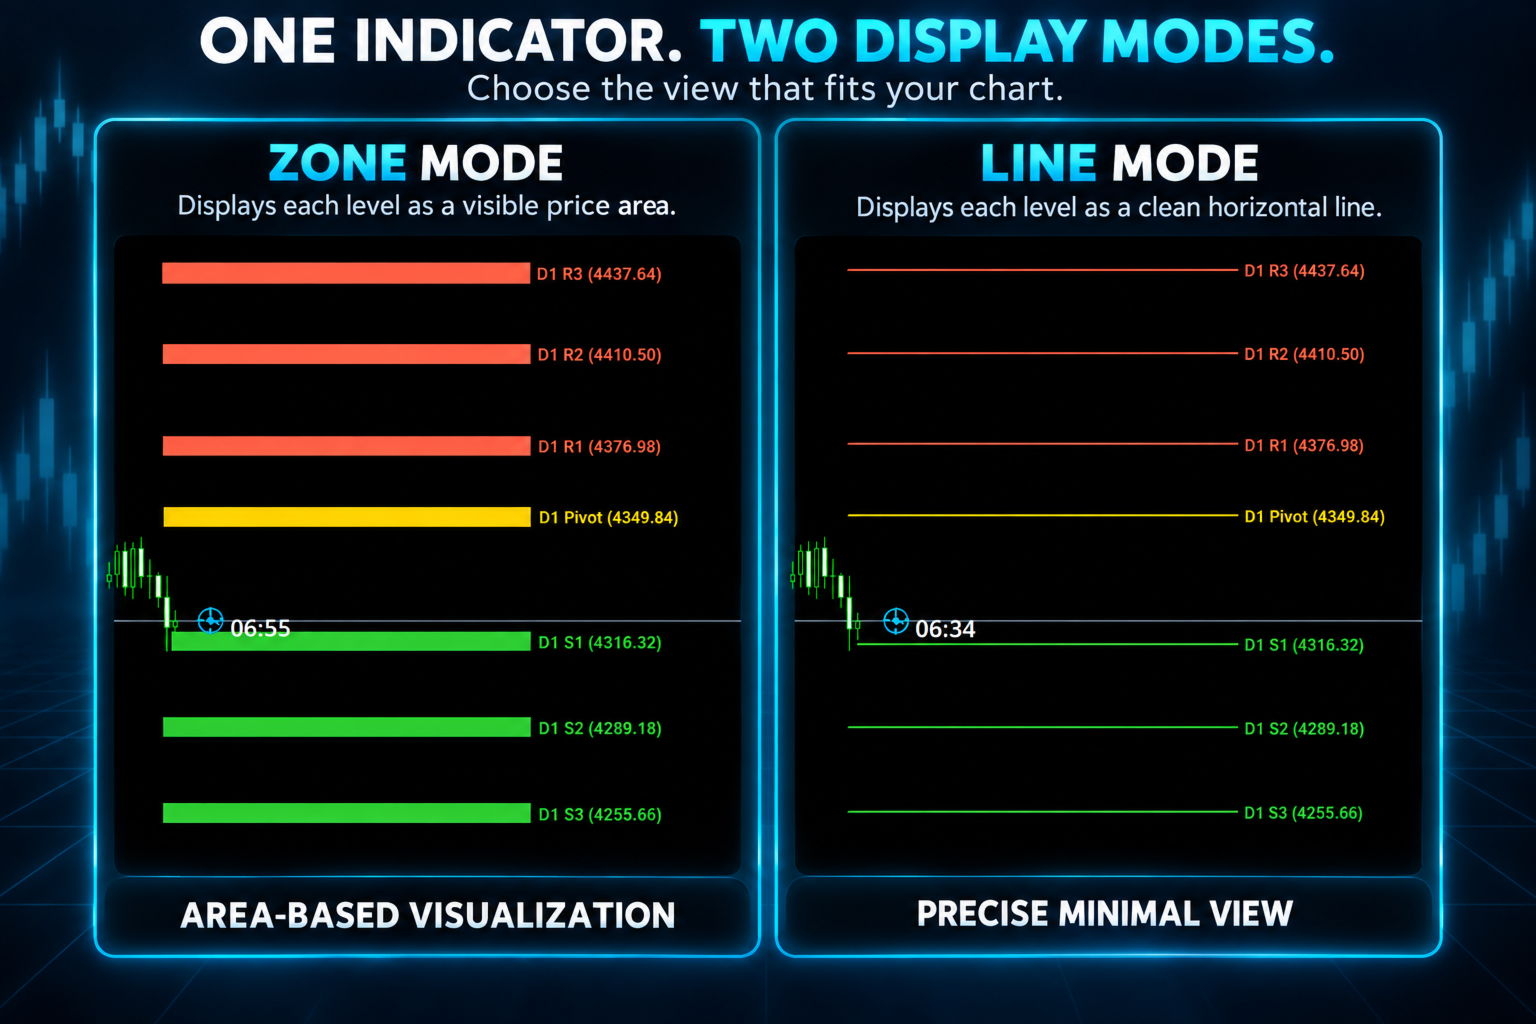
🔹 Lines & Zones Mode
Choose between:
• Clean horizontal lines
• Price reaction zones
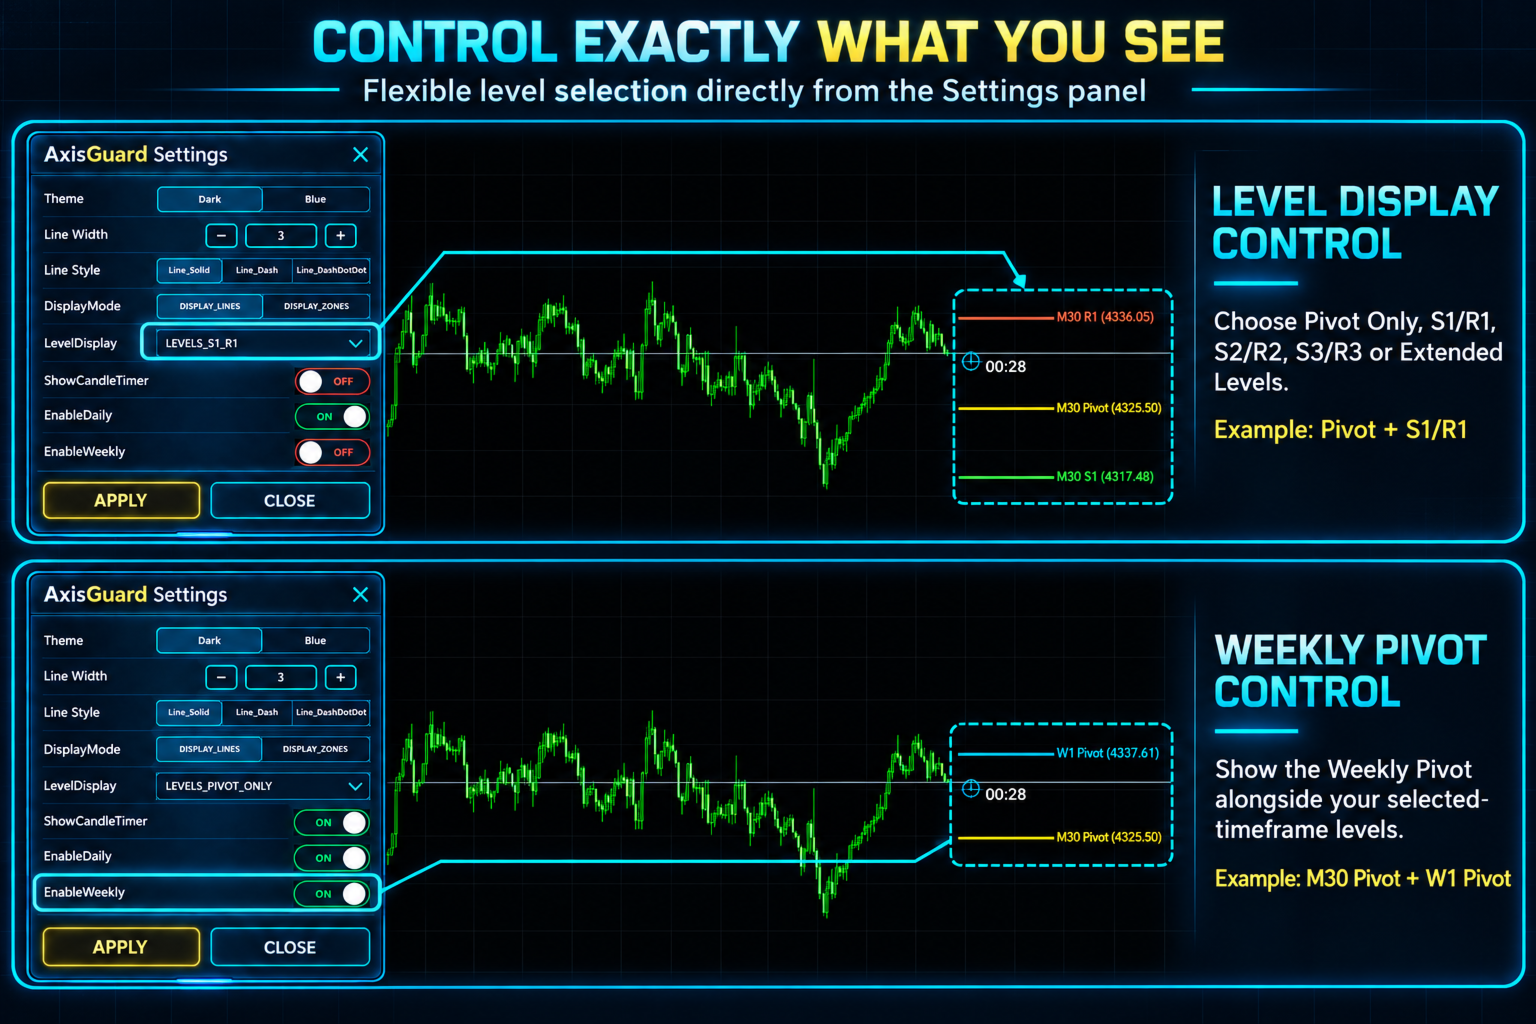
🔹 Flexible Level Control
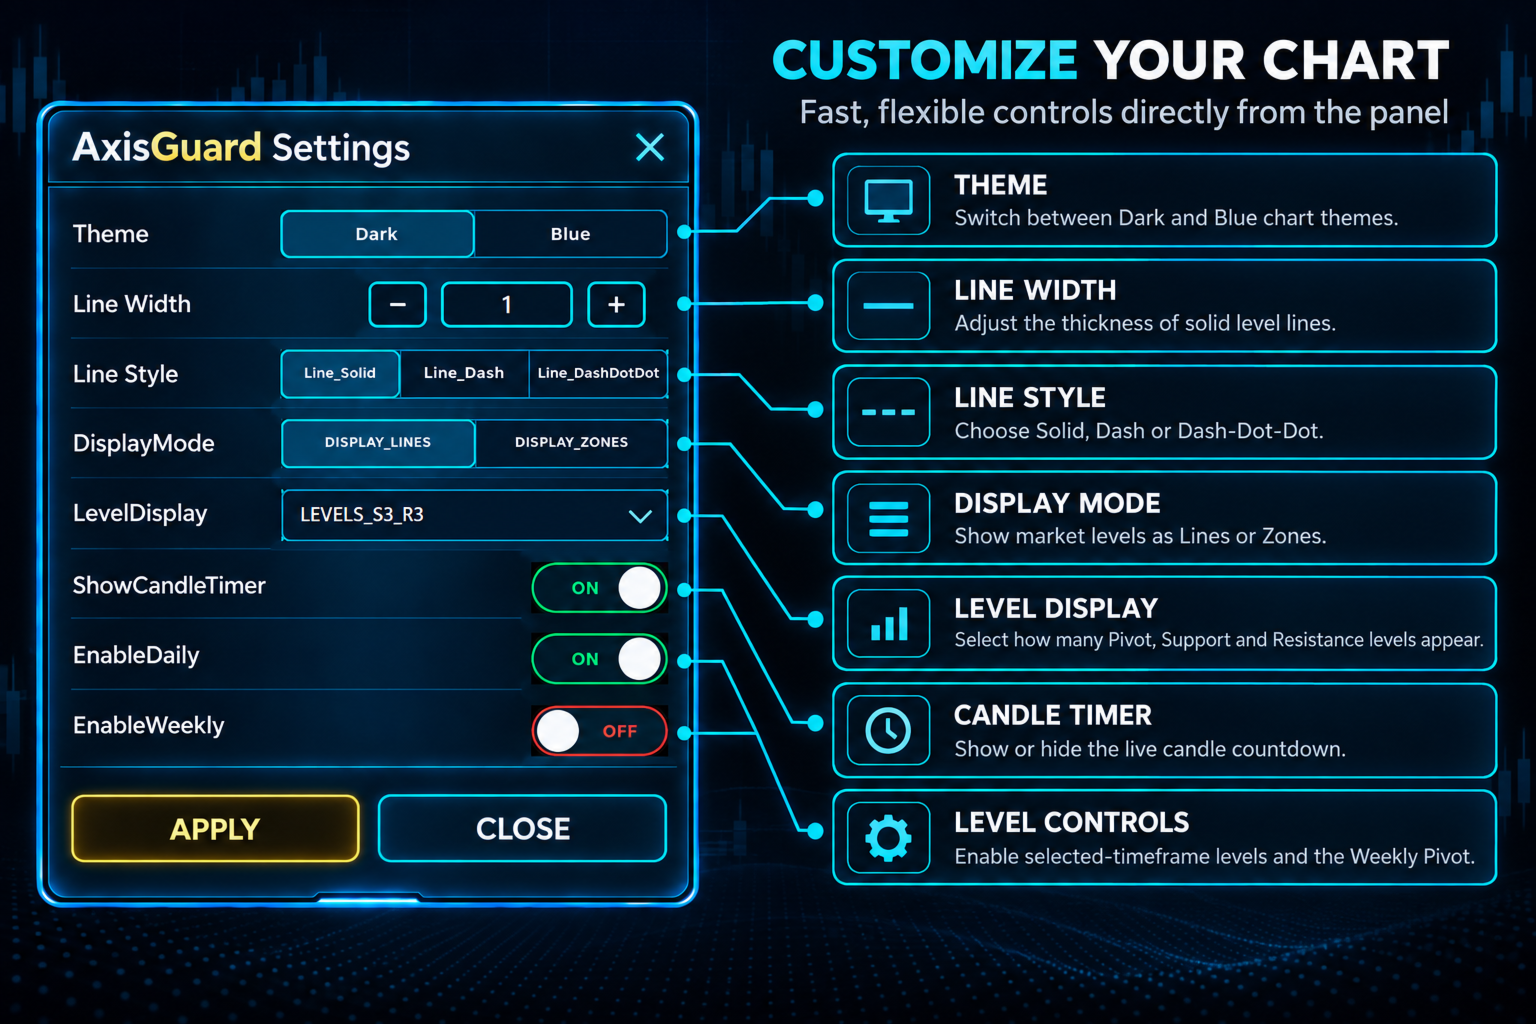
Select how many levels are displayed on your chart.
🔹 Daily & Weekly Pivot Structures
Enable or disable Daily and Weekly levels according to your analysis style.
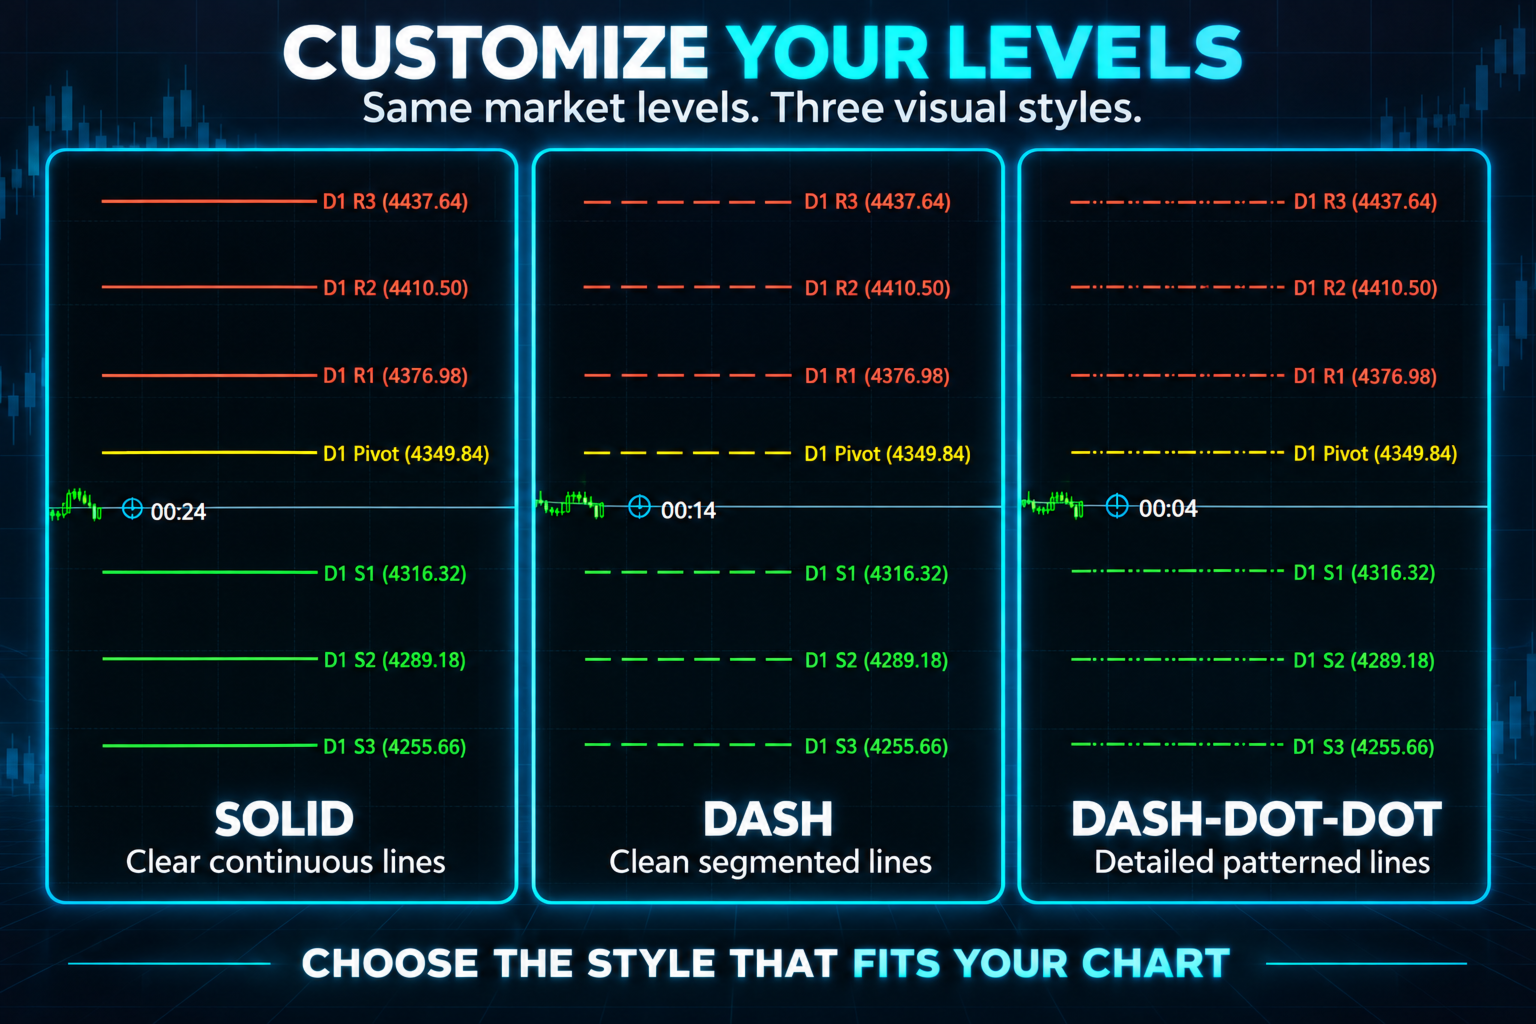
🔹 Custom Visual Settings
Adjust:
• Line style
• Line width
• Display options
🔹 Candle Timer
Shows the remaining time of the current candle near the latest price.
🔹 Smart Alerts
Receive notifications when price approaches important market levels.
Supported:
• Popup Alerts
• Push Notifications
🔹 Interactive Panels
Control your indicator easily with movable:
• Main Panel
• Timeframe Panel
• Settings Panel
━━━━━━━━━━━━━━━━━━
💡 Trading Concepts
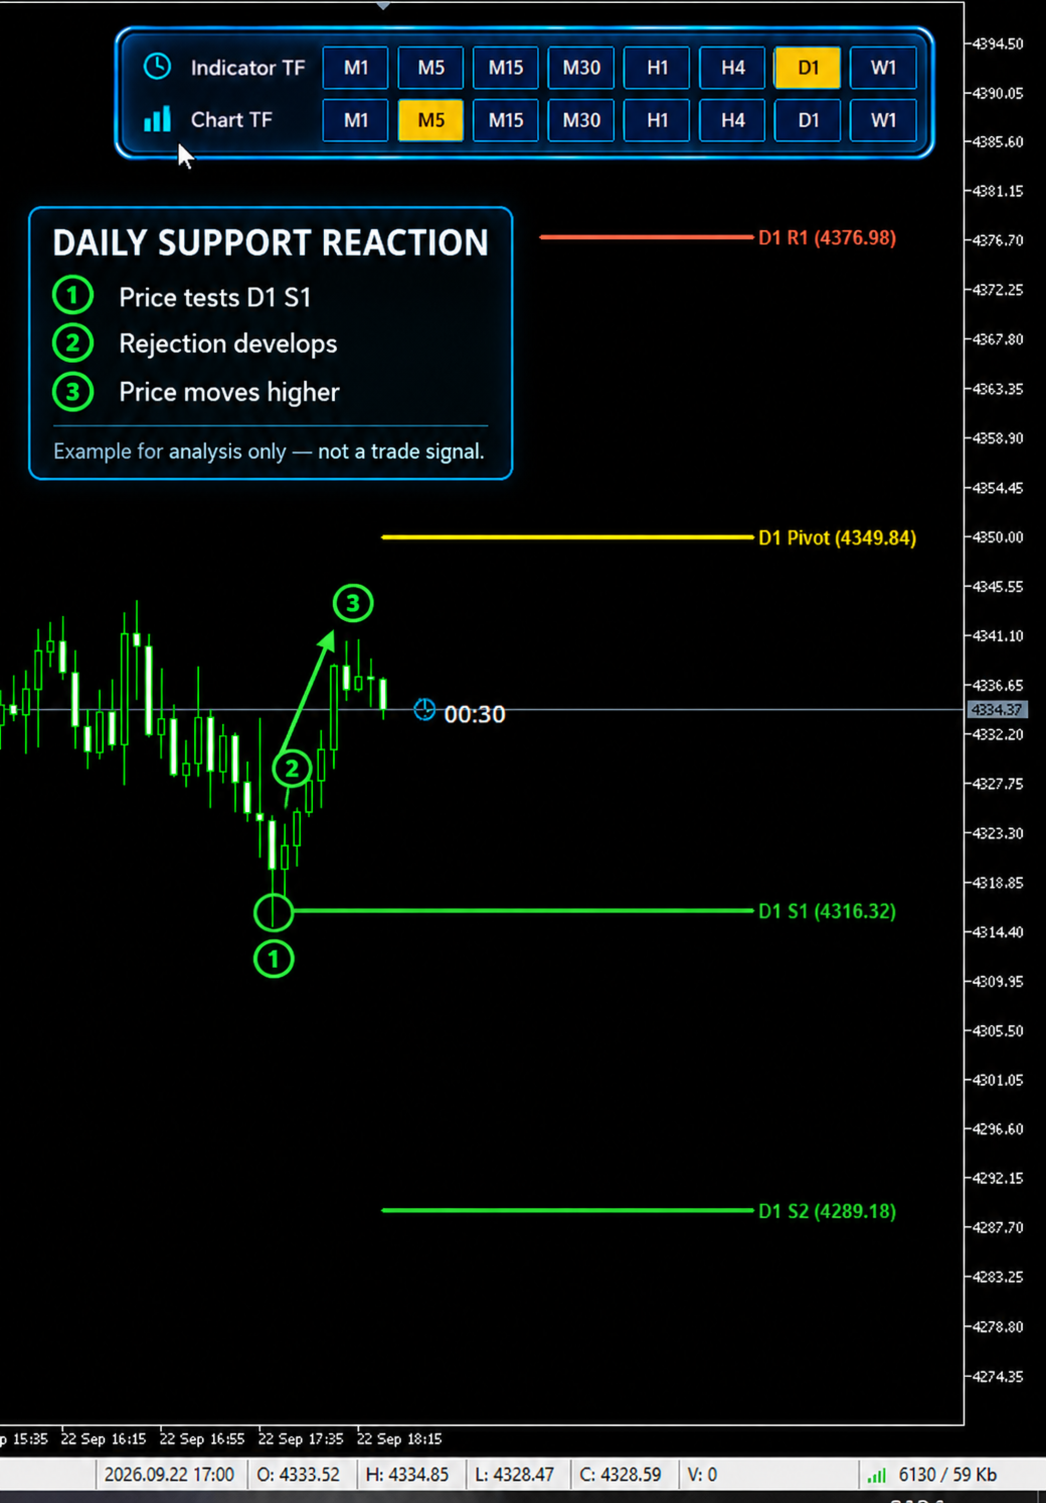
📌 Pivot Rejection
Observe price reaction around Pivot levels and analyze possible rejection areas.
📌 Support & Resistance Reaction
Use S1-S3 and R1-R3 as potential reaction zones.
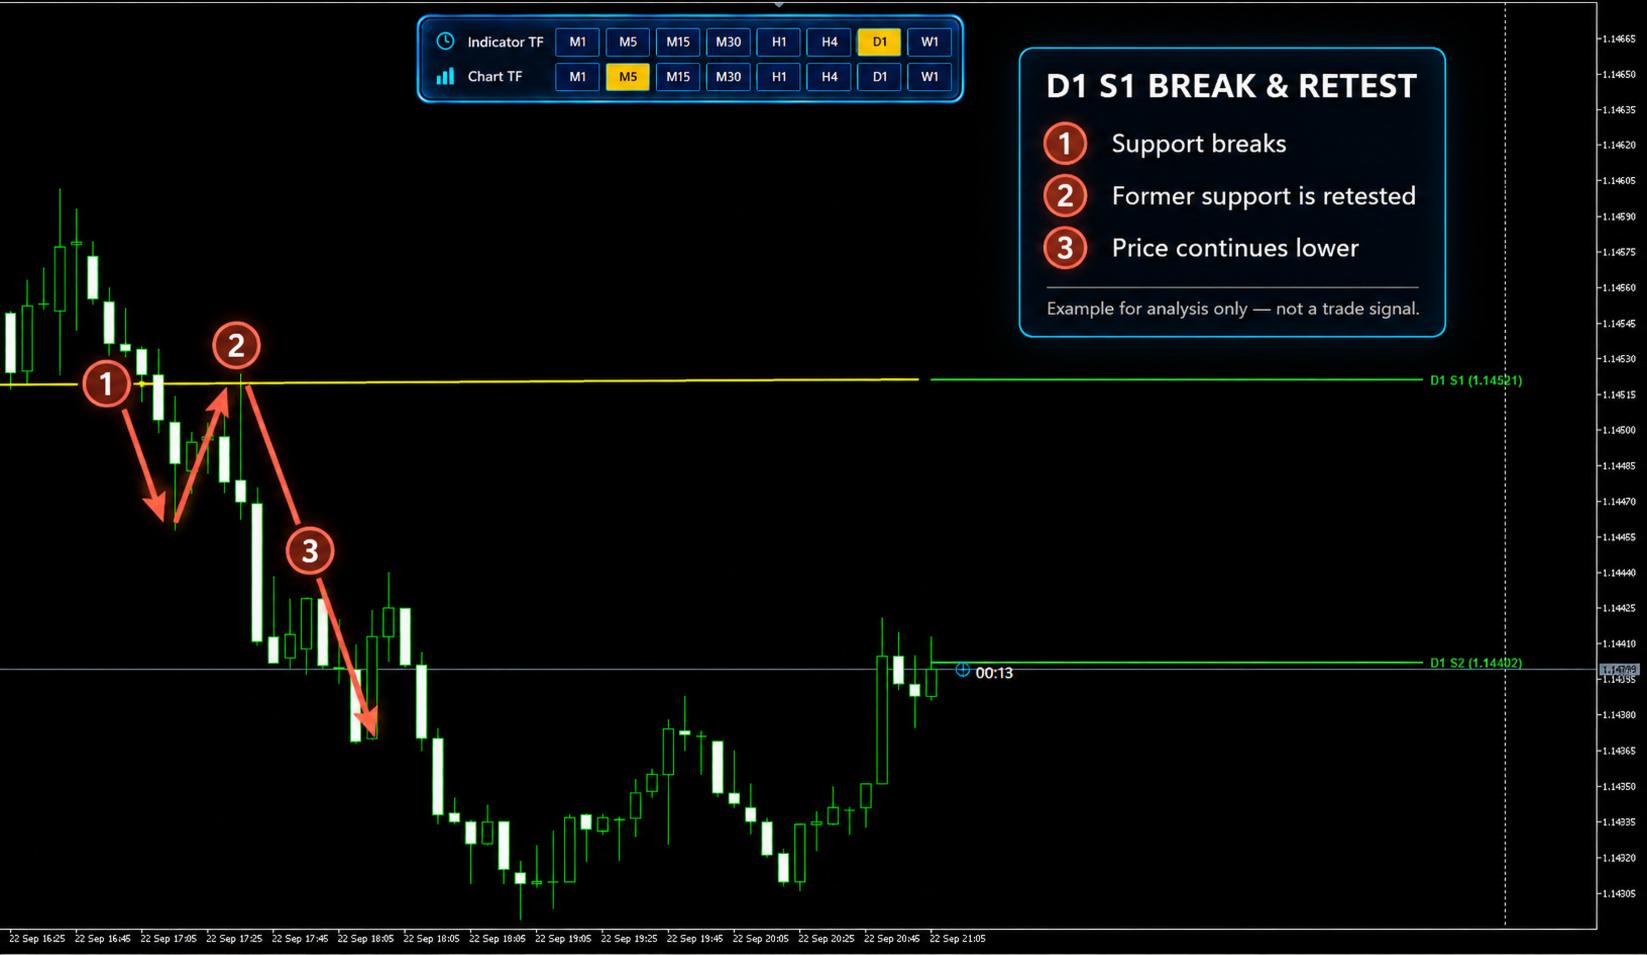
📌 Breakout & Retest
Analyze level breaks and possible retest movements.
📌 Multi-Timeframe Analysis
Combine lower timeframe entries with higher timeframe market levels.
📌 Level-to-Level Market Mapping
Use Pivot, Support and Resistance levels as a visual market map.
━━━━━━━━━━━━━━━━━━
⚠️ Important Information
AxisGuard Pro is an analytical trading tool.
❌ Does not open trades automatically.
❌ Does not close trades automatically.
❌ Does not guarantee future market results.
It is designed to support market analysis and decision-making.
━━━━━━━━━━━━━━━━━━
🏢 Aureon Markets
Professional Trading Tools & Solutions