Smart Flow Index
- 지표
- 버전: 1.0
- 활성화: 5

# Smart Money Flow Index - Opening versus rest of the day
*Category: Volume | Difficulty: intermediate | Window: separate window below the chart | Markets: Indices | Suggested timeframes: M5, M15, M30, H1*
## Short description
> Separates money flow between the first session hours and the rest of the day, showing their divergence. A time based convention, not a measure of who is trading.
### Overview
There is a long standing observation in equity market analysis: the first part of a session tends to react to overnight news and be driven by the public, while the rest of the day sees professional operators prevail, having the time to build positions. This indicator accumulates money flow separately for the two time bands and shows their normalised difference. A divergence between the two components describes a market where the two groups of participants are behaving in opposite ways, a situation that historically precedes changes in direction. It must be stated clearly that the distinction between informed and uninformed money is a reading convention based on the clock, not a measure of who is actually trading: the indicator measures when flow happens, not who generates it.
### How the calculation works
1. Each bar flow is the close position within the range, weighted by volume: the same scheme as the estimated delta.
2. Each bar is classified as belonging to the opening band or to the rest of the day, based on server time.
3. The band computation correctly handles sessions crossing midnight.
4. Over the chosen window the flows of the two bands are accumulated separately.
5. Both totals are divided by the average bar volume, becoming mutually comparable equivalent imbalance bars.
6. If either band gathered no bars within the window, for instance on higher timeframes, the divergence is not computed.
### How to use it
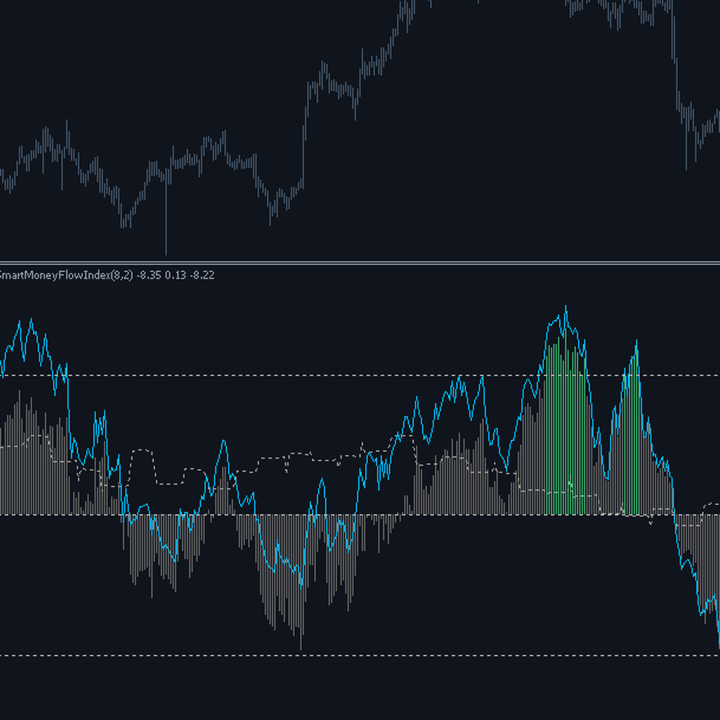
- Read the histogram as a disagreement measure: high values mean the two time bands are buying or selling in opposite ways.
- A green histogram with falling price indicates the flow in the central part of the day is accumulating against morning weakness.
- The two underlying lines must be read together with the histogram: they say whether the divergence comes from one band or both.
- Set InpSessionStart to the opening hour of your reference market, which depends on the broker server timezone.
- Do not use it on continuous markets such as spot forex, where the notion of a session open is far less defined.
### Who it is for and on which timeframes
It targets traders working on equity indices and stocks, where the distinction between time bands has a real basis tied to trading hours. It works from M5 to H1, where a session contains enough bars to populate both bands. It requires correctly setting the opening hour according to your broker timezone, a one time step that renders the indicator meaningless if done wrong. It is not suited to markets trading twenty four hours with no defined open.
### Practical example of reading a signal
On US500 M15 price falls for three consecutive sessions. The opens are weak, with decisive selling in the first two hours, and the grey opening flow line is clearly negative. But the blue line, the rest of the day, is slightly positive: every afternoon someone buys what was sold in the morning. The histogram is green and exceeds the threshold. The divergence says weakness is concentrated in morning reactions while accumulation prevails during the day. On the fourth session price opens with a negative gap and closes sharply higher, reversing the sequence.
## Input parameters
| Parameter | Default | Description |
|---|---|---|
| `InpOpenHours` | 2 | Number of initial session hours treated as the opening band. Internally capped at twelve, beyond which the distinction loses meaning. |
| `InpSessionStart` | 8 | Session start hour according to the broker server clock. It must be verified on your own account before use. |
| `InpWindow` | 120 | Bars over which both flows are accumulated. It must span several sessions so both bands gather enough data. |
| `InpVolPeriod` | 100 | Volume average window used to normalise both flows and make them comparable. |
| `InpDivLevel` | 8.00 | Divergence, in equivalent bars, beyond which the two groups are deemed in disagreement. |
| `InpUseRealVolume` | false | With true, real volume is used when available; with false, or in its absence, tick volume. |
## Advantages / strengths
- It separates flow along a dimension, time, that no ordinary volume indicator considers.
- Both components are normalised on the same scale, so their difference is legitimate.
- It explicitly refuses to compute the divergence when either band is empty, instead of producing a false value.
- The documentation openly states that the distinction is a time convention, not a measure of who is trading.
## Limitations and warnings
- The distinction between informed and uninformed money is a convention: the indicator measures when flow happens, not who generates it.
- It depends on the broker server time: a change of broker or the daylight saving switch shifts the bands.
- On continuous markets the notion of an open is arbitrary and the indicator loses much of its meaning.
- Flow is estimated from OHLC and volume, so it inherits all the imprecision of that approximation.
**No repaint:** values printed on a closed bar are never modified afterwards.
**Disclaimer.** This product is a technical analysis tool, not an automated trading system, and it offers no profit guarantee whatsoever. Financial markets carry the risk of total loss of the invested capital. Past performance is not indicative of future results. Every signal must be confirmed with your own analysis, a money management plan and prior testing on a demo account. The author is not responsible for trading decisions taken on the basis of this indicator.
## Suggested tags / keywords for MQL5
`money flow`, `smart money`, `session`, `volume`, `divergence`, `indices`, `no repaint`, `intraday`