Af MACD
- 지표
-
Alexandre Favero
 My Journey in the Financial Market
I began my journey in the financial market in 2006, at a time when access to complete and well-structured educational materials on the subject was scarce. Faced with this gap, my learning came largely through self-directed study and hands-on experience. - 버전: 26.7
MACD and Price Structure Confluence Indicator
The indicator is based on the principles of the MACD in its formula, combined with price structure, support, and resistance levels identified on the D1 (Daily) timeframe.
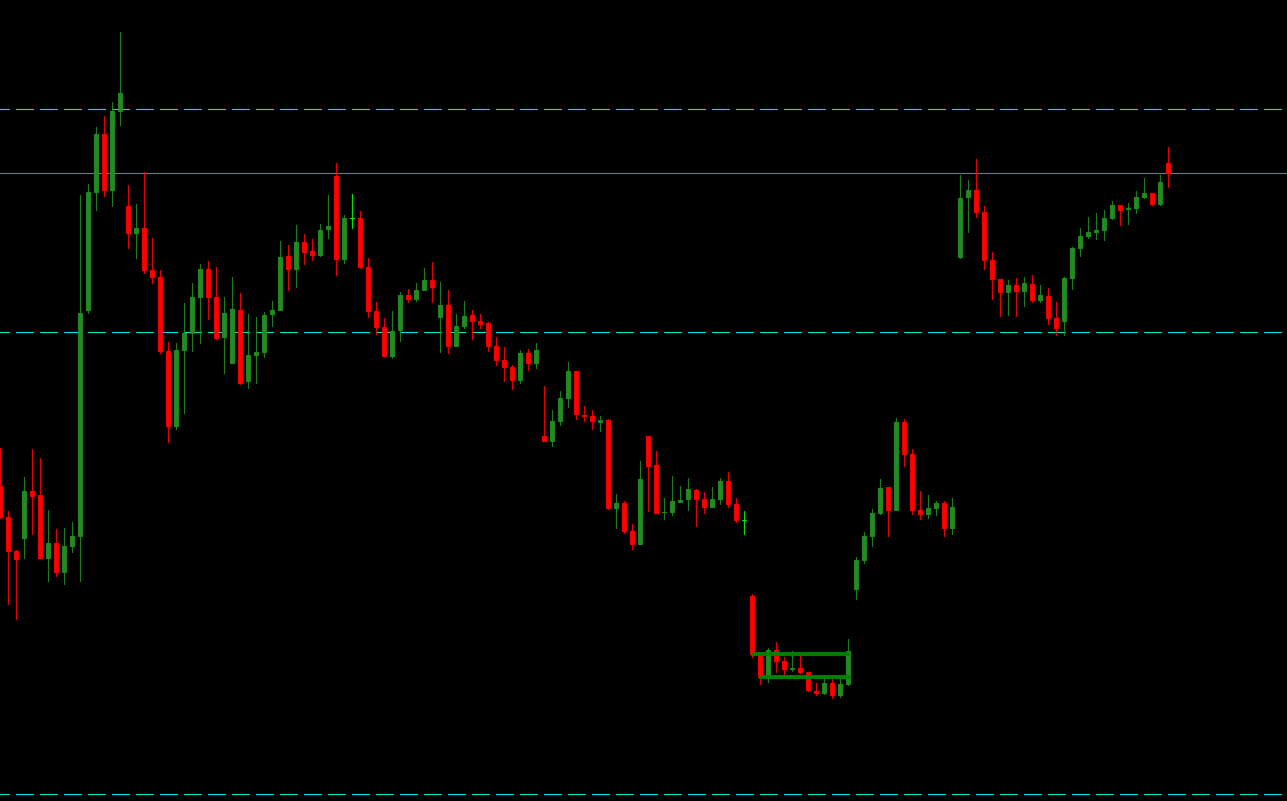
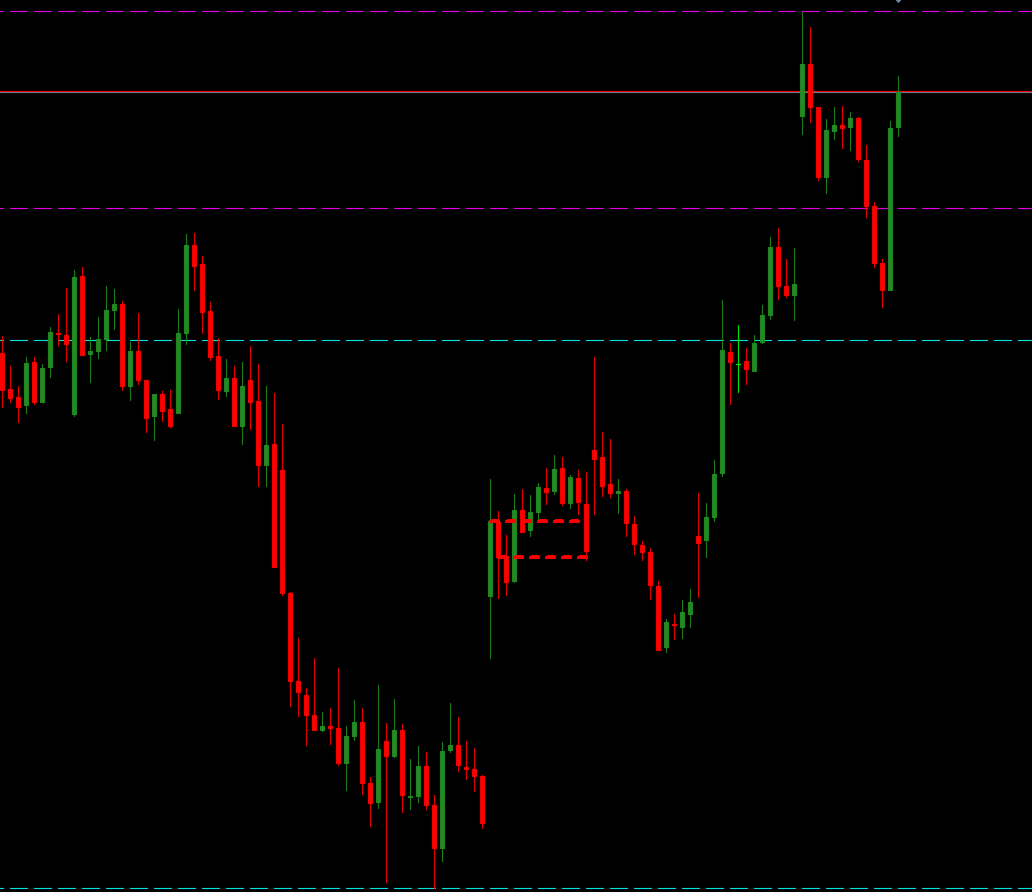
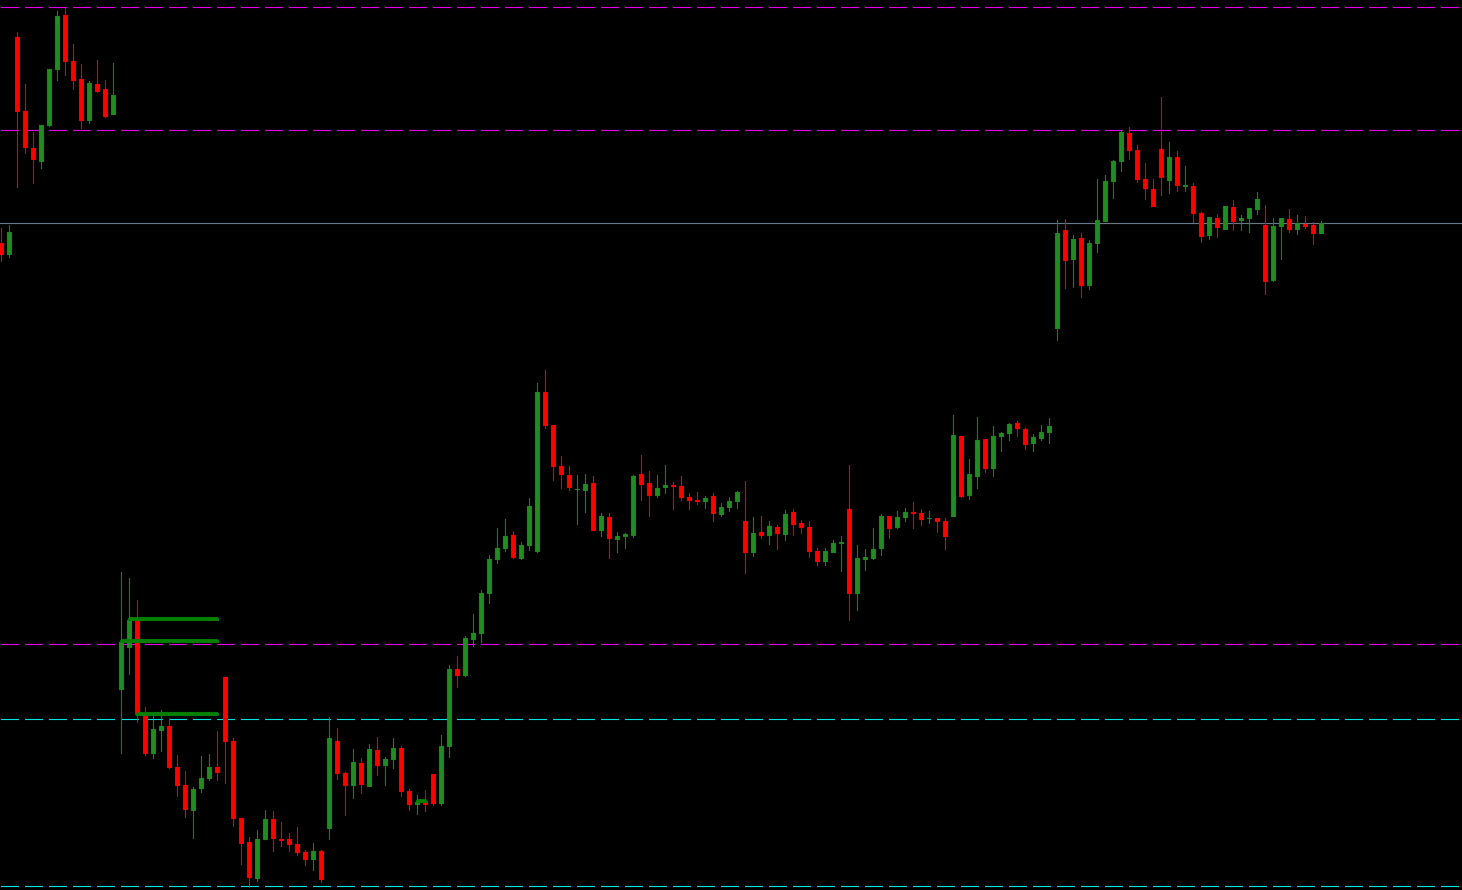
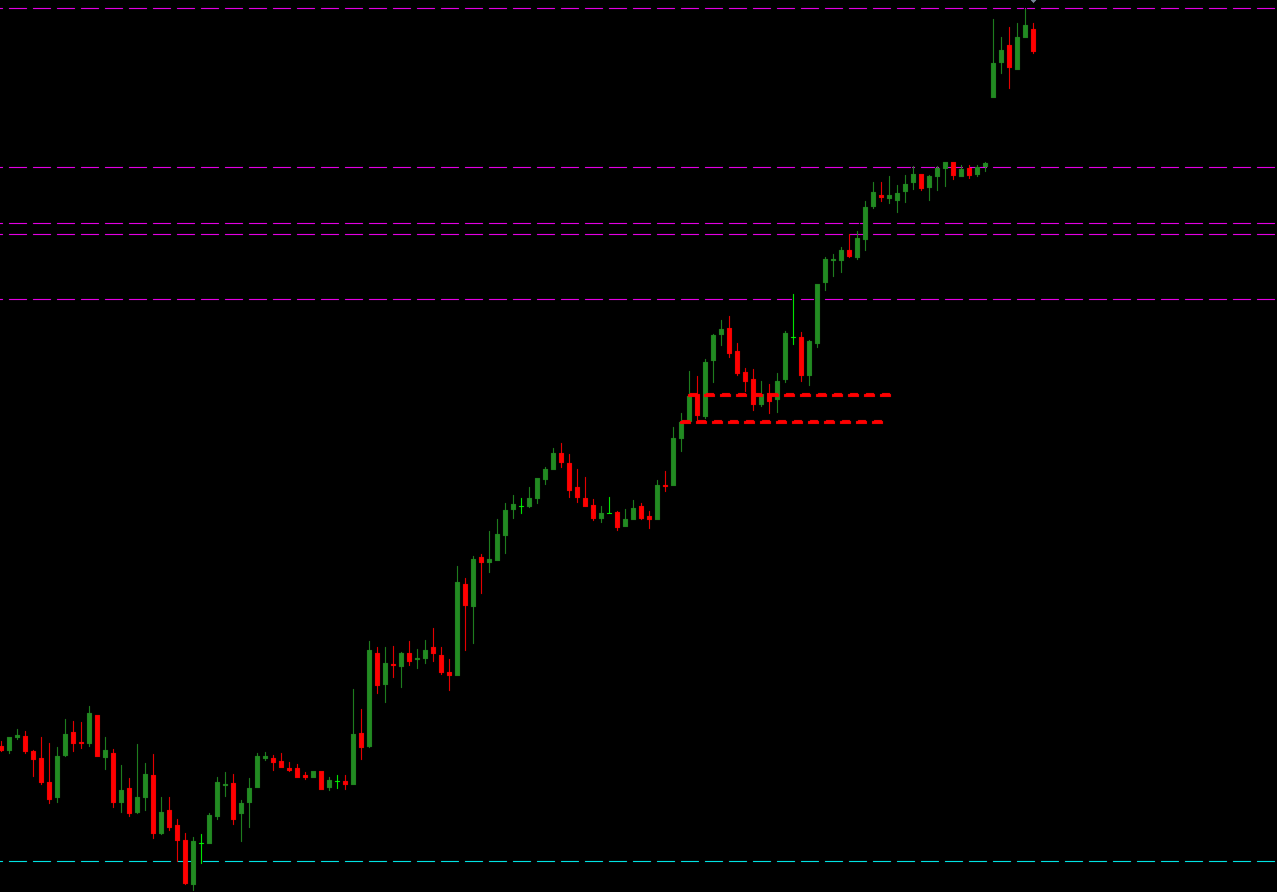
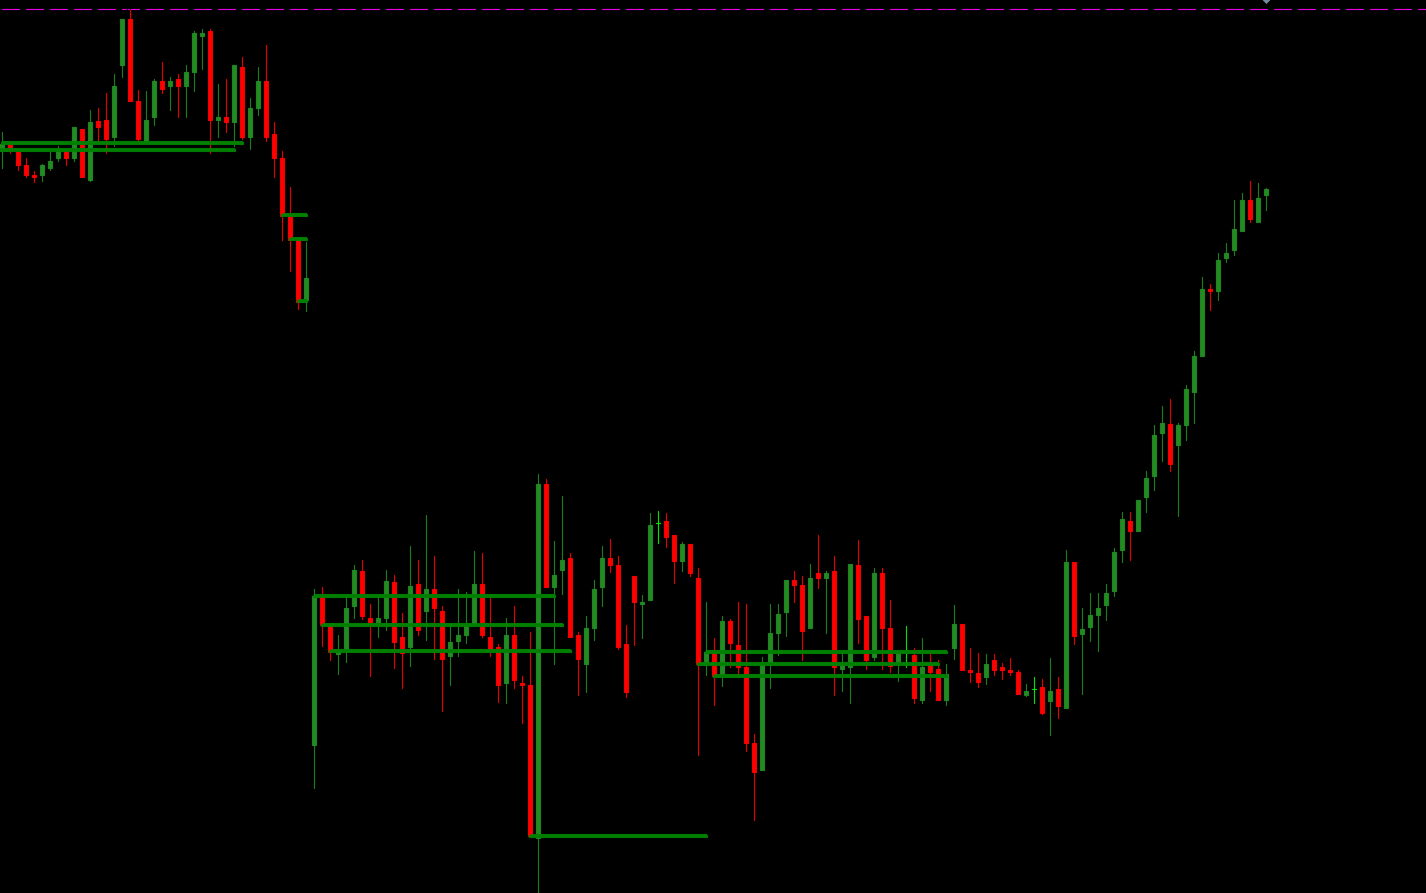
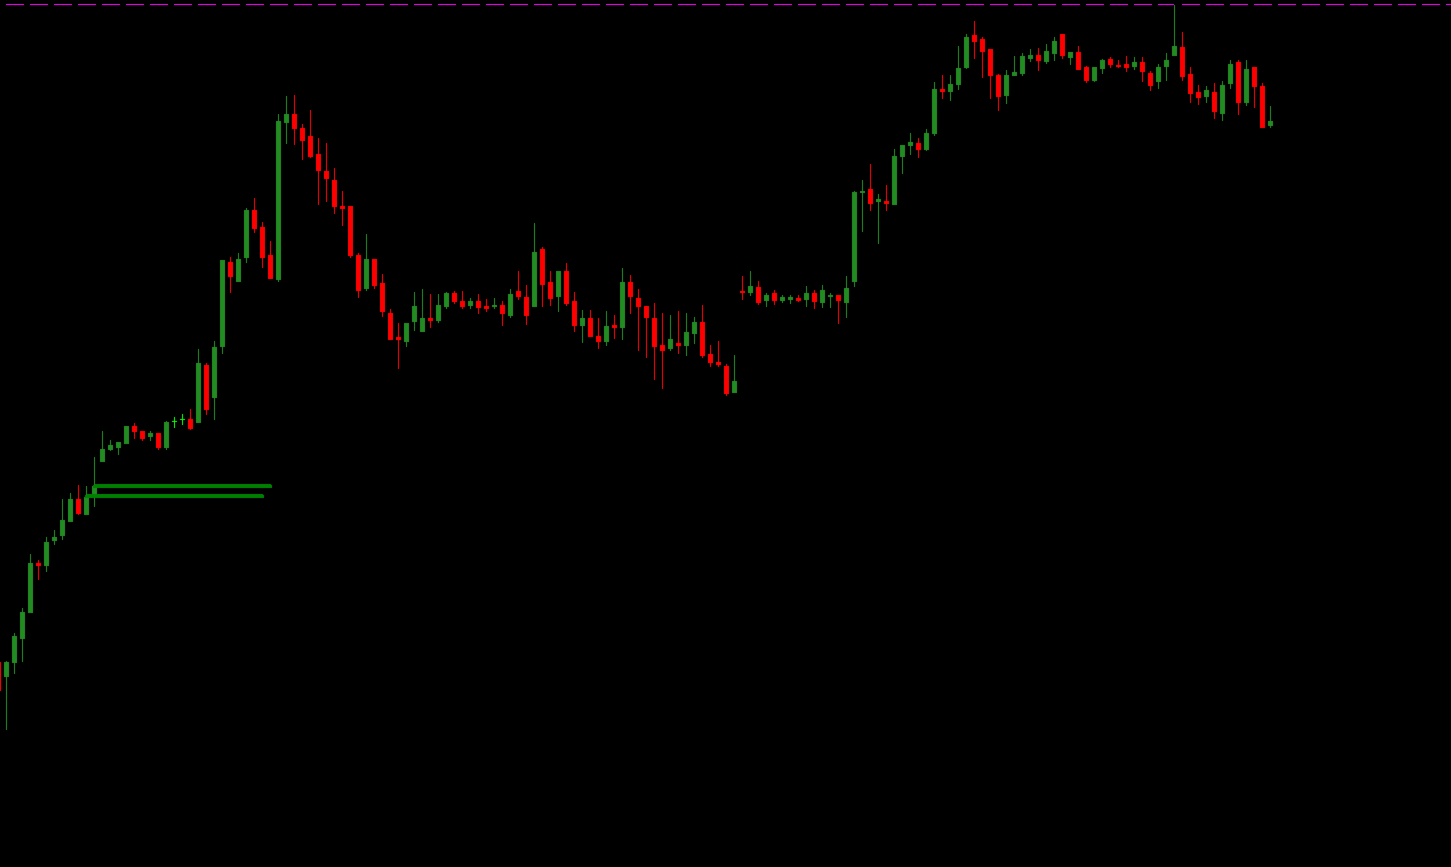
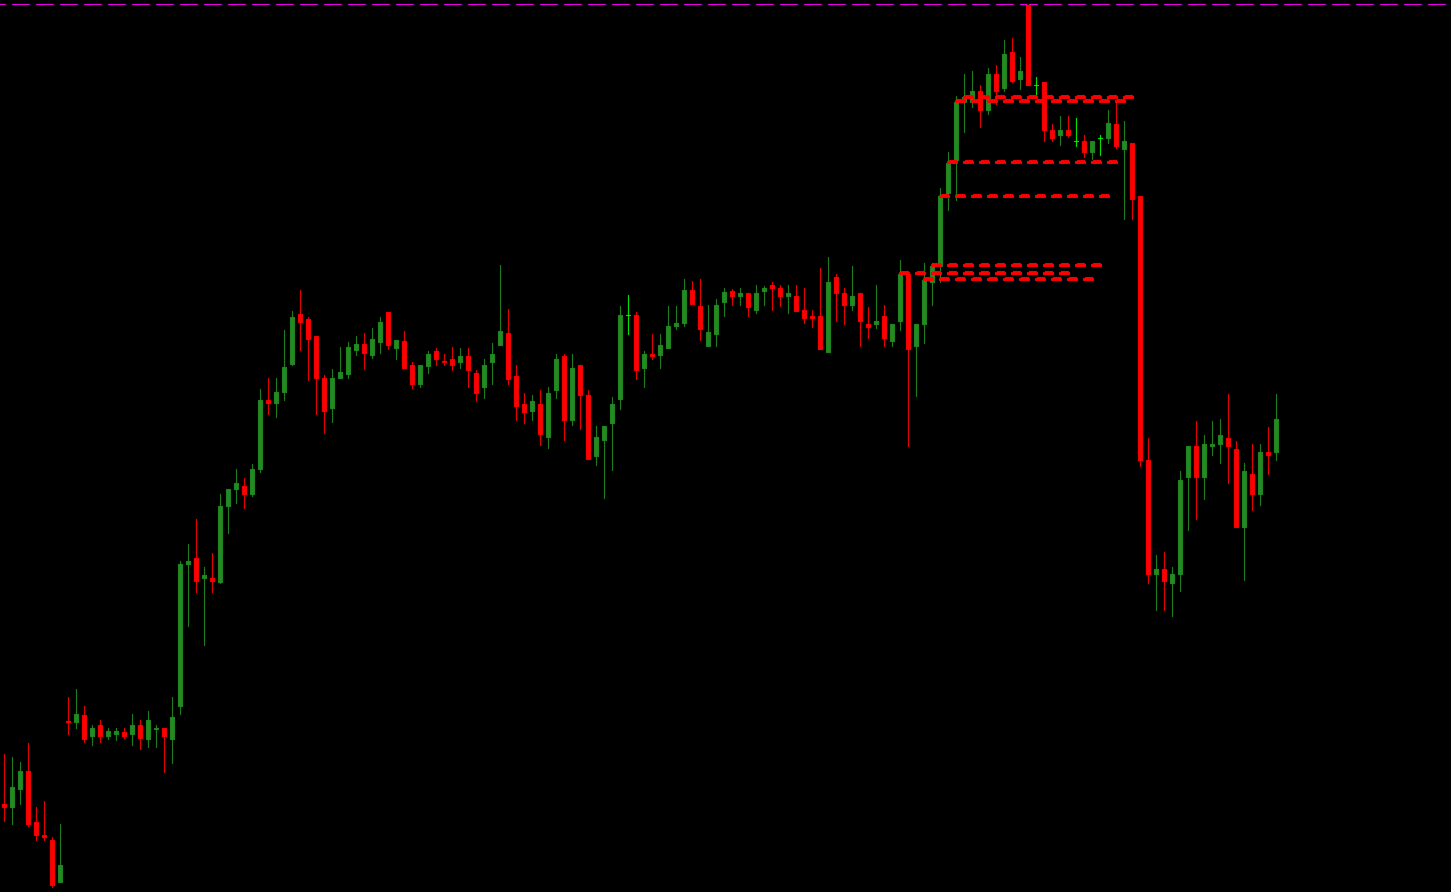
The regions identified by the system are represented by dashed lines extending across the entire chart, allowing users to visually monitor important levels within the market structure.
The system's studies and analysis were primarily conducted using the M30 (30-minute) timeframe. However, the indicator is flexible, allowing each user to test and use the system on other timeframes according to their own methodology, strategy, and study objectives.
When used to study trend continuation or potential trend reversals, the indicator also displays shorter, thicker lines to highlight regions that may require deeper analysis.
⚠️ ATTENTION — SIGNAL INTERPRETATION
The lines should not be used as automatic entry triggers. Their primary purpose is to highlight areas of interest for further study and analysis of price structure.
It is recommended to use the indicator together with the user's own trading system, seeking confluence between different signals and analytical methodologies.
The objective is to assist traders in developing a more comprehensive analysis of support, resistance, trend continuation, and potential reversal areas, without considering any individual line as confirmation for a buy or sell decision.
This indicator is intended for market studies and analysis only and does not constitute investment advice or a guarantee of results.