
Multi Timeframe Trend Dashboard
- 지표
- 버전: 2.11
- 업데이트됨: 17 8월 2026

Multi Timeframe Trend Dashboard
A visual panel that analyzes market trend across 8 timeframes at once — from M1 to D1 — and displays the result live, directly on your chart.
What it does
For each of the 8 timeframes (M1, M2, M5, M15, M30, H1, H4, D1), the indicator runs 6 independent technical checks and takes a "vote": each check votes bullish or bearish, and whichever side gets more votes determines the color shown for that timeframe — green for bullish, red for bearish, gray when tied/undecided.
How it works (the 6 votes)
- Exponential moving averages (EMA 5, 20, and 200) — votes bullish when the averages are stacked in ascending order (5 > 20 > 200), bearish when stacked in descending order
- Swing structure (highs/lows) — checks whether the last 5 candles form rising highs and lows (bullish) or falling highs and lows (bearish)
- ADX + price direction — when ADX signals trend strength (above 20), votes based on whether the current candle closed above or below the previous one
- MACD — votes bullish or bearish based on whether the MACD value is positive or negative
- RSI — votes bullish above 50, bearish below 50
- Last 5 candles bias — counts how many of the last 5 candles closed above their open (bullish bias) or below (bearish bias)
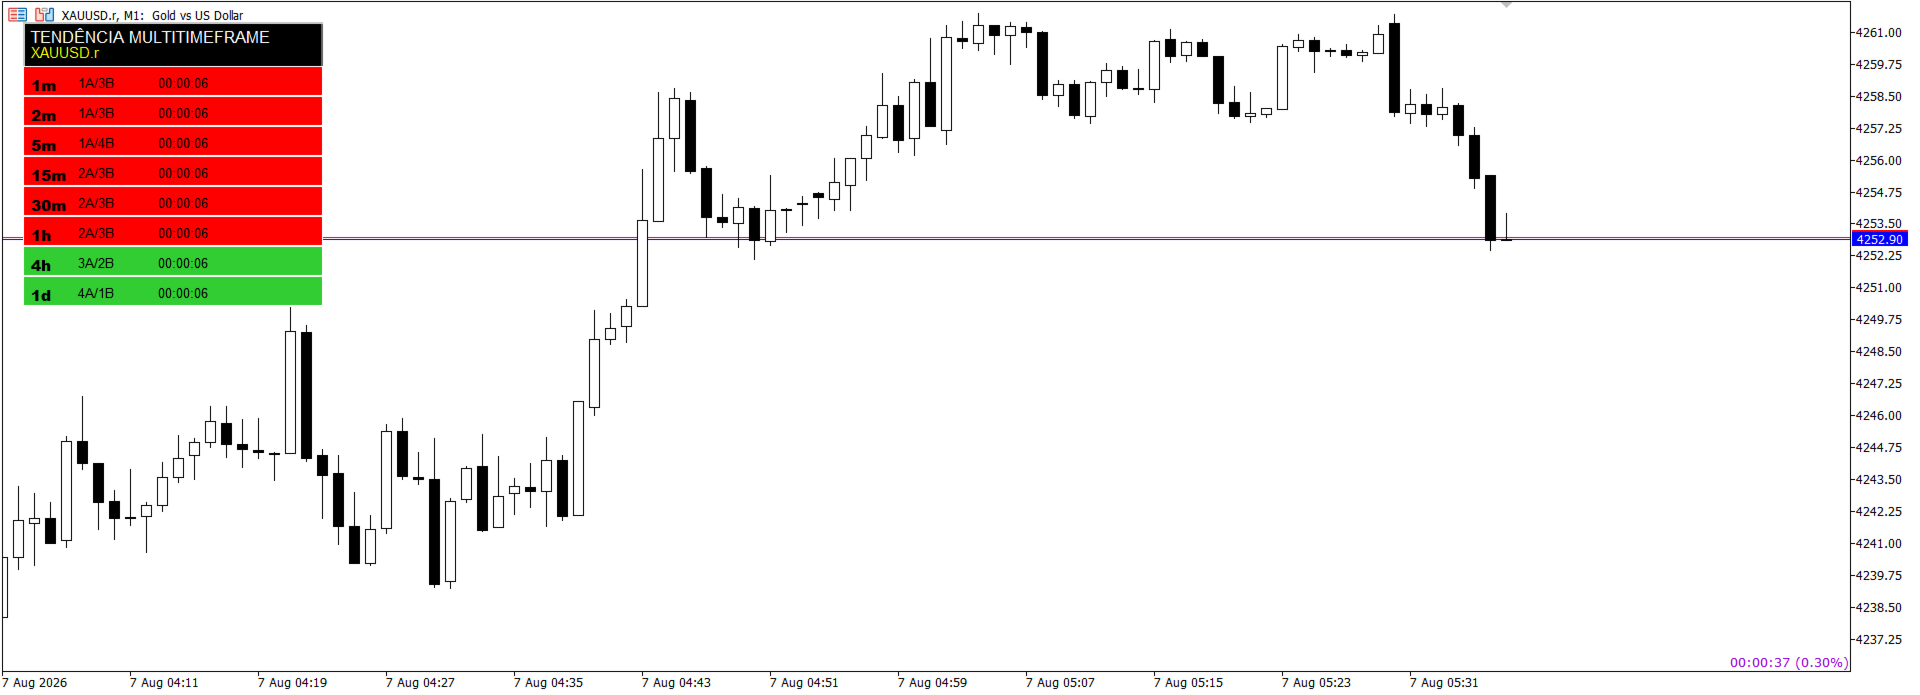
What you see on the panel
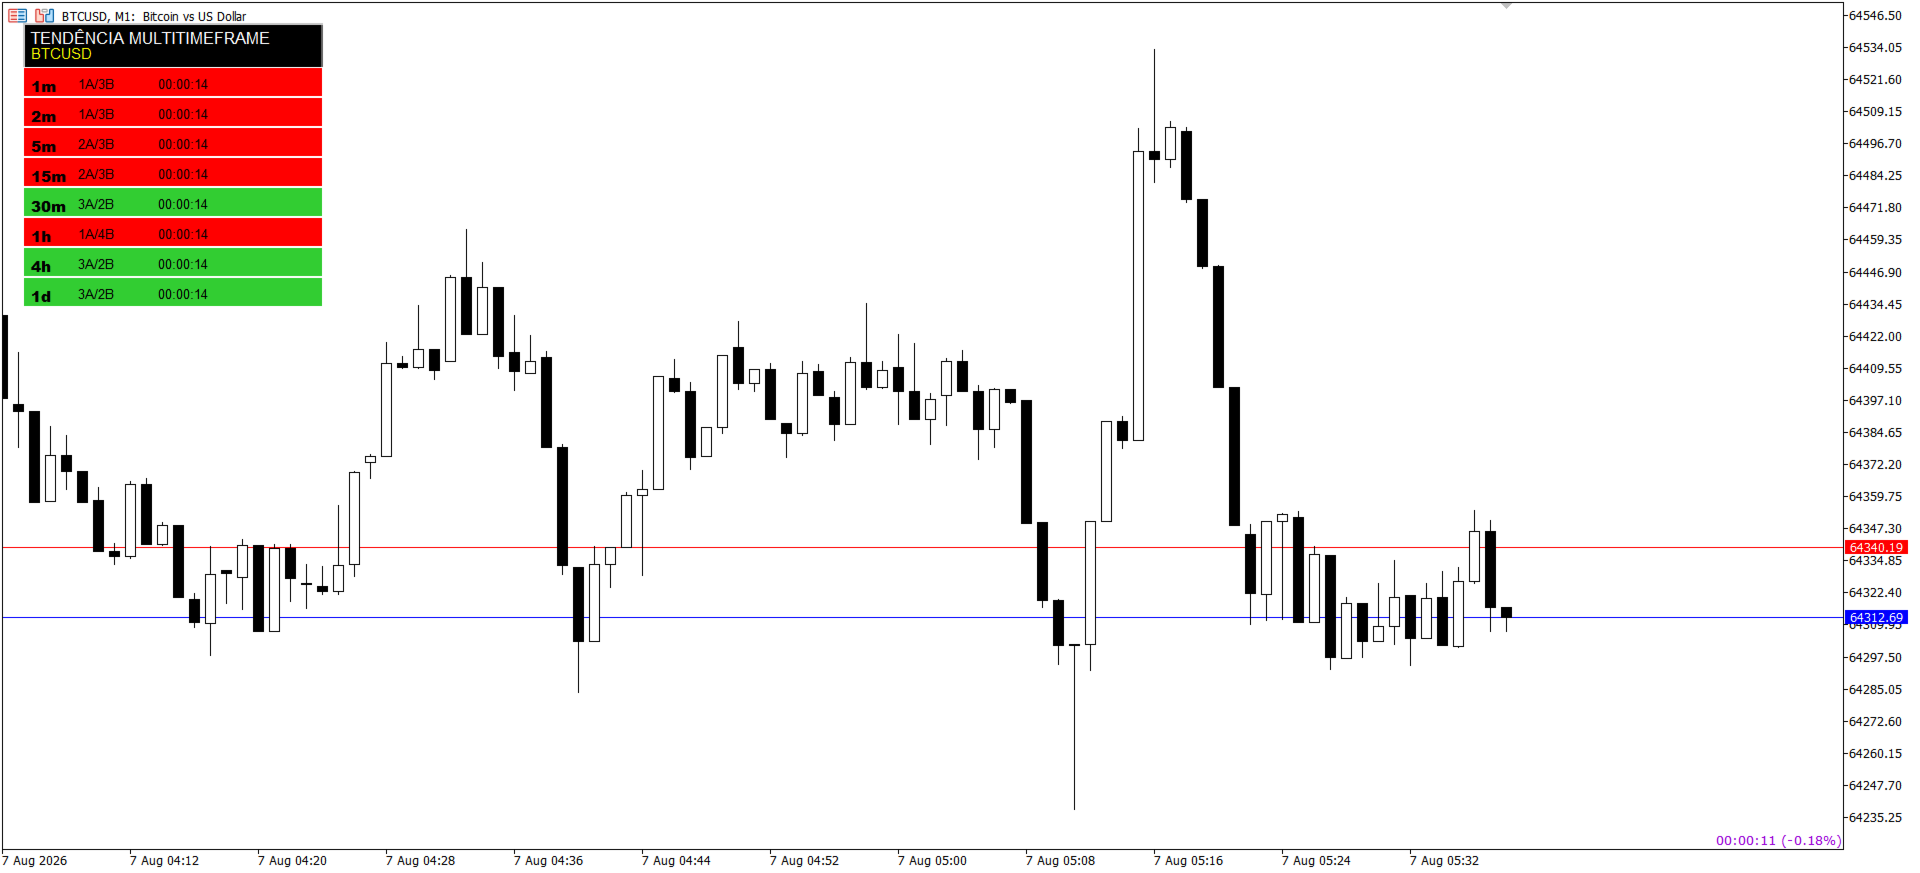
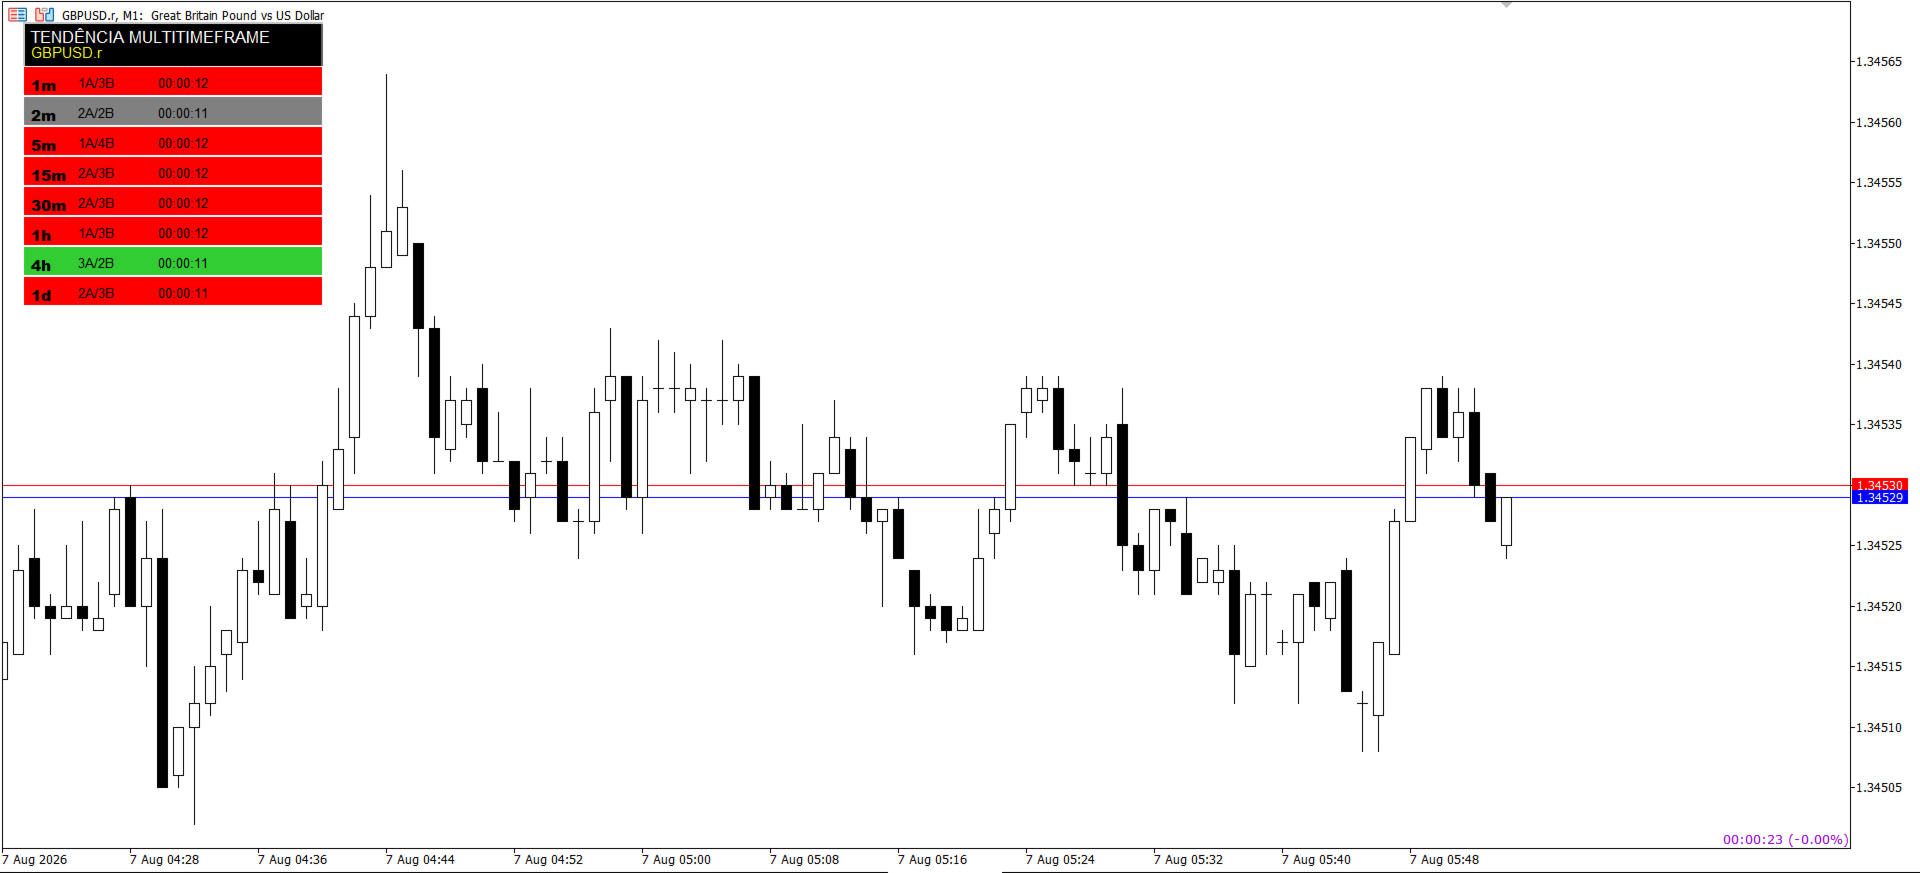
- One box per timeframe, colored according to the vote result
- The vote count (e.g. "4A/2B" = 4 bullish votes, 2 bearish votes)
- A timer showing how long that timeframe has held its current trend — useful for spotting a freshly-formed move versus an already-established one
- Automatic updates on every new tick and every 2 seconds via timer (keeps working even when the market is closed)
Practical features
- Configurable position: set where the panel appears on the chart via the initial position parameters (X and Y), adjustable in the indicator's properties
- Automatic symbol detection: leave the symbol field blank and it defaults to the chart's own symbol; type a name and it automatically resolves broker suffix variations (e.g. XAUUSD → XAUUSD.r, XAUUSD.m)
- Customizable colors: set bullish, bearish, and neutral colors via input parameters
- No trading involved: 100% analytical — it never places any buy or sell order, it's purely a visual decision-support tool
Who it's for
Discretionary traders who use multi-timeframe analysis as part of their entry decision, and want a fast visual read on trend alignment (or misalignment) across timeframes, without constantly switching charts.





























SMC + Multi Timeframe Trend Dashboard 🔥 Great combo thanks sir