
Yoshi Adaptive RSI
- 지표
-
Le Quang Thanh
 Professional Trading Tools for MetaTrader 5
I specialize in developing high-quality indicators and Expert Advisors for MetaTrader 5, inspired by well-known trading methodologies used by professional traders and market researchers around the world. - 버전: 1.2
Yoshi Adaptive RSI
Adaptive Confirmed Momentum for MetaTrader 5
Momentum tools are useful only when their signals are read in context. A standard RSI can react quickly to small price changes while the current candle is still forming. That may tempt traders to act before the move is confirmed. The real challenge is not simply finding an overbought or oversold reading, but understanding whether momentum is holding, weakening, or leaving an extreme area at a meaningful point on the chart.
Yoshi Adaptive RSI is an adaptive RSI indicator and manual decision-support tool for MetaTrader 5. It combines an adaptive momentum line, a secondary signal line, configurable overbought and oversold levels, confirmed zone-exit markers, and practical alerts. It does not open or manage trades. The trader remains responsible for market context, entry selection, risk, and trade management.
Why an Adaptive RSI Approach MattersMarket behavior is not constant. A short RSI period may become too sensitive during noisy conditions, while a longer period may react too slowly when momentum changes. Yoshi Adaptive RSI addresses this by evaluating a configurable range of RSI lengths and maintaining a more continuous reading from one completed candle to the next.
The goal is not to predict price. It is to reduce unnecessary reaction to minor fluctuations and present momentum in a calmer, more organized form. Final smoothing improves readability without turning the indicator into a complicated trading system.
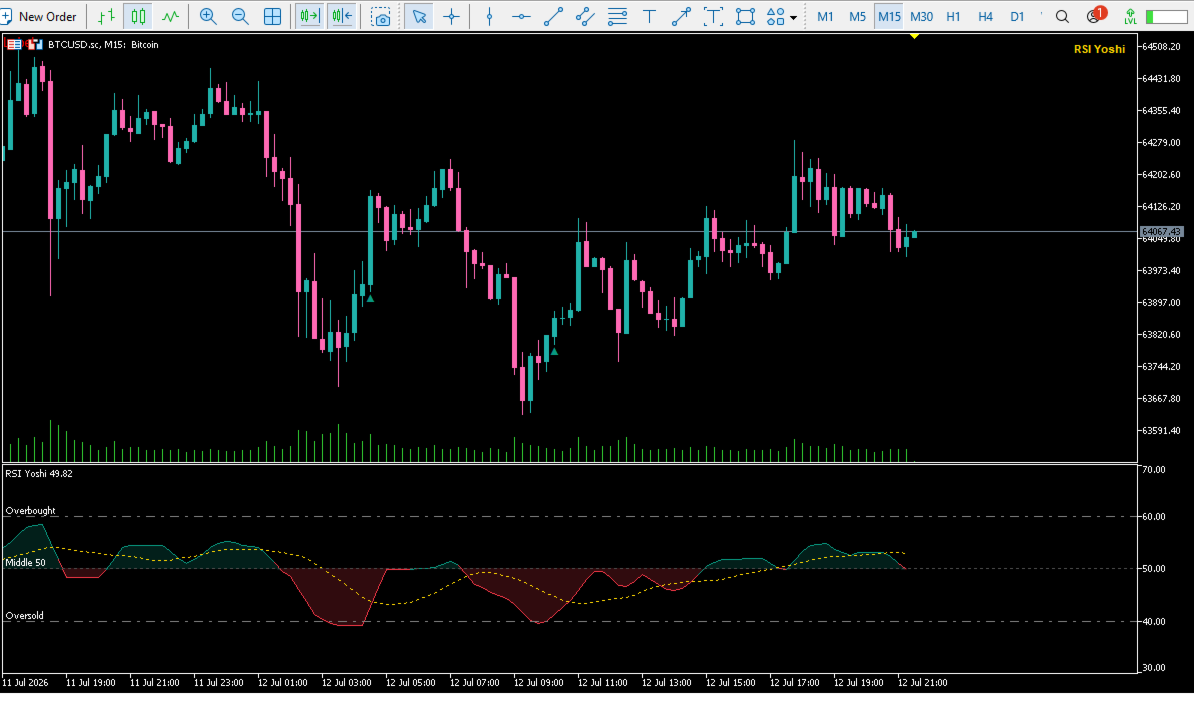
Reading Momentum in PracticeThe main RSI line changes color around the 50 center level. Readings above 50 show positive momentum context, while readings below 50 show negative momentum context. A soft fill around the center line makes these shifts easier to recognize without crowding the chart.
The overbought and oversold levels are adjustable, with defaults of 60 and 40. A bullish triangle appears when the confirmed RSI crosses upward out of the oversold zone. A bearish triangle appears when the confirmed RSI crosses downward out of the overbought zone.
These markers represent completed momentum transitions. They are not automatic Buy or Sell instructions and do not guarantee a reversal. Their value depends on location. A bullish exit may deserve more attention near support or after a pullback. A bearish exit may be more relevant near resistance or when upward momentum starts to fade.
The dotted signal line provides a slower reference for momentum pace. It can help users see whether momentum is expanding, stabilizing, or losing strength. Signal triangles are based on zone exits, not on crossovers between the RSI line and the signal line.
Confirmed-Bar DisciplineYoshi Adaptive RSI evaluates signals after the candle has closed. The active candle is not treated as a completed signal, and markers and alerts are processed only when the bar is confirmed. This helps prevent temporary intrabar movement from being presented as a finished momentum event.
Closed-bar confirmation has a trade-off: the signal appears later than an intrabar reaction. That delay is intentional, but it does not remove the need to assess trend, price structure, support and resistance, volatility, and risk.
Key Features· Adaptive RSI calculation across a configurable length range
· Confirmed zone-exit signals on completed candles
· Adjustable overbought and oversold levels with an optional 50 center line
· Bullish and bearish triangles on the main chart
· Secondary dotted signal line
· Automatic balanced scaling
· Theme-aware colors
· Popup, sound, and push notifications
A Practical WorkflowStart with the chart, not the signal. Identify whether price is trending, ranging, approaching a key level, or reacting after a strong move. Then check whether the indicator is above or below 50 and whether momentum is approaching or leaving an extreme zone.
When a confirmed triangle appears, evaluate where it formed and whether it supports your method. Define the invalidation level, position size, and management plan before considering an entry. If the signal has no clear context or requires excessive risk, waiting is also a valid decision.
Who It Is ForThis MT5 momentum indicator is designed for discretionary traders who use RSI, price action, trend analysis, support and resistance, or pullback logic as part of a structured process. It can be tested on different symbols and timeframes, but behavior may vary with broker data and market conditions.
Yoshi Adaptive RSI is not an Expert Advisor, a market-structure detector, or an automatic trade planner. It does not identify exact tops and bottoms, provide Stop Loss or Take Profit levels, or replace disciplined risk management.
Explore More Yoshi Trading ToolsMore MetaTrader 5 indicators and strategy-focused tools are available on the Ichiyoshi MQL5 Seller page:
https://www.mql5.com/en/users/ichiyoshi/seller
Risk Notice
Trading Forex, CFDs, metals, indices, and cryptocurrencies involves risk. No indicator can guarantee future results. Test the product on a demo account and use position sizing that matches your own trading plan and risk tolerance.









































사용자가 평가에 대한 코멘트를 남기지 않았습니다