Risk Panel Visual Risk Manager
- 지표
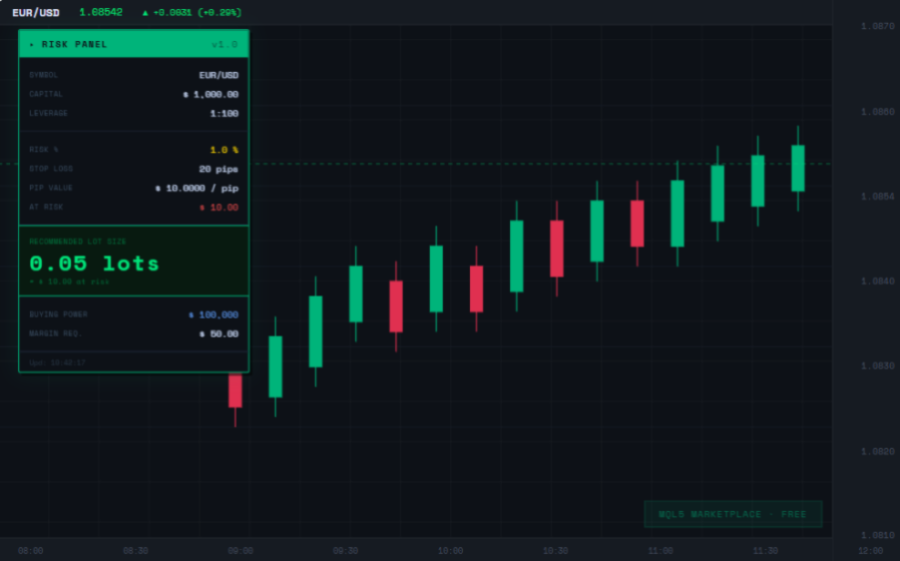
- 버전: 1.0

Stop guessing your lot size. Risk Panel calculates it for you in real time, directly on your chart.
Risk Panel is a lightweight indicator that displays a professional dashboard on your MetaTrader 5 chart. Every time you open a trade, you instantly know how many lots to use to respect your risk management rules.
WHAT IT SHOWS:
- Exact lot size calculated from your capital, risk percentage and stop loss
- Capital at risk in USD — know exactly how much money you are risking per trade
- Real pip value — auto-calculated for any symbol
- Buying power based on your account leverage
- Required margin for the calculated position
- Updates automatically on every tick
WHY TRADERS NEED THIS:
Most traders risk too much or too little per trade because they calculate lot sizes manually or use rough estimates. Risk Panel eliminates that mistake by doing the math automatically and keeping the result visible on your chart at all times.
HOW TO USE:
1. Attach Risk Panel to any chart
2. Set your risk percentage and stop loss pips in the settings
3. The panel automatically reads your account balance and leverage
4. The correct lot size appears instantly on screen
SETTINGS:
- Capital: set a fixed amount or use 0 to read your real account balance automatically
- Risk %: percentage of capital to risk per trade (default 1%)
- Stop Loss: your planned stop loss in pips
- Leverage: set manually or use 0 to read from your account automatically
- Panel position: adjust X and Y coordinates to place the panel anywhere on the chart
- Full color customization to match any chart theme
COMPATIBLE WITH:
- All Forex pairs (EUR/USD, GBP/USD, USD/JPY and more)
- Gold (XAUUSD) and Silver (XAGUSD)
- Indices and CFDs
- Any broker using MetaTrader 5
No DLL required. No external connections. No repainting.
Works on any timeframe and any symbol.