Pro Support Resistance j4f
- 지표
- 버전: 10.0
- 활성화: 5

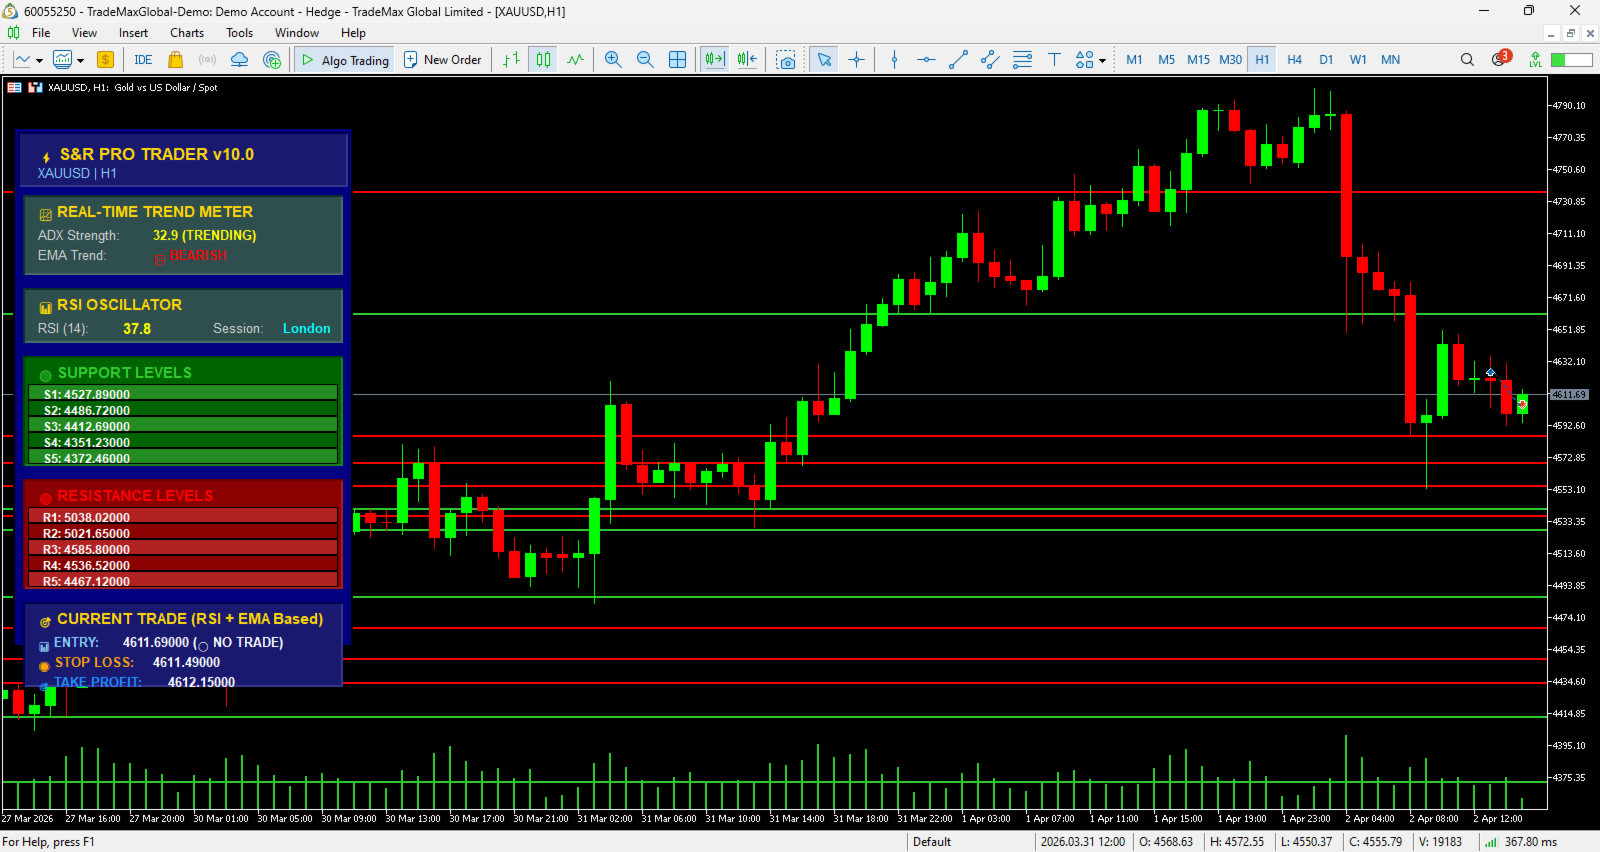
ProSR Elite MTF is a complete trading assistant for MetaTrader 5 designed for Forex, Gold, Indices, Crypto, Oil, and Stocks.
The indicator automatically detects strong support and resistance zones, confirms trend direction using EMA crossover, checks momentum with RSI, measures trend strength with ADX, and then gives clear buy and sell signals directly on the chart.
It is suitable for:
- EURUSD and major Forex pairs
- XAUUSD (Gold)
- BTCUSD and Crypto
- US30, NASDAQ, SP500
- Oil and Commodities
- Stocks and CFDs
The indicator is designed to work on all timeframes, but performs best on:
- M15
- M30
- H1
- H4
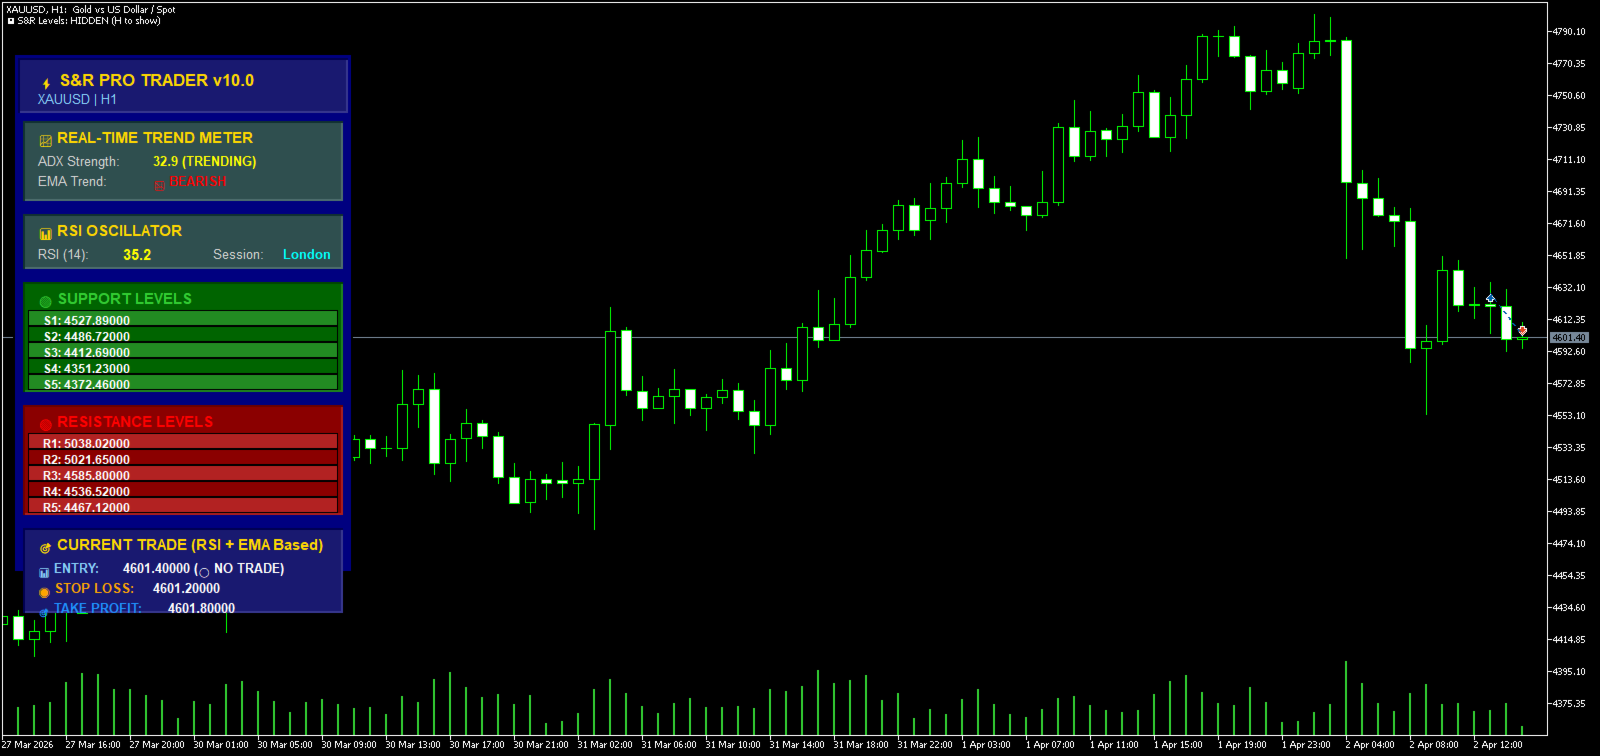
1. Automatic Support & Resistance Detection
The indicator scans historical price action and automatically draws the nearest support and resistance levels.
Features:
- Dynamic support zones
- Dynamic resistance zones
- Automatically updates when price changes
- Works on all markets and timeframes
- Levels can be hidden or shown by pressing the H key
2. RSI Market Strength Filter
The indicator displays the current RSI value on the dashboard and uses it to detect overbought and oversold conditions.
RSI Logic:
- RSI below oversold level = possible BUY zone
- RSI above overbought level = possible SELL zone
Color Coding:
- Green = bullish/oversold area
- Red = bearish/overbought area
- Yellow = neutral
3. EMA Trend Confirmation
The indicator uses fast and slow EMA crossover to determine the market trend.
Trend Rules:
- Fast EMA above Slow EMA = Bullish Trend
- Fast EMA below Slow EMA = Bearish Trend
Dashboard shows:
- BULLISH
- BEARISH
This helps filter false signals and trade only in the direction of the trend.
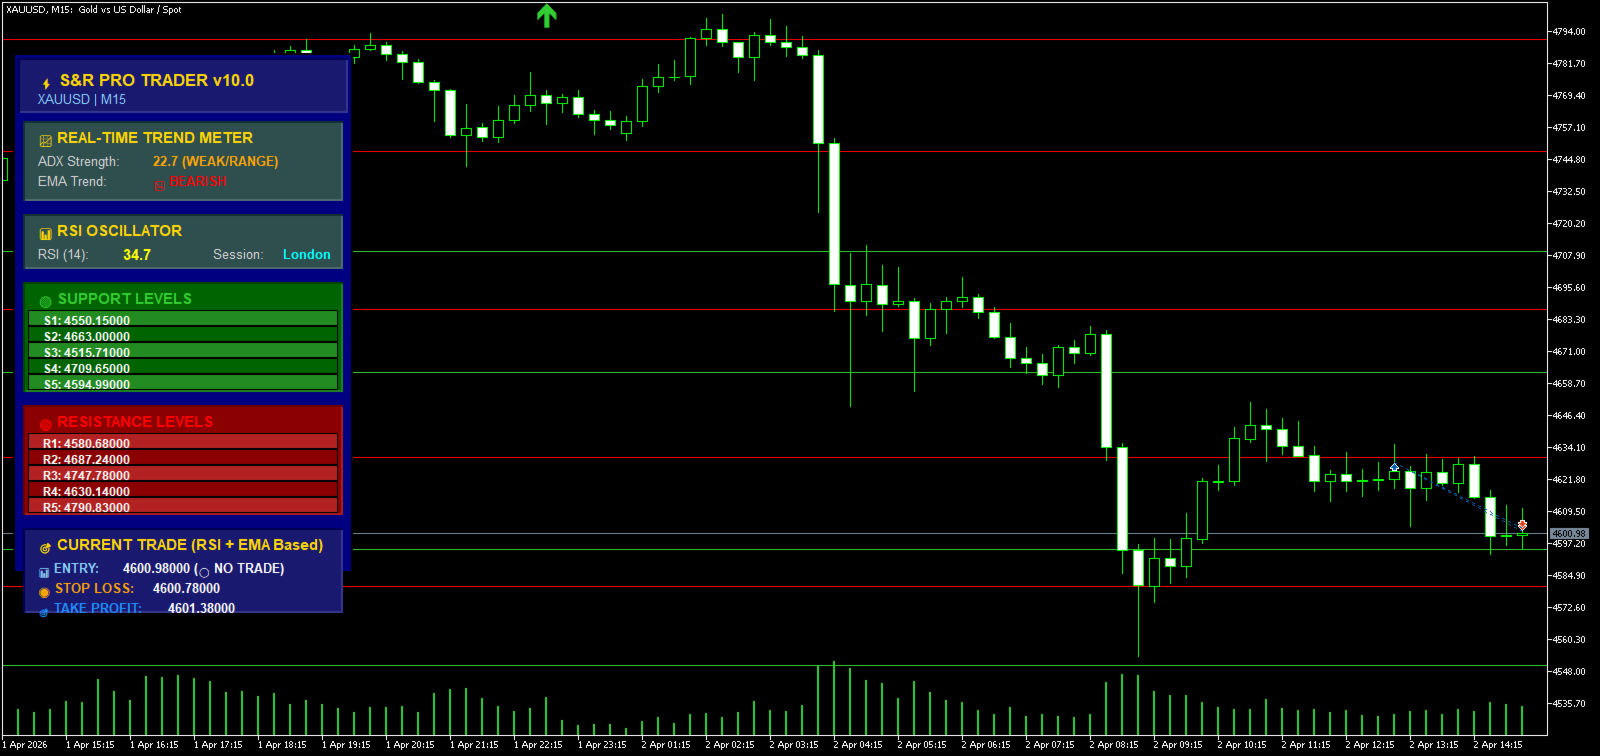
4. ADX Trend Strength Filter
The built-in ADX filter measures how strong the market trend is.
Dashboard Strength Levels:
- STRONG
- TRENDING
- WEAK
Example:
- Strong ADX + Buy Signal = Higher probability trade
- Weak ADX = Avoid entering low-quality trades
5. Smart Buy & Sell Signals
The indicator draws arrows directly on the chart.
BUY Signal Conditions:
- RSI is oversold
- EMA trend is bullish
- Price bounces from support
- Optional H1 and M15 confirmation
SELL Signal Conditions:
- RSI is overbought
- EMA trend is bearish
- Price rejects from resistance
- Optional H1 and M15 confirmation
Signal Display:
- Green Arrow = BUY
- Red Arrow = SELL
6. Signal Strength Rating
Each signal is rated based on confirmation quality.
Strength Levels:
- STRONG
- MODERATE
- WEAK
A STRONG signal means:
- Main timeframe agrees
- Multi-timeframe confirmation agrees
- ADX is strong
- Trend direction is confirmed
7. Multi-Timeframe Confirmation
Optional confirmation from higher and lower timeframes increases accuracy.
Available Confirmation:
- H1 confirmation
- M15 confirmation
Example:
- Current timeframe gives BUY
- H1 trend also bullish
- M15 momentum also bullish
- Signal becomes STRONG
8. Built-In Risk Management
The indicator includes automatic position size calculation based on your chosen risk percentage.
You can set:
- Account risk %
- Stop loss distance
- Position size calculation
Suitable for:
- Small accounts
- Large accounts
- Prop firm accounts
9. Professional Dashboard
A complete dashboard is shown on the chart.
Dashboard Displays:
- Current RSI value
- EMA trend direction
- ADX strength
- Current signal type
- Signal strength
- Support level
- Resistance level
- Suggested risk information
10. Alert System
The indicator can notify you when a new trading signal appears.
Available Alerts:
- Popup alert
- Mobile notification
- Sound alert
This allows you to monitor the market without staying in front of the screen.
- Easy to use
- Beginner friendly
- Professional quality
- Works on multiple markets
- Combines trend + momentum + support/resistance
- Reduces false entries
- Multi-timeframe confirmation for higher accuracy
- Clean and modern chart display
Scalping
- Timeframe: M15
- RSI: 14
- EMA Fast: 20
- EMA Slow: 50
- ADX: 14
Intraday Trading
- Timeframe: H1
- RSI: 14
- EMA Fast: 50
- EMA Slow: 200
- ADX: 14
Swing Trading
- Timeframe: H4
- RSI: 14
- EMA Fast: 50
- EMA Slow: 200
- RSI Period
- Overbought Level
- Oversold Level
- Fast EMA Period
- Slow EMA Period
- ADX Period
- Risk Percentage
- Enable Alerts
- Enable Notifications
- Enable Multi-Timeframe Confirmation
- Enable Support/Resistance Levels
- Level Line Colors
- Arrow Size
- Dashboard Position
- Copy the indicator file into the MT5 Indicators folder.
- Restart MetaTrader 5.
- Open any chart.
- Drag the indicator onto the chart.
- Adjust settings if needed.
- This indicator does not repaint after candle close.
- Best results are achieved after the candle closes.
- Use proper money management.
- No indicator guarantees 100% winning trades.
- Recommended to test on demo account before live trading.