Trade Visuals
- 지표
- 버전: 1.42
- 업데이트됨: 12 5월 2026

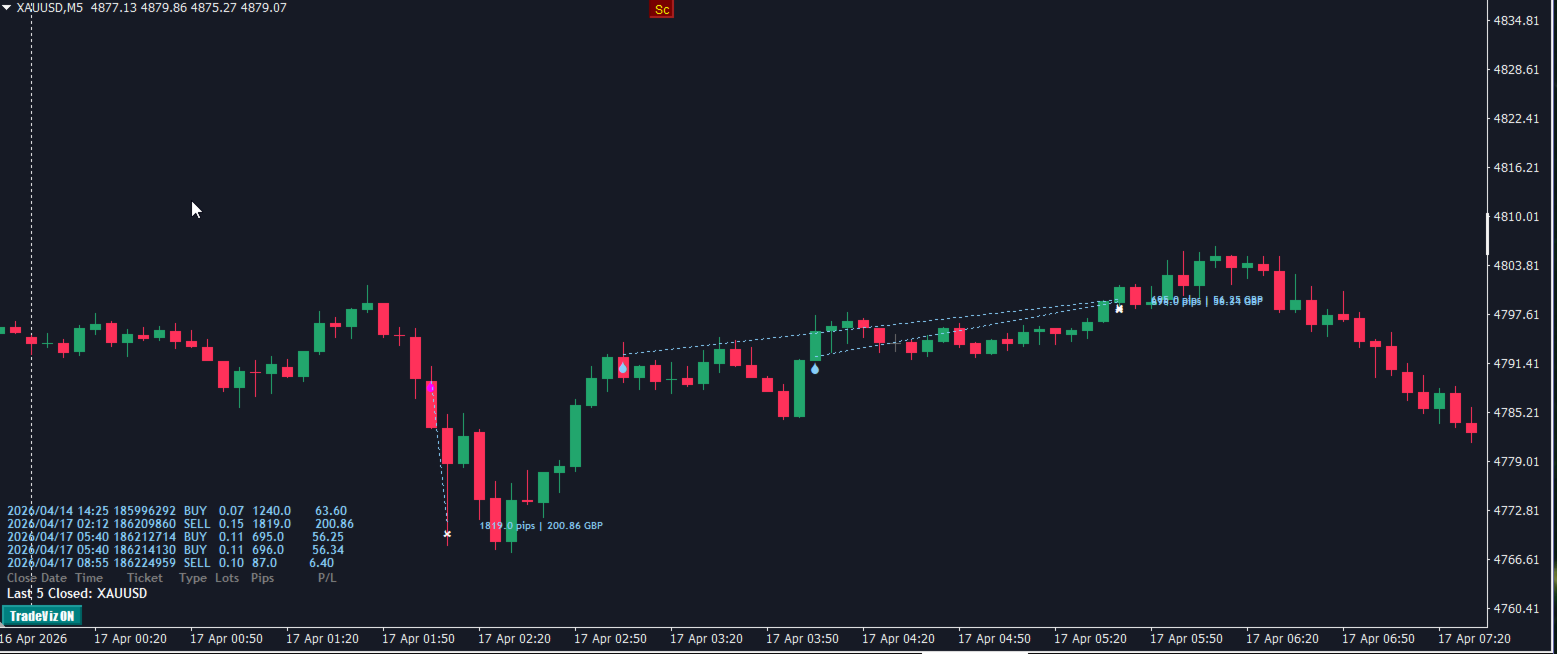
Trade Visuals is a dynamic chart-based indicator for MetaTrader 4, designed to visually display recent trades directly on the chart.
It includes:
- Trade arrows for entry and exit points, color-coded by direction and profit/loss.
- Dotted lines connecting open and closed trades.
- Profit/loss labels in pips and currency.
- Interactive toggle button to show/hide drawings.
- Trade history panel showing time, ticket, type, lot size, pips, and P/L.
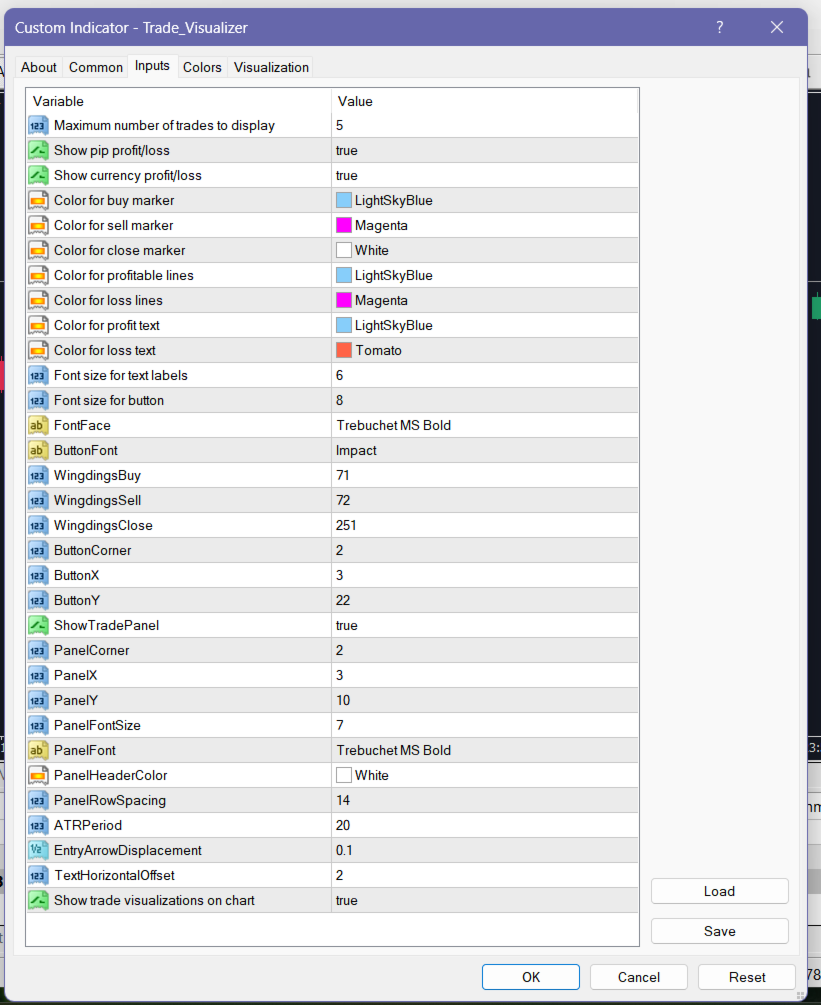
- Customizable appearance via inputs for colors, fonts, and layout.
Handles both open positions and closed deals, with correct inversion logic for deal types.
This tool is ideal for traders who want a clear, visual summary of their trading activity without digging through the terminal history.
TradeVisualizer is a lightweight indicator.
It will not slow down MT4, even on older machines.
Why?
No heavy loops
No tick‑based processing
Only simple chart objects
Efficient cleanup
Minimal indicator handles (only ATR)
사용자가 평가에 대한 코멘트를 남기지 않았습니다