ClearEdge HUD MT4
- 지표
- 버전: 1.25
- 업데이트됨: 17 5월 2026
- 활성화: 10

ClearEdge HUD MT4
Market structure, momentum, flow, and trade-quality scoring in one clean trading HUD.
ClearEdge HUD MT4 is a professional market-intelligence panel for MetaTrader 4. It helps traders read market direction, structure, momentum, volatility, session context, and trade quality directly beside live price action.
Instead of filling the chart with multiple indicators, ClearEdge condenses the key trading conditions into one vertical dashboard and one simple score:
0 to 8 Trade Confluence Score
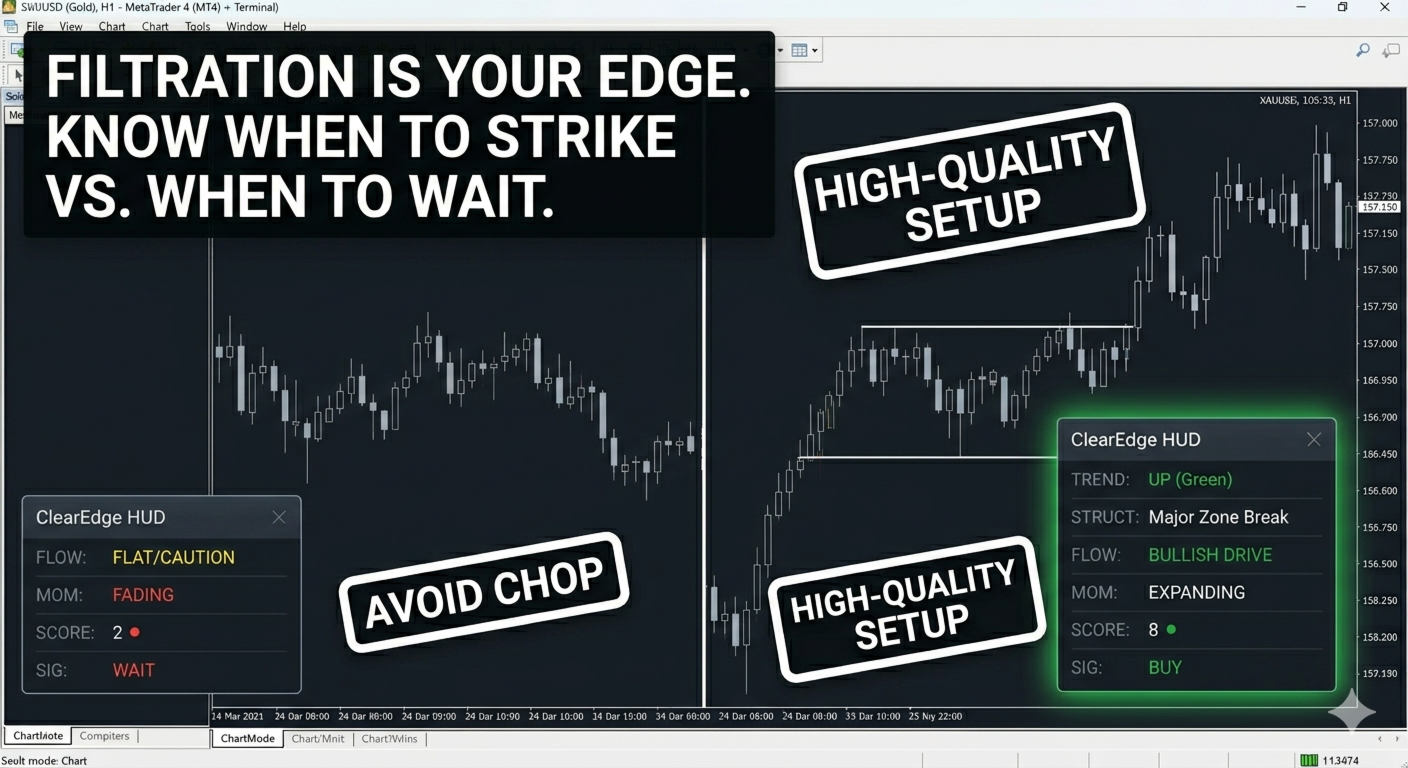
The goal is simple:
Is the market aligned? Is the setup strong enough? Is this a trade condition or a wait condition?
ClearEdge is designed for traders who want a cleaner way to judge market quality before entering a trade.
What the HUD Shows
ClearEdge displays a compact reading beside the chart with the main conditions that matter before execution.
The HUD can show:
Trend direction
Market structure
Major structure zones
Momentum condition
Volatility /
flow context
RSI bias
Higher-level confirmation
Signal decision
Trade score ENTRY / SL / TP reference levels
This gives traders a structured view of the market without needing to switch between several separate indicators.
The Trade Score
ClearEdge uses a clear scoring system from 0 to 8.
The score helps traders understand whether conditions are weak, mixed, or strongly aligned.
Typical reading:
SIGNAL: BUY 6/8
Plain English:
Most of the important market conditions are aligned bullish, but not every filter is confirmed.
Another example:
SIGNAL: WAIT 0/8
Plain English:
There is no valid execution setup. The market may be mixed, weak, or not aligned enough to justify a trade.
This makes the HUD useful not only for finding trades, but also for knowing when to stay out.
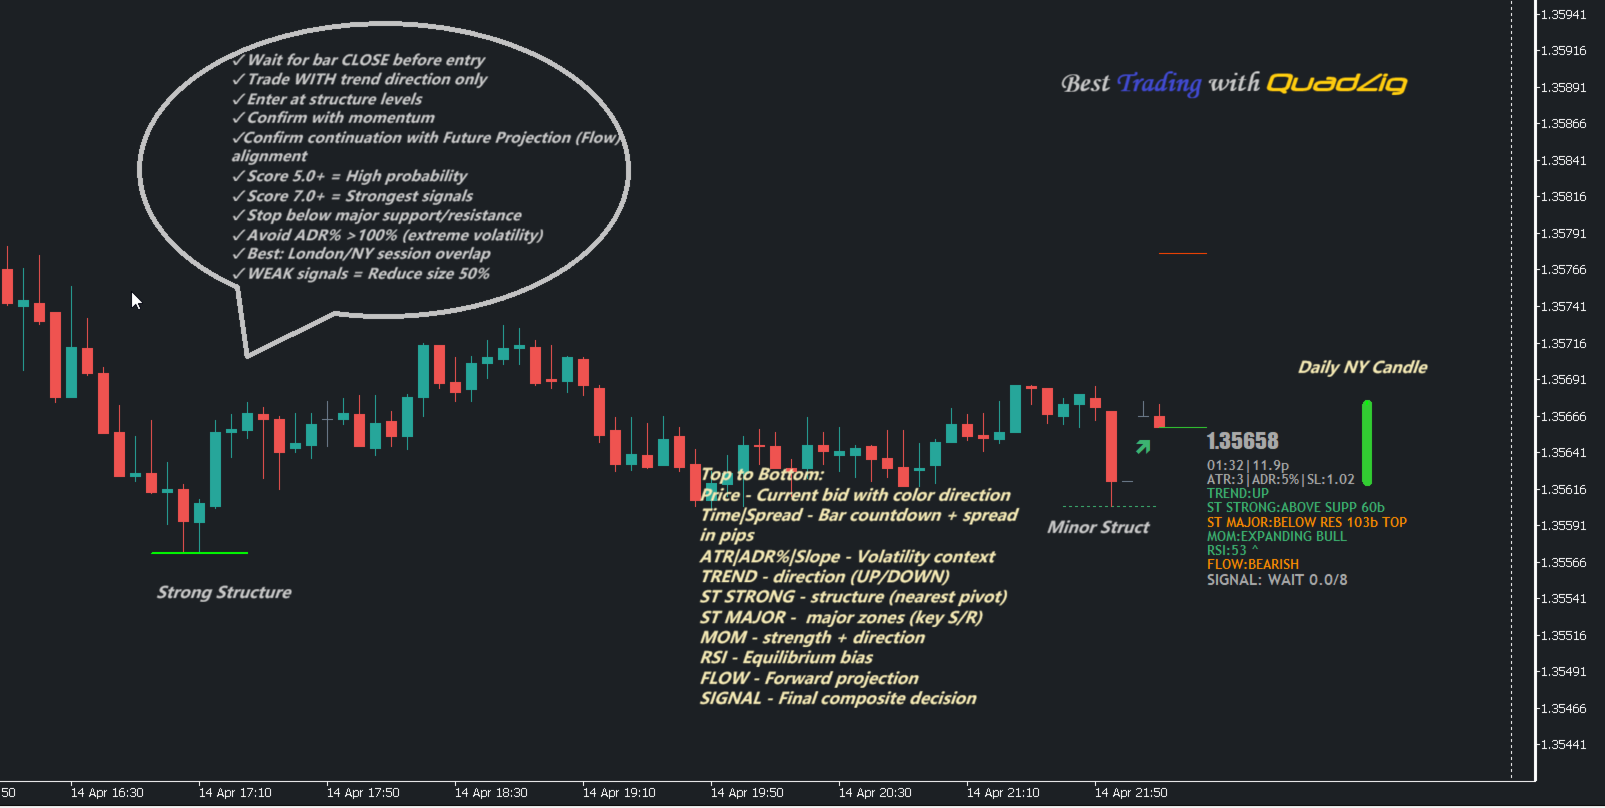
Dashboard Readings Explained
ClearEdge is designed so each row has a trading purpose.
TR = main trend direction ST = nearby structure condition MAJ = major structure context MOM = momentum state ATR/ADR = volatility and daily range context RSI = market balance / pressure FLOW = directional flow projection SIGNAL = final composite decision
Each row contributes to the final trade score.
This gives traders a clearer reason behind the signal instead of simply seeing an arrow with no explanation.
Structure Context
ClearEdge reads market structure and shows whether price is reacting around important zones.
It can identify when price is near:
minor structure strong structure major structure support areas resistance areas
This helps traders avoid buying directly into resistance or selling directly into support.
Structure context is especially useful for scalpers and day traders because many bad entries happen when price is already too close to a reaction zone.
Momentum and Flow
The HUD also evaluates whether momentum is supporting the trade direction.
Momentum can help show whether the market is expanding, weakening, or losing pressure.
Flow gives a broader directional reading and helps answer:
Is price moving with the current? Or am I trading against pressure?
When trend, structure, momentum, and flow agree, the score improves.
When they conflict, the HUD can show WAIT instead of forcing a signal.
ATR, ADR, and Volatility Context
ClearEdge includes volatility and range awareness.
This helps traders judge whether the market still has room to move or whether price may already be stretched.
The HUD can use:
ATR-based movement context ADR percentage daily range awareness volatility state
This is useful because a setup can look good directionally but still be poor if price has already travelled too far for the day.
New York Session Context
ClearEdge includes New York session awareness for intraday traders.
This helps highlight the most important part of the trading day for many forex, gold, and index traders.
The HUD can show New York session candle context and help traders understand whether the current move is developing during active liquidity or outside the main session window.
Entry, Stop Loss, and Take Profit References
When a setup qualifies, ClearEdge can project reference levels directly on the chart:
ENTRY SL TP
These levels are decision-support references. They are not automatic trade commands.
The purpose is to help traders frame a possible trade with clearer risk, target, and price context.
When the setup does not qualify, ClearEdge can withhold execution lines and show WAIT or weak signal conditions instead.
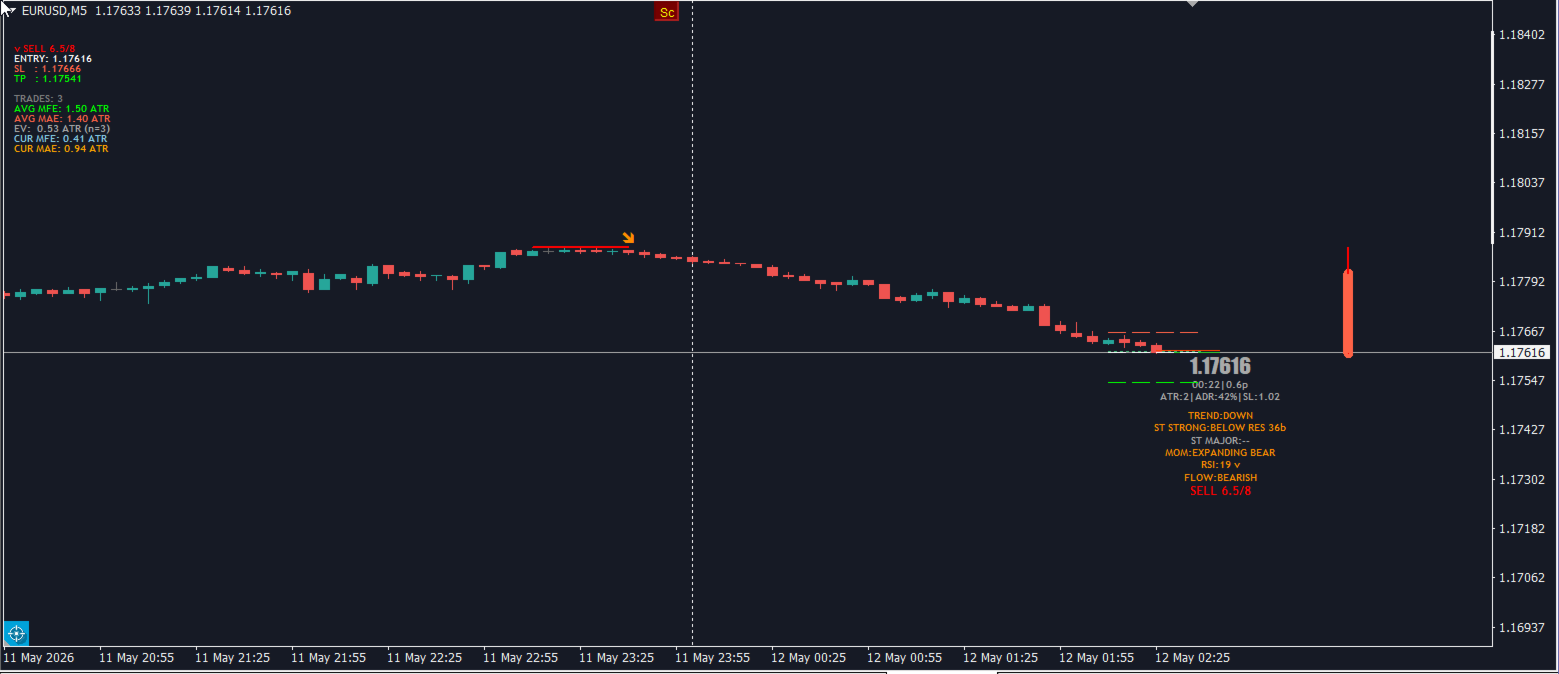
Signal Quality Statistics
ClearEdge can also display signal statistics to help traders review signal behaviour.
The statistics section can show:
TRADES AVG MFE AVG MAE EV CUR MFE CUR MAE
Plain English:
AVG MFE = average favorable movement after tracked signals AVG MAE = average adverse movement after tracked signals EV = estimated signal quality / edge CUR MFE = current signal’s best favorable move CUR MAE = current signal’s worst adverse move
These readings are designed as signal-quality feedback, not guaranteed profit/loss results.
They help traders understand whether recent signals are producing useful movement on the selected symbol and timeframe.
Clean Chart Workflow
ClearEdge is built to stay readable and practical.
You can use the full HUD when you want detailed market explanation, or reduce visual information when you prefer a cleaner chart.
This makes it suitable for:
scalping day trading intraday structure trading prop firm risk discipline manual confirmation EA-assisted decision-making
The panel sits beside live price action so you can read conditions without covering the chart.
How to Read ClearEdge
Example strong condition:
TREND: UP STRUCTURE: SUPPORT MOMENTUM: BULLISH FLOW: UP SIGNAL: BUY 7/8
Plain English:
The market is aligned bullish, price is reacting from support, momentum supports the move, and the final score shows a strong setup.
Example weak condition:
TREND: DOWN STRUCTURE: SUPPORT MOMENTUM: WEAK FLOW: FLAT SIGNAL: WAIT 2/8
Plain English:
The market does not have enough alignment. There may be structure nearby, but momentum and flow are not clean enough for a strong setup.
Key Features
-
Clean vertical market HUD
-
0 to 8 trade-quality score
-
Trend direction reading
-
Structure and major structure context
-
Momentum condition
-
Volatility and daily range awareness
-
RSI pressure reading
-
Flow / projection context
-
New York session candle context
-
Final BUY / SELL / WAIT decision
-
ENTRY, SL, and TP reference levels
-
Signal-quality statistics
-
MFE, MAE, and EV-style feedback
-
Clean chart layout
-
Useful for forex, gold, indices, and crypto
-
Designed for scalping, day trading, and intraday decision support
Who This Indicator Is For
ClearEdge HUD MT4 is useful for traders who want:
a cleaner chart structured trade confirmation market confluence scoring support and resistance context momentum confirmation volatility awareness daily range awareness trade / wait discipline
It is especially useful for:
prop firm traders manual intraday traders scalpers day traders index traders gold traders multi-symbol traders traders who want fewer emotional decisions
Recommended Use
A simple workflow:
1. Check the final SIGNAL row 2. Read the score out of 8 3. Confirm trend and structure agree 4. Check momentum and flow 5. Make sure price is not stretched by ATR/ADR context 6. Use ENTRY / SL / TP only when displayed 7. Apply your own risk management
ClearEdge works best as a decision-support tool. It is not designed to replace your trading plan, but to help you judge whether the market conditions are good enough to act.
Important Note
ClearEdge is designed around stable, closed-bar style market readings. This helps reduce live-bar noise and keeps the HUD focused on confirmed conditions rather than every tick fluctuation.
As with any trading tool, signals should be tested on a demo account first and used together with proper risk management.
PriceIntroductory Price: $139
Available for MT5 and MT4.
Early buyers receive future updates free.
Demo version runs in Strategy Tester only.
Live chart access requires rental or full purchase.
Your Feedback Matters
If ClearEdge HUD helps you trade with more structure and discipline, please leave a 5-star rating and review.
⭐⭐⭐⭐⭐
Disclaimer
Trading involves risk. ClearEdge HUD MT5 provides market analysis, scoring, and decision-support information only. It does not guarantee profits and is not financial advice. Always use proper risk management and follow your own trading plan.