Average Volume Smart

Average Volume Smart — Read the Market Before Everyone Else

In Wyckoff's method, volume is the soul of the market. It reveals what big operators are doing before price confirms any move. Average Volume Smart was built exactly for that: to give you a clear, immediate, and contextualized reading of volume behavior relative to its own history.

What It Is and How It Works

The indicator calculates the average volume over a configurable period and compares that value to the current volume, allowing you to visualize in real time whether the market is building or losing intention. This historical comparison is the key differentiator: instead of looking at the volume of a single isolated bar, you see volume within context — whether it is above or below what is "normal" for that asset at that moment.

This removes subjectivity. You no longer need to "feel" that volume is high or low. Average Volume Smart objectively shows the current market condition.

Why It Is Essential for the Wyckoff Method

The Wyckoff method rests on three pillars: price, volume, and time. Any Wyckoff analyst knows that without a correct volume reading, the analysis of Accumulation, Distribution, Markup, and Markdown phases becomes incomplete — and dangerous.

With Average Volume Smart, you can identify with much greater precision:

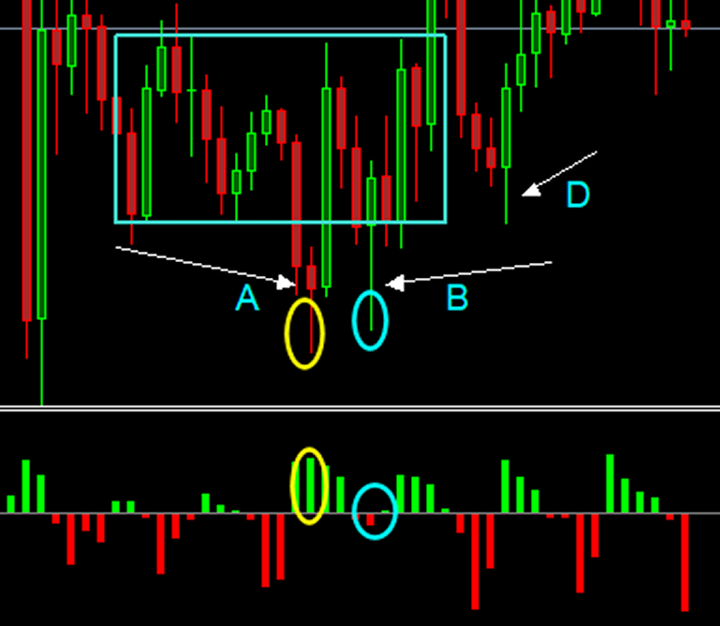
  • Buying/Selling Climax: Volume significantly above average on a specific bar is the classic exhaustion signal. The indicator makes this recognition immediate.
  • Secondary Test: On the secondary test, volume must be visibly lower than during the climax. The indicator's historical comparison confirms this visually and objectively.
  • Sign of Strength (SOS) and Sign of Weakness (SOW): True strength or weakness moves must be validated by above-average volume. Average Volume Smart delivers that validation in real time.
  • No Demand and No Supply: Bars with below-average volume indicate a lack of interest — essential for spotting traps and false breakouts before entering a trade.
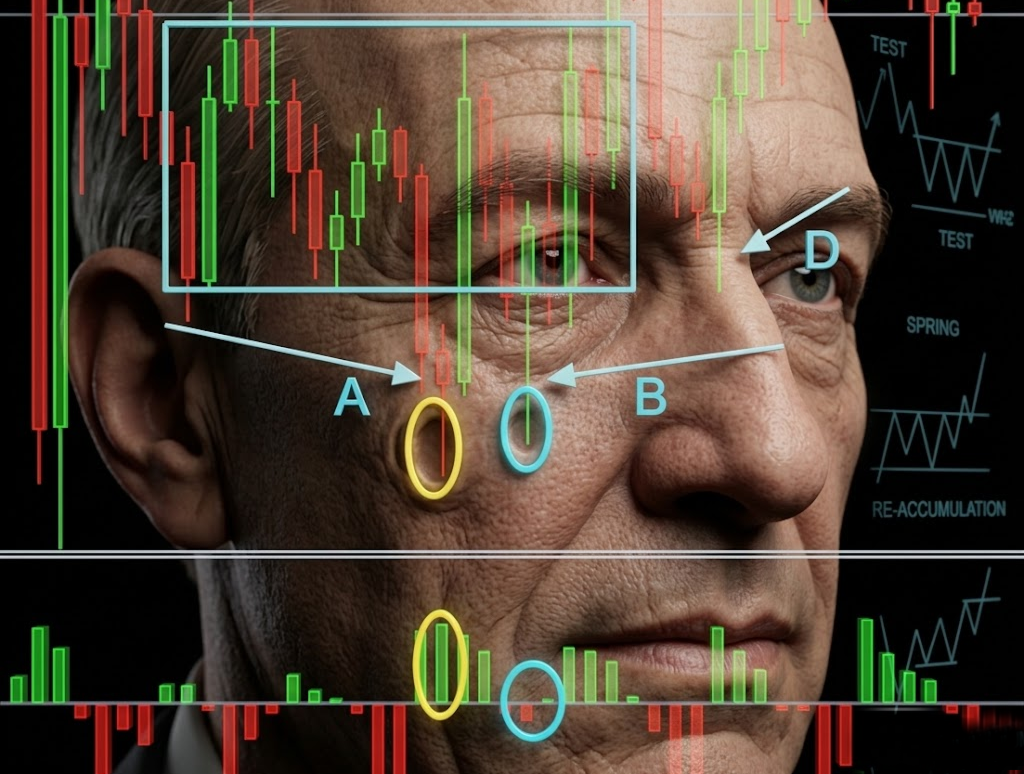
  • Springs and Upthrusts: Volume analysis on these critical events is decisive. Low volume on a Spring suggests an absence of selling pressure; high volume on an Upthrust indicates distribution. The indicator makes this reading instant.

Flexible Configuration

One of the most practical aspects of Average Volume Smart is the ability to adjust the calculation period according to your operational needs:

  • Short periods deliver a more immediate reading, ideal for day trading and very short-term operations where every volume variation matters.
  • Long periods provide a broader view of historical behavior, perfect for swing traders and position traders who need macro context for higher-timeframe decisions.

This flexibility makes the indicator useful on any timeframe and for any trading style.

Who This Indicator Is For

  • Traders who study or practice the Wyckoff method
  • Price action analysts who use volume as confirmation
  • Day traders, swing traders, and position traders
  • Any operator who wants to understand whether the market is gaining or losing strength before price makes it obvious

Free and Ready to Use

Average Volume Smart is available completely free of charge. No tricks, no hidden premium version. The idea is simple: deliver a genuinely useful tool for those who take technical analysis seriously. If volume tells the story of the market, this indicator is the translator of that story.

Add it to your setup, configure the ideal period for your trading style, and start reading the market with far greater clarity.


추천 제품
VP hidden
Emr Aljnaby
4.33 (12)
The indicator works to convert normal volume into levels and determine financial liquidity control points. It is very similar in function to Fixed Volume Profile. But it is considered more accurate and easier to use than the one found on Trading View because it calculates the full trading volumes in each candle and in all the brokers present in MetaTrade, unlike what is found in Trading View, as it only measures the broker’s displayed prices. To follow us on social media platforms: telegram
FREE
Aggression Volume
Flavio Javier Jarabeck
4.29 (17)
Aggression Volume Indicator is the kind of indicator that is rarely found in the MQL5 community because it is not based on the standard Volume data provided by the Metatrader 5 platform. It requires the scrutiny of all traffic Ticks requested on the platform... That said, Aggression Volume indicator requests all Tick Data from your Broker and processes it to build a very special version of a Volume Indicator, where Buyers and Sellers aggressions are plotted in a form of Histogram. Additionally,
FREE
Volume Profile Density v2
Vincent Jose Proenca
Volume Profile Density V2.40 가격 수준별 거래량 분포를 표시하여 기관 투자자의 관심 구간을 보여줍니다. 시간 기반 거래량과 달리, 실제 거래가 집중된 위치를 보여줍니다. 기본 원리: 수평 막대 = 가격별 거래량 막대가 길수록 거래량이 많음 빨간 구간 = 주요 지지 / 저항 구간 주요 사용 목적: 실제 지지선과 저항선 식별 POC (Point of Control) 확인 가치 영역 (총 거래량의 70%) 설정 낮은 거래량 구간을 손절 / 목표 지점으로 활용 색상 코드: 파란색 = 낮은 거래량 (빠른 이동 구간) 노란색 = 중간 거래량 (균형 구간) 빨간색 = 높은 거래량 (기관 매매 구간) 트레이딩 전략: 빨간 구간 반등 시 매수 VAH 또는 빨간 구간 저항 시 매도 거래량 동반 POC 돌파 시 진입 POC 회귀 시 재진입 파란 구간을 목표로 설정 설정: 초보자: 1.0 / 100% / 1.0 스캘핑: 0.5 / 200% / 0.5 스윙: 2.0 / 50% / 1
FREE
Weis Waves
Flavio Javier Jarabeck
2.83 (18)
The original author is David Weis, an expert in the Wyckoff Method. The Weis Wave is a modern adaptation of the 1930's Wyckoff Method, another expert in Tape Reading techniques and Chart Analysis. Weis Waves takes market volume and stacks it into waves according to price conditions giving the trader valuable insights about the market conditions. If you want to learn more about this subject you can find tons of videos in YouTube. Just look for "The Wickoff Method", "Weis Wave" and "Volume Spread
FREE
LT Trade Panel Lite
Thiago Duarte
4.65 (52)
Have you missed any tools or shortcuts in Meta Trader? Simple things that would make your daily trading much easier ? We have the solution for you: our Trade Panel! This is an EA tool (Expert Advisor) that, if configured to controll all symbols, needs to be loaded only once. This is the Lite version (free) of our tool. Professional version:   https://www.mql5.com/en/market/product/42658 If you have some problemas with the shortcut buttons on chart on unpinned mode try change the tickets digi
FREE
UT Alart Bot
Menaka Sachin Thorat
4.75 (4)
To get access to MT4 version please click  https://www.mql5.com/en/market/product/130055&nbsp ; - This is the exact conversion from TradingView: "Ut Alart Bot Indicator". - You can message in private chat for further changes you need. Here is the source code of a simple Expert Advisor operating based on signals from Ut Bot Indicator . #property copyright "This EA is only education purpose only use it ur own risk" #property link " https://sites.google.com/view/automationfx/home " #property versio
FREE
AvgVolumes
Marco Montemari
5 (1)
This indicator is based on Volumes standard indicator, calculates the average of Volumes based on the last N bars set by users, and if the value of the volume is bigger then a set % respect the average a different color will be used. The indicator is shown in a separate indicator window. This version has now a limitation in setting the % about the threshold. If you are interested to set threshold consider to buy the PRO version ( https://www.mql5.com/en/market/product/35925 ) If you want to use
FREE
Simple Weis Wave
Jean Jacques Huve Ribeiro
3.67 (3)
One of the best tools for analyzing volume, Weis Wave was idelized by David Weis, to facilitate the reading of directional flow. For the VSA method disciples it is an evolution of the practices created by Richard Wycoff, facilitating a predictive reading of the market, always seeking an accumulation and distribution of the negotiated contracts. Cumulative wave volume  Range of wave ( removed) Average Wave volume Ref "Tim Ord lectures" ( removed)
FREE
Overview Market Volume Profile Modes is a powerful MT5 volume distribution indicator that integrates multiple Volume Profile variants. Users can switch between different analysis modes through a simple menu selection. This indicator helps traders identify key price levels, support and resistance zones, and market volume distribution. Core Concepts • POC (Point of Control): The price level with the highest volume concentration, representing the market's accepted "fair value" area • VAH (Value A
FREE
Elevate Your Trading with Advanced Anchored Volume Weighted Average Price Technology Unlock the true power of price action with our premium Anchored VWAP Indicator for MetaTrader 5 - the essential tool for precision entries, strategic exits, and high-probability trend continuation setups. Write me a DM for a 7 day free trial.  Anchored VWAP Plus gives traders unprecedented control by allowing custom anchor points for Volume Weighted Average Price calculations on any chart. With support for 4 sim
FREE
Aggression Wave RSJ
JETINVEST
4.83 (6)
This indicator sums up the difference between the sells aggression and the buys aggression that occurred in each Candle, graphically plotting the waves of accumulation of the aggression volumes.   Through these waves an exponential average is calculated that indicates the direction of the business flow. Note: This indicator DOES NOT WORK for Brokers and/or Markets WITHOUT the type of aggression (BUY or SELL).   Be sure to try our Professional version with configurable features and alerts:  Agre
FREE
This robot sends Telegram notifications based on the coloring rules of PLATINUM Candle indicator. Example message for selling assets: [SPX][M15] PLATINUM TO SELL 11:45. Example message for buying assets : [EURUSD][M15] PLATINUM TO BUY 11:45 AM. Before enable Telegram notifications  you need to create a Telegram bot, get the bot API Key and also get your personal Telegram chatId. It's not possible to send messages to groups or channels. You can only send messages to your user chatId. You should
FREE
Volume Weighted Average Price or VWAP is an indicator wich shows different average prices on chart. This is very useful to find strong negotiation price areas and as trend following. Configurations: Day, Week and Month - Show different VWAPs according to the period. You can change each line style on "colors" tab. Any doubt or suggestion please contact us. Enjoy! This is a free indicator, but it took hours to develop. If you want to pay me a coffee, I appreciate a lot   <3 PayPal, Skrill, Nete
FREE
Order Book, known also as Market Book, market depth, Level 2, - is a dynamically updated table with current volumes of orders to buy and to sell specific financial instument at price levels near Bid and Ask. MetaTrader 5 provides the means for receiving market book from your broker in real time. The expert OrderBook Recorder records market book changes and stores them in local files for further usage in indicators and expert adviser, including testing in the tester. The expert stores market book
FREE
Order Book, known also as Market Book, market depth, Level 2, - is a dynamically updated table with current volumes of orders to buy and to sell specific financial instument at price levels near Bid and Ask. MetaTrader 5 provides the means for receiving market book from your broker, but in real time only, without access to its history. This expert adviser OrderBook History Playback allows you to playback the market book events on the history using files, created by OrderBook Recorder . The exper
FREE
Haven Volume Profile
Maksim Tarutin
4.56 (9)
Haven Volume Profile은 거래량 분포를 기반으로 중요한 가격 수준을 식별하는 데 도움이 되는 다기능 볼륨 프로파일 분석 지표입니다. 시장을 더 잘 이해하고 중요한 진입 및 퇴장 지점을 식별하려는 전문 트레이더를 위해 설계되었습니다. 기타 제품 ->  여기 주요 기능: Point of Control (POC) 계산 - 최대 거래 활동 수준으로, 가장 유동성이 높은 수준을 식별하는 데 도움이 됩니다 Value Area 정의 (높은 활동 영역) 및 사용자 지정 가능한 거래량 비율로 거래 범위를 보다 정확하게 평가할 수 있습니다 틱 거래량과 실제 거래량 모두 지원, 다양한 시장 유형과 거래 전략에 적합 계산 기간(일 수)의 유연한 설정으로 모든 시간 프레임에 도구를 적용할 수 있습니다 터미널의 밝은 테마와 어두운 테마에 자동 적응하여 사용자 인터페이스의 시각적 경험을 향상시킵니다 레벨 시각화가 명확하고 스타일과 색상을 사용자 지정할 수 있어 빠른 의사 결정을 돕습니다 이 지표
FREE
Aggression Volume Profile
Edson Cavalca Junior
4.55 (11)
This indicator plots the volume profile by Price on the chart There are 5 ways to view it: By Total Volume Traded (Premium Version); Volume Ticks(Forex) Separated by Buyers and Sellers (Premium Version); Buyers Only (Premium Version); Sellers Only (Premium Version); Business balance (Buyers - Sellers) (Premium Version); . It is possible to select how many days the profiles will be calculated.( Premium Version) On the current day it recalculates the histogram data for each new candlestick.
FREE
VisualVol EURUSD
Maxim Kuznetsov
The indicator highlights the points that a professional trader sees in ordinary indicators. VisualVol visually displays different volatility indicators on a single scale and a common align. Highlights the excess of volume indicators in color. At the same time, Tick and Real Volume, Actual range, ATR, candle size and return (open-close difference) can be displayed. Thanks to VisualVol, you will see the market periods and the right time for different trading operations. This version is intended f
FREE
(Special New Year promotion - free price!) The indicator displays the actual 'Scale in points per bar' (identical to the manual setting in the Terminal, see screenshot) in the upper right corner of the chart. The displayed value changes INSTANTLY whenever the chart scale is changed! (This is very convenient when planning screenshots). In Settings: Change language (Russian/English), font size of the displayed text, text label offset coefficient from the graph corner, equally in X and Y directi
FREE
The Volume Weighted ATR indicator is a helpful tool for measuring market activity. It is based on the idea of the Volume-Weighted ATR. Combining these two elements helps identify potential turning points or breakout opportunities. The indicator for the classification of the activity of the market uses the moving average and its multiples. Accordingly, where the VWATR bar is located (relative to the moving average), it is labelled as ultra-low, low, average, high, very high or ultra high. The Vo
FREE
MW Volume
Martin Bittencourt
3.8 (5)
The Martinware Volume indicator plots a colored moving average over volume bars. The coloring uses three colors and can be done in different ways choosable by the user and is applied both to the average as to the volume bars. Three types of coloring are possible: None: no coloring is done Increasing or decreasing: changes the color depending on the current value being bigger or lesser than the previous one Volume relative to average: colors vary if the current volume is bigger or lesser then
FREE
Simple Anchored VWAP MT5
Suvashish Halder
5 (2)
Simple Anchored VWAP   is a lightweight yet powerful tool designed for traders who want precise volume-weighted levels without complexity. This indicator lets you anchor VWAP from any point on the chart and instantly see how price reacts around institutional volume zones. MT4 Version - https://www.mql5.com/en/market/product/155320 Join To Learn Market Depth -   https://www.mql5.com/en/channels/suvashishfx Using VWAP bands and dynamic levels, the tool helps you understand where real buying and s
FREE
Value Chart Candlesticks
Flavio Javier Jarabeck
4.69 (13)
The idea of a Value Chart indicator was presented in the very good book I read back in 2020 , " Dynamic Trading Indicators: Winning with Value Charts and Price Action Profile ", from the authors Mark Helweg and David Stendahl. The idea is simple and the result is pure genius: Present candlestick Price analysis in a detrended way! HOW TO READ THIS INDICATOR Look for Overbought and Oversold levels. Of course, you will need to test the settings a lot to find the "correct" one for your approach. It
FREE
Mirror Chart MT5
Andrej Hermann
5 (1)
The Mirror Chart MT5 is a overlay indicator specifically designed to project a second financial instrument directly onto the main chart window. This tool is invaluable for traders who rely on correlation analysis, as it visualizes the price movements of two different instruments in real time. Unlike traditional overlays, this indicator utilizes intelligent, dynamic centering and scaling logic. It continuously analyzes the visible price range in the current window for both symbols and calculates
FREE
Simple Range Filter
Mattia Impicciatore
Simple Range Filter 는 높거나 낮은 변동성 을 가진 캔들을 자동으로 감지하고 시각적으로 표시하는 데 사용되는 기술 분석 도구입니다. 사용자가 지정한 캔들 수를 기준으로 **평균 가격 범위(고가 - 저가)**를 계산하며, 실시간 시장 상황에 따라 임계값을 동적으로 조정합니다. 주요 기능: 평균 가격 범위의 동적 계산 변동성이 평균보다 높은 또는 낮은 캔들에 대한 시각적 강조 표시 색상 및 계산 기간 사용자 정의 가능 틱 단위 실시간 업데이트 , 지연 없음 활용 사례: 횡보(낮은 변동성) 또는 확장(높은 변동성) 구간 식별에 도움 보다 복잡한 거래 시스템에서 기술 분석 구성 요소 로 사용 가능 트렌드 추종 또는 브레이크아웃 전략의 필터로 활용 가능 호환성: 시간 프레임 : M1부터 D1까지 자산 : 외환, 지수, 암호화폐, 주식 등 본 지표는 예측 알고리즘을 사용하지 않으며 , 자동 거래 신호를 생성하지 않고 , 수익을 보장하지 않습니다 . 단순히 기술 분석을 보조하는
FREE
Reversal Oscillator — Advanced Momentum Shift Detector Reversal Oscillator is a free indicator designed to highlight price zones that are statistically outside their normal movement patterns, helping traders anticipate potential turning points before they occur. Unlike traditional oscillators that react mainly to overbought/oversold conditions, this indicator applies third derivative analysis (the "acceleration of the acceleration" of price) calculated using two independent methods within a n
FREE
Trade assistant pro v8
Ahmed Mohammed Bakr Bakr
FREE FREE FREE Trade Assistant MT5 – Professional Trading & Risk Management Panel Trade Assistant MT5 is an advanced trading panel designed to help traders execute orders faster, safer, and more professionally . It simplifies manual trading by combining smart order management , precise risk control , and one-click execution , making it ideal for both beginners and advanced traders. This tool does not trade automatically . Instead, it empowers you with full control while applying professional-gra
FREE
Mini Panel Plus
PATRICK ANTONIO MORELO A.
4.29 (14)
Remodeling the BoletaMiniPanel, the Mini Panel Plus has the same functionalities, but is now in the form of a box that allows it to be minimized and placed anywhere on the chart. Simple Panel with Stop loss (Loss), Stop gain (Gain), Trailing stop (TS) and Breakeven (BE-P). The Lot is the number of contracts to be traded. Gain is the number, in points, at which the stop gain will be positioned. If you don't want to place a stop gain, just put 0 (zero) in its place and when you open the order it w
FREE
Caicai L&S Yield Histogram Important Notice: This indicator is an integral tool of the automated EA Caicai Long and Short Pair Trading . This indicator visually displays the percentage deviation (Yield %) of a pair's current spread relative to its own historical mean. It is an excellent tool for quickly visualizing the gross financial potential of a market distortion in Long & Short operations. Main Features: Percentage Visualization: Understand the size of the distortion in palpable percentage
Waves Sizer
Flavio Javier Jarabeck
3.86 (7)
Wyckoff fans, enjoy! Ideally to be used with the Weis Waves indicator, but it can be easily used alone, the Waves Sizer puts the range (in resulting Price movement) done by the Price on its market swings. You can control how accurate or loose will be the swings. This tool is very helpful for visually know how much the Price has traveled in your Timeframe. This way you can confront this level of effort with the resulting Volume, etc... Weis Waves indicator: https://www.mql5.com/en/market/produc
FREE
이 제품의 구매자들이 또한 구매함
SuperScalp Pro
Van Minh Nguyen
5 (14)
SuperScalp Pro – 고급 다중 필터 스캘핑 인디케이터 시스템 SuperScalp Pro는 클래식 Supertrend와 여러 지능형 확인 필터를 결합한 고급 스캘핑 인디케이터 시스템입니다. 해당 인디케이터는 M1부터 H4까지 모든 타임프레임에서 효율적으로 작동하며, 특히 XAUUSD, BTCUSD 및 주요 외환 통화쌍에 적합합니다. 독립형 시스템으로 사용하거나 기존 거래 전략에 유연하게 통합할 수 있습니다. 이 인디케이터는 11개 이상의 필터를 통합하며, 빠른/느린 EMA, 추세 판별용 3개의 EMA, EMA 기울기(EMA slope), RSI, ADX, 거래량(Volume), VWAP, 볼린저 밴드 돌파(Bollinger Bands Breakout) 및 MACD 다이버전스 필터 등을 포함합니다. 스마트 캔들 필터는 캔들 종가를 확인하여 약한 신호를 제거하고, 3 EMA와 MACD 다이버전스 필터를 결합한 추세 인식 메커니즘은 더 높은 승률의 신호를 선별하는 데 도움을 줍니
Azimuth Pro
Ottaviano De Cicco
5 (6)
LAUNCH PROMO Azimuth Pro price is initially set at 299$ for the first 100 buyers. Final price will be 499$ . THE DIFFERENCE BETWEEN RETAIL AND INSTITUTIONAL ENTRIES ISN'T THE INDICATOR — IT'S THE LOCATION. Most traders enter at arbitrary price levels, chasing momentum or reacting to lagging signals. Institutions wait for price to reach structured levels where supply and demand actually shift. Azimuth Pro maps these levels automatically: swing-anchored VWAP, multi-timeframe structure lines, an
Entry In The Zone and SMC Multi Timeframe is a real-time market analysis tool developed based on Smart Money Concepts (SMC). It is designed to analyze market structure, price direction, reversal points, and key zones across multiple timeframes in a systematic way. The system displays Points of Interest (POI) and real-time No Repaint signals, with instant alerts when price reaches key zones or when signals occur within those zones. It functions as both an Indicator and a Signal System (2-in-1), c
Divergence Bomber
Ihor Otkydach
4.89 (85)
이 지표를 구매하신 분께는 다음과 같은 혜택이 무료로 제공됩니다: 각 거래를 자동으로 관리하고, 손절/익절 수준을 설정하며, 전략 규칙에 따라 거래를 종료하는 전용 도우미 툴 "Bomber Utility" 다양한 자산에 맞게 지표를 설정할 수 있는 셋업 파일(Set Files) "최소 위험", "균형 잡힌 위험", "관망 전략" 모드로 설정 가능한 Bomber Utility의 셋업 파일 이 전략을 빠르게 설치, 설정, 시작할 수 있도록 돕는 단계별 영상 매뉴얼 주의: 위의 모든 보너스를 받기 위해서는 MQL5 개인 메시지 시스템을 통해 판매자에게 연락해 주세요. 독창적인 커스텀 지표인 “Divergence Bomber(다이버전스 봄버)”를 소개합니다. 이 지표는 MACD 다이버전스(괴리) 전략을 기반으로 한 올인원(All-in-One) 거래 시스템입니다. 이 기술 지표의 주요 목적은 가격과 MACD 지표 간의 다이버전스를 감지하고, **향후 가격이 어느 방향으로 움직일지를 알려주는
ARICoins
Temirlan Kdyrkhan
ARICoin is a powerful trading companion designed to generate high-probability entry signals with dynamic TP/SL/DP levels based on volatility. Built-in performance tracking shows win/loss stats, PP1/PP2 hits, and success rates all updated live. Key Features: Buy/Sell signals with adaptive volatility bands Real-time TP/SL/DP levels based on ATR Built-in MA Filter with optional ATR/StdDev volatility Performance stats panel (Success, Profit/Loss, PP1/PP2) Alerts via popup, sound, push, or email Cust
이 지표를 구매하면 제 프로페셔널 트레이드 매니저를 무료로 드립니다. 우선 이 거래 시스템이 리페인팅, 리드로잉 및 레이그 인디케이터가 아니라는 점을 강조하는 것이 중요합니다. 이는 수동 및 로봇 거래 모두에 이상적인 것으로 만듭니다. 온라인 강좌, 설명서 및 프리셋 다운로드. "스마트 트렌드 트레이딩 시스템 MT5"은 새로운 및 경험이 풍부한 트레이더를 위해 맞춤형으로 제작된 종합적인 거래 솔루션입니다. 10개 이상의 프리미엄 인디케이터를 결합하고 7개 이상의 견고한 거래 전략을 특징으로 하여 다양한 시장 조건에 대한 다목적 선택이 가능합니다. 트렌드 추종 전략: 효과적인 트렌드 추이를 타기 위한 정확한 진입 및 손절 관리를 제공합니다. 반전 전략: 잠재적인 트렌드 반전을 식별하여 트레이더가 범위 시장을 활용할 수 있게 합니다. 스캘핑 전략: 빠르고 정확한 데이 트레이딩 및 단기 거래를 위해 설계되었습니다. 안정성: 모든 인디케이터가 리페인팅, 리드로잉 및 레이그가 아니므로 신뢰
Gold Entry Sniper
Tahir Mehmood
5 (6)
Gold Entry Sniper – 골드 스캘핑 & 스윙 트레이딩을 위한 전문 다중 시간 프레임 ATR 대시보드 Gold Entry Sniper 는 XAUUSD 및 기타 종목에 대해 정확한 매수/매도 신호 를 제공하는 고급 MetaTrader 5 지표입니다. ATR 트레일링 스톱 로직 과 다중 시간 프레임 분석 을 기반으로 설계되어 스캘핑과 스윙 트레이딩 모두에 적합합니다. 주요 기능 및 장점 다중 시간 프레임 분석 – M1, M5, M15 추세를 한눈에 확인. ATR 기반 트레일링 스톱 – 변동성에 따라 자동 조정. 전문 차트 대시보드 – 신호 상태, ATR 레벨, 회귀선, 매매 방향 표시. 명확한 매수/매도 마커 – 자동 화살표와 텍스트 라벨. 종료 알림 & 거래 관리 – 수익 보호를 위한 자동 종료 감지. 완전 사용자 설정 가능 – 대시보드 위치, 색상, ATR/회귀선 파라미터 조정. 골드(XAUUSD) 최적화 – M1~M15 스캘핑에 완벽, 외환/지수/암호화폐에도 적용 가능.
RelicusRoad Pro MT5
Relicus LLC
5 (24)
RelicusRoad Pro: 퀀트 시장 운영 체제 70% 할인 평생 이용권 (한정 시간) - 2,000명 이상의 트레이더와 함께하세요 왜 대부분의 트레이더는 "완벽한" 지표를 가지고도 실패할까요? 진공 상태에서 단일 개념 만으로 거래하기 때문입니다. 문맥 없는 신호는 도박입니다. 지속적인 승리를 위해서는 컨플루언스(중첩) 가 필요합니다. RelicusRoad Pro는 단순한 화살표 지표가 아닙니다. 완전한 퀀트 시장 생태계 입니다. 독점적인 변동성 모델링을 사용하여 가격이 이동하는 "공정 가치 로드"를 매핑하고, 단순 노이즈와 실제 구조적 돌파를 구분합니다. 추측은 그만두세요. 기관급 로드 로직으로 거래를 시작하세요. 핵심 엔진: "Road" 알고리즘 시스템의 중심에는 시장 상황에 실시간으로 적응하는 동적 변동성 채널인 Road Algo 가 있습니다. 세이프 라인(평형) 과 가격이 수학적으로 반전될 가능성이 높은 확장 레벨 을 투영합니다. Simple Road: 일반적인 시장을 위
FX Trend MT5 NG
Daniel Stein
5 (4)
FX Trend NG: 차세대 멀티 마켓 트렌드 인텔리전스 개요 FX Trend NG 는 다중 시간 프레임 기반의 전문 트렌드 분석 및 시장 모니터링 도구입니다. 몇 초 만에 전체 시장 구조를 파악할 수 있도록 설계되었습니다. 여러 차트를 일일이 전환할 필요 없이, 어떤 종목이 추세에 있는지, 어디에서 모멘텀이 약화되고 있는지, 그리고 어떤 시간 프레임이 서로 정렬되어 있는지 즉시 확인할 수 있습니다. 출시 기념 특별 혜택 – FX Trend NG 를 $30 (6개월) 또는 $80 평생 라이선스 로 이용할 수 있습니다. 이미 Stein Investments 고객이신가요? -> 메시지를 보내 전용 고객 그룹에 참여하세요. 설정이나 사용 방법이 필요하신가요? -> Stein Investments 공식 페이지 를 방문하세요. 1. FX Trend NG가 특별한 이유 3단계 추세 로직 – 단순한 Buy / Sell이 아닙니다 • 대부분의 지표는 Buy 또는 Sell 두 가지 상태만 제
Meridian Pro
Ottaviano De Cicco
Meridian Pro: Professional Multi-Timeframe Trend Matrix for MT5 Overview Meridian Pro is a multi-timeframe trend matrix by Merkava Labs that compresses directional state, strength, momentum condition and matrix agreement into one compact panel. One adaptive engine, applied consistently from M1 to W1. No per-symbol tuning. No indicator stacking. One structured readout across every asset and every timeframe. Launch Offer — Get Meridian Pro for USD 99 (introductory). Regular price: USD 149. 1. Why
AriX
Temirlan Kdyrkhan
1 (4)
AriX Indicator for MT5 A powerful trend-following and signal-evaluation tool AriX is a custom MT5 indicator that combines Moving Averages and ATR-based risk/reward logic to generate clear buy/sell signals. It visualizes dynamic SL/TP levels, evaluates past trade outcomes, and displays win/loss statistics in a clean on-chart panel. Key features include: Buy/Sell signals based on MA crossovers ATR-based SL/TP1/TP2/TP3 levels with visual lines and labels Signal outcome tracking with real-time stat
Power Candles MT5
Daniel Stein
5 (6)
Power Candles – 모든 시장을 위한 강도 기반 진입 신호 Power Candles 는 Stein Investments의 검증된 강도 분석을 가격 차트에 직접 제공합니다. 가격 움직임에만 반응하는 대신, 각 캔들은 실제 시장 강도를 기준으로 색상화되어 모멘텀 형성, 강도 가속, 명확한 추세 전환을 즉시 파악할 수 있습니다. 모든 시장을 위한 단일 로직 Power Candles는 모든 거래 심볼 에서 자동으로 작동합니다. 현재 심볼이 Forex인지 비-Forex 시장인지 자동으로 감지하여 내부적으로 적절한 강도 모델을 적용합니다. Forex 및 Gold 는 FX Power Delta 값을 사용합니다 (절대값 범위 최대 100) 지수, 크립토 및 CFD 는 IX Power Strength 값을 사용합니다 (절대값 범위 최대 50) 필요한 강도 계산은 Power Candles에 완전히 내장되어 있습니다. 캔들 색상이나 신호 로직을 위해 추가 인디케이터는 필요하지 않습니다. 가격
HFT Spike Detector
OMG FZE LLC
5 (2)
[ My Products ] , [ My Channel ]   ,  [ LIVE SIGNAL ] HFT Spike Detector HFT Spike Detector는 HFT로 인해 발생하는 급격한 가격 변동을 실시간으로 분석하고 측정하기 위해 개발된 전문적인 틱 모니터링 도구입니다. 목적은 브로커로 인해 발생하는 비정상적인 슬리피지, 유동성 공백 및 밀리초 단위 가격 스파이크를 수치 데이터로 감지할 수 있도록 하는 것입니다. 실시간 틱 흐름과 체결 조건을 분석하기 때문에 백테스트로는 정확하게 평가할 수 없습니다. 이 EA는 자동화를 위해 준비된 세트 파일과 함께 사용할 수 있도록 구매할 수 있습니다:  VolumeHedger EA 작동 원리 이 Expert Advisor는 들어오는 모든 틱을 실시간으로 분석하고: 가격 변화 속도 초당 틱 밀도 슬리피지 크기 같은 방향의 마이크로 흐름 측정하여 차트의 패널에 표시합니다. 이를 통해 스프레드를 제외한 실제 실행 품질을 확인할 수
FX Power MT5 NG
Daniel Stein
5 (31)
FX Power: 통화 강세 분석으로 더 스마트한 거래 결정을 개요 FX Power 는 어떤 시장 상황에서도 주요 통화와 금의 실제 강세를 이해하기 위한 필수 도구입니다. 강한 통화를 매수하고 약한 통화를 매도함으로써 FX Power 는 거래 결정을 단순화하고 높은 확률의 기회를 발견합니다. 트렌드를 따르거나 극단적인 델타 값을 사용해 반전을 예측하고자 한다면, 이 도구는 귀하의 거래 스타일에 완벽히 적응합니다. 단순히 거래하지 말고, FX Power 로 더 스마트하게 거래하세요. 1. FX Power가 거래자에게 매우 유용한 이유 통화와 금의 실시간 강세 분석 • FX Power 는 주요 통화와 금의 상대적 강세를 계산하고 표시하여 시장 역학에 대한 명확한 통찰력을 제공합니다. • 어떤 자산이 앞서고 있고 어떤 자산이 뒤처지는지 모니터링하여 보다 현명한 거래 결정을 내릴 수 있습니다. 포괄적인 멀티 타임프레임 뷰 • 단기, 중기 및 장기 타임프레임에서 통화와 금의 강세를
Atomic Analyst MT5
Issam Kassas
3.94 (31)
우선적으로 언급할 점은이 거래 지표가 다시 그리지 않고 지연되지 않으며 이를 통해 수동 및 로봇 거래 모두에 이상적이라는 점입니다. 사용자 매뉴얼: 설정, 입력 및 전략. Atomic Analyst는 가격의 강도와 모멘텀을 활용하여 시장에서 더 나은 이점을 찾는 PA Price Action Indicator입니다. 고급 필터를 장착하여 잡음과 거짓 신호를 제거하고 거래 잠재력을 높이는 데 도움이 됩니다. 복잡한 지표의 다중 레이어를 사용하여 Atomic Analyst는 차트를 스캔하고 복잡한 수학적 계산을 간단한 신호와 색상으로 변환하여 초보 트레이더가 이해하고 일관된 거래 결정을 내릴 수 있도록합니다. "Atomic Analyst"는 새로운 및 경험이 풍부한 트레이더를위한 종합적인 거래 솔루션입니다. 프리미엄 지표와 최고 수준의 기능을 하나의 거래 전략에 결합하여 모든 종류의 트레이더에 대한 다재다능한 선택지가되었습니다. 인트라데이 거래 및 스캘핑 전략 : 빠르고 정확한 일일
Meravith MT5
Ivan Stefanov
마켓 메이커를 위한 도구. Meravith는 다음과 같은 기능을 제공합니다: 모든 타임프레임을 분석하고 현재 유효한 추세를 표시합니다. 강세와 약세 거래량이 동일한 유동성 구간(거래량 균형 구간)을 강조 표시합니다. 서로 다른 타임프레임의 모든 유동성 레벨을 차트에 직접 표시합니다. 텍스트 기반 시장 분석을 생성하여 참고용으로 제공합니다. 현재 추세를 기반으로 목표가, 지지선 및 손절가를 계산합니다. 거래의 위험 대비 보상 비율(Risk/Reward)을 계산합니다. 계좌 잔고에 따라 포지션 크기를 산출하고 잠재 수익을 추정합니다. 시장에 중대한 변화가 발생할 경우 경고도 제공합니다. 지표의 주요 라인: 강세/약세 거래량 소진 라인 — 목표가로 사용됩니다. 시장 추세를 나타내는 라인. 시장이 강세인지 약세인지에 따라 색상이 변경되며 추세 지지선 역할을 합니다. 색상은 주로 시장 심리를 보여줍니다. 거래량 균형선(Eq). Eq(Volume Equilibrium) 라인은 시스템의 핵심입니
OmniSync Projection
Antonio-alin Teculescu
5 (1)
Chronos Fractal Engine is an innovative price projection indicator for MetaTrader 5, designed to transform your technical analysis by intelligently identifying and projecting historical price patterns. Built upon an advanced correlation algorithm and the fractal principles of the market, this powerful tool visualizes potential future price movements, giving you a unique edge in your trading decisions. What is Chronos Fractal Engine? At its core, the Chronos Fractal Engine employs a sophisticat
Quantum TrendPulse
Bogdan Ion Puscasu
5 (22)
SuperTrend   ,   RSI   ,   Stochastic   의 힘을 하나의 포괄적인 지표로 결합하여 트레이딩 잠재력을 극대화하는 궁극의 트레이딩 도구   인 Quantum TrendPulse를   소개합니다. 정밀성과 효율성을 추구하는 트레이더를 위해 설계된 이 지표는 시장 추세, 모멘텀 변화, 최적의 진입 및 종료 지점을 자신 있게 식별하는 데 도움이 됩니다. 주요 특징: SuperTrend 통합:   주요 시장 추세를 쉽게 따라가고 수익성의 물결을 타세요. RSI 정밀도:   매수 과다 및 매도 과다 수준을 감지하여 시장 반전 시점을 파악하는 데 적합하며 SuperTrend 필터로 사용 가능 확률적 정확도:   변동성이 큰 시장에서 숨겨진 기회를 찾기 위해 확률적 진동   을 활용하고 SuperTrend의 필터로 사용 다중 시간대 분석:   M5부터 H1 또는 H4까지 다양한 시간대에 걸쳐 시장을 최신 상태로 유지하세요. 맞춤형 알림:   맞춤형 거래 조건이 충족되면
Grabber System MT5
Ihor Otkydach
4.83 (23)
탁월한 기술적 지표인 Grabber를 소개합니다. 이 도구는 즉시 사용 가능한 “올인원(All-Inclusive)” 트레이딩 전략으로 작동합니다. 하나의 코드 안에 강력한 시장 기술 분석 도구, 매매 신호(화살표), 알림 기능, 푸시 알림이 통합되어 있습니다. 이 인디케이터를 구매하신 모든 분들께는 다음의 항목이 무료로 제공됩니다: Grabber 유틸리티: 오픈 포지션을 자동으로 관리하는 도구 단계별 영상 매뉴얼: 설치, 설정, 그리고 실제 거래 방법을 안내 맞춤형 세트 파일: 인디케이터를 빠르게 자동 설정하여 최고의 성과를 낼 수 있도록 도와줍니다 다른 전략은 이제 잊어버리세요! Grabber만이 여러분을 새로운 트레이딩의 정점으로 이끌어 줄 수 있습니다. Grabber 전략의 주요 특징: 거래 시간 프레임: M5부터 H4까지 거래 가능한 자산: 어떤 자산이든 사용 가능하지만, 제가 직접 테스트한 종목들을 추천드립니다 (GBPUSD, GBPCAD, GBPCHF, AUDCAD, AU
Bill Williams Advanced
Siarhei Vashchylka
5 (11)
Bill Williams Advanced is designed for automatic chart analysis using Bill Williams' "Profitunity" system. The indicator analyzes four timeframes at once. Manual (Be sure to read before purchasing) Advantages 1. Analyzes the chart using Bill Williams' "Profitunity" system. Signals are displayed in a table in the corner of the screen and on the price chart. 2. Finds all known AO and AC signals, as well as zone signals. Equipped with a trend filter based on the Alligator. 3. Finds "Divergence Bar
소개       Quantum Breakout PRO   , 브레이크아웃 존 거래 방식을 변화시키는 획기적인 MQL5 지표! 13년 이상의 거래 경험을 가진 숙련된 트레이더 팀이 개발한       퀀텀 브레이크아웃 PRO       혁신적이고 역동적인 브레이크아웃 존 전략으로 거래 여정을 새로운 차원으로 끌어올리도록 설계되었습니다. Quantum Breakout Indicator는 5개의 이익 목표 영역이 있는 브레이크아웃 영역의 신호 화살표와 브레이크아웃 상자를 기반으로 한 손절 제안을 제공합니다. 초보자 거래자와 전문 거래자 모두에게 적합합니다. Quantum EA 채널:       여기를 클릭하세요 중요한! 구매 후 설치 매뉴얼을 받으려면 개인 메시지를 보내주십시오. 추천: 기간: M15 통화쌍: GBPJPY, EURJPY, USDJPY,NZDUSD, XAUUSD 계정 유형: 스프레드가 매우 낮은 ECN, Raw 또는 Razor 브로커 시간: GMT +3 중개인 :
Trend Screener Pro MT5
STE S.S.COMPANY
4.84 (102)
트렌드 표시기, 트렌드 트레이딩 및 필터링을 위한 획기적인 고유 솔루션, 하나의 도구 안에 내장된 모든 중요한 트렌드 기능! Forex, 상품, 암호 화폐, 지수 및 주식과 같은 모든 기호/도구에 사용할 수 있는 100% 다시 칠하지 않는 다중 시간 프레임 및 다중 통화 표시기입니다. Trend Screener는 차트에 점이 있는 화살표 추세 신호를 제공하는 효율적인 지표 추세 추종 지표입니다. 추세 분석기 표시기에서 사용할 수 있는 기능: 1. 트렌드 스캐너. 2. 최대 이익 분석이 있는 추세선. 3. 추세 통화 강도 측정기. 4. 경고가 있는 추세 반전 점. 5. 경고가 있는 강력한 추세 점. 6. 추세 화살표 Trend Screener Indicator가 있는 일일 분석 예, 일일 신호 성능...등은 여기에서 찾을 수 있습니다. 여기를 클릭하십시오. LIMITED TIME OFFER : Trend Screener Indicator는 50$ 및 평생 동안만 사용할 수 있습니다.
Market Structure Order Block Dashboard MT5 는 MetaTrader 5용 MT5 인디케이터 로, 시장 구조 및 ICT / Smart Money Concepts에 기반합니다: HH/HL/LH/LL , BOS , ChoCH 뿐 아니라 Order Blocks , Fair Value Gaps (FVG) , 유동성 (EQH/EQL, sweeps), 세션 / Kill Zones , 그리고 Volume Profile 을 통합하여 콤팩트한 컨플루언스 대시보드를 제공합니다. 중요: 본 제품은 분석 도구 입니다. 자동 매매를 실행하지 않습니다( EA가 아님 ). 구매자 보너스 구매 후 제 스토어에서 보너스 인디케이터 2개 를 (선택하여) 무료로 받을 수 있습니다. 보너스 수령 방법: 1) 본 제품에 대한 솔직한 리뷰를 남겨주세요. 2) MQL5 메시지로 BONUS MSOB + 선택한 인디케이터 2개 이름 을 보내주세요. 주요 기능 시장 구조: HH/HL/LH/LL
Smart Stop Indicator – 차트 위에서 직접 작동하는 지능형 스톱로스 시스템 개요 Smart Stop Indicator는 감이나 추측이 아닌 명확하고 체계적인 방식으로 스톱로스를 설정하고 싶은 트레이더를 위한 맞춤형 솔루션입니다. 이 도구는 클래식 프라이스 액션 논리(고점, 저점 구조)와 현대적인 브레이크아웃 인식을 결합하여 실제로 가장 논리적인 다음 스톱 레벨을 정확히 식별합니다. 추세, 박스권, 빠른 브레이크아웃 상황 등 어떤 시장에서도 인디케이터는 최적의 SL 구역과 상태(“new”, “broken”, “valid”)를 차트에 직접 표시합니다. 새로운 기능으로 SL 거리의 %ADR 표시가 추가되었습니다. 핵심 기능 자동 시장구조 기반 스톱 설정 • 시장 구조와 실시간 가격 움직임을 기반으로 의미 있는 스톱로스 레벨을 자동으로 탐지합니다. 스마트 브레이크아웃 감지 • 빠른 방향 변화나 돌파 상황에서도 불필요한 조기 스톱 조정을 강요하지 않으며 유연하게 반응합
Trend Forecaster
Alexey Minkov
5 (7)
The Trend Forecaster indicator utilizes a unique proprietary algorithm to determine entry points for a breakout trading strategy. The indicator identifies price clusters, analyzes price movement near levels, and provides a signal when the price breaks through a level. The Trend Forecaster indicator is suitable for all financial assets, including currencies (Forex), metals, stocks, indices, and cryptocurrencies. You can also adjust the indicator to work on any time frames, although it is recommen
Advanced Supply Demand MT5
Bernhard Schweigert
4.53 (15)
현재 33% 할인! 초보자나 전문 트레이더를 위한 최고의 솔루션! 이 보조지표는 우리가 다수의 독창적 기능과 새로운 공식을 통합한 독특하고 고품질이며 저렴한 거래 도구입니다. 이 업데이트를 통해 이중 시간대를 표시할 수 있습니다. 더 높은 TF를 표시할 수 있을 뿐만 아니라 차트 TF와 더 높은 TF 모두를 표시할 수 있습니다: 중첩 영역 표시. 모든 Supply Demand 트레이더들이 좋아할 것입니다. :) 중요한 정보 공개 Advanced Supply Demand의 잠재력을 극대화하려면 다음을 방문하십시오. https://www.mql5.com/ko/blogs/post/720245   진입 또는 목표의 명확한 트리거 포인트를 정확히 찾아냄으로 해서 거래가 어떻게 개선될지 상상해 보십시오. 새로운 알고리즘을 기반으로 매수자와 매도자 간의 잠재적인 불균형을 훨씬 더 쉽게 분간할 수 있습니다. 왜냐하면 가장 강한 공급영역과 가장 강한 수요 영역과 과거에 어떻게 진행 되었는지를(이전
RFI levels PRO MT5
Roman Podpora
3.67 (3)
이 지표는 추세 반전 지점과 가격 반등 영역을 정확하게 보여줍니다.       주요 투자자들   . 새로운 트렌드가 형성되는 곳을 파악하고 최대한 정확하게 의사결정을 내리며 모든 거래를 완벽하게 통제합니다. TREND LINES PRO   지표와 함께 사용할 때 최대의 잠재력을 발휘합니다.  VERSION MT4 지표가 보여주는 내용: 새로운 추세의 시작 시 활성화되는 반전 구조 및 반전 수준. 최소한의 위험 대비 수익률을 갖는 이익 실현   (TAKE PROFIT)   및   손절매(STOP LOSS)   레벨 표시       RR 1:2   . 지능형 손실 감소 로직이 적용된 손절매 기능. 지정된 지표에서 두 가지 추세 유형에 대한 반전 패턴을 표시합니다. 지표: 트렌드를 따라   트렌드 라인 프로   (글로벌 트렌드 변화) 트렌드 프로   (빠른 트렌드 변화) 간단하고 효과적입니다       스캐너       실시간 추세 (신규). 다중 시간 프레임 도구 필터링. 표시하다  
Crystal Heikin Ashi Signals
Muhammad Jawad Shabir
5 (1)
Crystal Heikin Ashi Signals - Professional Trend & Signal Detection Indicator Advanced Heikin Ashi Visualization with Intelligent Signal System for Manual & Automated Trading Final Price: $149 ---------> Price goes up $10 after every 10 sales . Limited slots available — act fast . Overview Crystal Heikin Ashi Signals is a professional-grade MetaTrader 5 indicator that combines pure Heikin Ashi candle visualization with an advanced momentum-shift detection system. Designed for both manual traders
Pips Stalker mt5
Abdulkarim Karazon
5 (2)
핍스 스토커는 롱 숏 화살표 유형의 지표로, 모든 수준의 트레이더들이 더 나은 시장 결정을 내릴 수 있도록 돕습니다. 이 지표는 절대 재도색되지 않고 RSI를 주요 신호 로직으로 사용합니다. 화살표가 주어지면 절대 다시 도색되거나 다시 도색되지 않고, 화살표 지연도 없습니다. MT4 버전 &lt;---- PIPS STALKER ARROW 기능 : 통계 패널 전체 승률 %와 연속 최대 승리 및 패배 거래 등 유용한 통계, 기타 유용한 정보를 보여주는 독특한 정보 대시보드입니다. TP와 SL, 내장된 자금 관리 이 지표는 각 화살표마다 TP와 SL 객체를 제공하므로, 거래자는 자금 및 위험 관리를 내장하고 있으며, SL은 ATR을 기반으로 하며, TP는 현재 ATR SL 가치를 기반으로 한 위험 대비 보상 비율을 기반으로 합니다. 재도색 없음, 높은 조정 가능성 이 인디케이터는 신호 품질 개선을 위한 다양한 옵션을 제공하여 어떤 쌍에서도 약간의 기간 조정만으로 작동하며, 패널은
Matrix Arrow Indicator MT5
Juvenille Emperor Limited
5 (19)
매트릭스 화살표 표시기 MT5 는 외환, 상품, 암호 화폐, 지수, 주식과 같은 모든 기호/도구에 사용할 수 있는 100% 다시 칠하지 않는 다중 기간 표시기를 따르는 고유한 10 in 1 추세입니다.  Matrix Arrow Indicator MT5 는 다음과 같은 최대 10개의 표준 지표에서 정보와 데이터를 수집하여 초기 단계에서 현재 추세를 결정합니다. 평균 방향 이동 지수(ADX) 상품 채널 지수(CCI) 클래식 하이켄 아시 캔들 이동 평균 이동 평균 수렴 발산(MACD) 상대 활력 지수(RVI) 상대 강도 지수(RSI) 포물선 SAR 스토캐스틱 오실레이터 윌리엄스의 백분율 범위 모든 지표가 유효한 매수 또는 매도 신호를 제공하면 강력한 상승/하락 추세를 나타내는 다음 캔들/막대가 시작될 때 해당 화살표가 차트에 인쇄됩니다. 사용자는 사용할 표시기를 선택하고 각 표시기의 매개변수를 개별적으로 조정할 수 있습니다. 매트릭스 화살표 표시기 MT5는 선택한 표시기에서만 정보를 수
제작자의 제품 더 보기
Channel Rider
Dorival Cardozo
The Channels Robot for MetaTrader is an automated trading system based on time-defined price range analysis and channel breakout logic. The robot calculates the high and low of a user-defined time window, forming a price channel that represents the market’s consolidation range. Once the reference candle or session closes, upper and lower channel levels are projected at configurable distances. Trade entries are triggered when price breaks above or below these calculated channel boundaries, ensuri
FREE
Hilo Power
Dorival Cardozo
5 (1)
HiloPower – Advanced Trend and Market Strength Indicator for MetaTrader 5 HiloPower is not just another trend indicator developed from the traditional Hi-Lo. It was designed to offer a more complete and intelligent reading of the market, combining direction, strength, and intensity of movements. With it, the trader can see not only where the price is going, but also how strong and volatile that movement really is.
FREE
FlagTrend TF
Dorival Cardozo
FlagTrendTF Free Indicator for MetaTrader 5 FlagTrendTF is a free MetaTrader 5 indicator designed to help traders identify market trends across multiple timeframes quickly and visually. It is ideal for confirming whether the market direction is aligned from higher timeframes down to the trading timeframe. How FlagTrendTF Works The indicator allows you to monitor up to 4 timeframes simultaneously , displaying easy-to-read arrows: Green arrow : bullish trend Red arrow : bearish trend This fa
FREE
필터:
리뷰 없음
리뷰 답변