IA Sniper Titan

IA Sniper Titan V1.0 - Quantitative System for Synthetic Indices

Analytical system designed for professional trading in Deriv (Boom/Crash) and Weltrade (GainX/PainX) markets.

IA Sniper Titan V1.0 is a Quantitative Data Mining Engine that processes historical data (Ticks) to evaluate price anatomy and institutional volatility in real-time.

Our development philosophy is based on combining human analysis and computational statistics: The indicator provides historical statistical data, and the human trader provides the graphical context for decision making.

Demonstration and Strategy Tester

To demonstrate the mathematical logic of this indicator, it has been evaluated in the MetaTrader 5 Strategy Tester. In the demo video and attached screenshots, an automated Expert Advisor is shown.

Disclaimer: The Expert Advisor shown in the visual material is an internal tool used exclusively for tests based on historical data (Backtesting). The product offered on this page is the Analytical Indicator for use in manual trading.

Clients who purchase the indicator can contact me to receive the testing Expert Advisor for free, so they can audit the strategy themselves in their local simulator.

Main Features of Version 1.0

  • Z-Score Quantitative Engine: Integration of standard deviation to detect anomalous volume injections.
  • Dynamic Agglomerator: The indicator evaluates historical fractals and adjusts the measurement parameters to the current market based on the data entered by the user.
  • Telemetry Panel (HUD): Graphical interface that separates the Fibonacci Level and the historical reaction statistical percentage.
  • Tetris Pool: Visualization level designed to identify potential liquidity sweeps.
  • Mobile Notifications: Support for Push alerts (disabled by default). Requires MetaQuotes ID configuration in the terminal.
  • Bilingual System: Interface configurable in English and Spanish.

Multi-Timeframe Analysis Engines

  • Micro Engine (M1 - M5): Oriented to short-term tactical reaction.
  • Medium Engine (M15 - M30): Oriented to structural retracement projections.
  • Macro Engine (H1+): Uses the ATR indicator to define the context and general trend.

Statistical Clusters
The panel displays probabilistic zones based on price history:

  • C1 (Initial Zone): First evaluation area.
  • C2 (Mid Zone): Statistical equilibrium point.
  • C3 (Extreme Zone): Area with high historical reaction probability.

Mandatory Disclaimer

Important: It is strictly recommended to test this indicator on a DEMO ACCOUNT to become familiar with the interpretation of quantitative data before trading on live accounts.

IA Sniper Titan V1.0 is a mathematical analytical tool. The statistical projections based on historical data shown by this indicator do not guarantee future returns and do not constitute profit promises. The user must use this information exclusively as a complement to their own technical analysis and apply appropriate risk management.

📞 Support and Contact

As the developer, I offer full technical support. To claim your free Expert Advisor (Cyborg), get the PDF Manual, or resolve any questions, please send me a Private Message directly here on the MQL5 platform.
추천 제품
IQ FX Gann Levels a precision trading indicator based on W.D. Gann’s square root methods . It plots real-time, non-repainting support and resistance levels to help traders confidently spot intraday and scalping opportunities with high accuracy. William Delbert Gann (W.D. Gann) was an exceptional market analyst, whose trading technique was based on a complex blend of mathematics, geometry, astrology, and ancient mathematics which proved to be extremely accurate. We don't offer free or bonus indic
[b]Titan Pro V7 Institutional Dashboard[/b] is an advanced quantitative HUD terminal engineered for MetaTrader 5, designed for institutional market analysis, quantitative prop-firm verification, and disciplined intraday execution. Unlike conventional single-formula indicators that suffer from lag and market regime shifts, Titan Pro V7 synthesizes a multi-strategy quantitative consensus model combining Trend Momentum, Volatility Breakout, Intraday VWAP, and Smart Money Concepts (SMC) into a sin
ARE Quantum Liquidity
Jakir Hussain Shaikh
ARE Quantum Liquidity Institutional Smart Money Engine ARE Quantum Liquidity is an advanced Smart Money Concepts (SMC) indicator designed to help traders identify institutional liquidity movements and high-probability trading opportunities. The indicator analyzes market structure in real time and automatically detects important price action elements used by professional traders, including Break of Structure (BOS), Change of Character (CHoCH), Order Blocks, Fair Value Gaps (FVG), Liquidity Swe
Lumin Chart
John John Gutierrez Vivas
LUMIN Chart reads the market structure for you and draws the zones that matter. It finds support, resistance and Order Blocks, scores each one from 0 to 12 and rates it WEAK, MEDIUM or STRONG, so you can see at a glance which levels deserve your attention. This is an indicator only. It does not open, close or modify trades, and it does not need Algo Trading enabled. Key features Scored zones (0–12). Every zone is rated on: impulse leaving the zone rejection wick respected bounces (exhausted zone
My PVSR
Ashok Kumar Singha
My PVSR   is based on All Type of Pivot Points. Use this Indicator to get proper Support / Resistance Zone and Trade accordingly.. Recommendation: Use this Indicator along with my another Indicator --->>> Dr. Trend   <<<--- Click Here ; To get the best output result feel free to contact me ; Best of Luck It can be used for: All Pairs: Forex, Cryptocurrencies, Metals, Stocks, Indices etc. All Timeframe All Brokers All type of Trading Style like Scalping, Swing, Intraday, Short-Term, Long-
Market Projection Pro — MT5 Want to visualize how the price cycles in your chosen chart section could extend? Market Projection Pro analyzes a historical window you select, extracts cycle components and draws a composite projection to its right. You control the source window and forward horizon to compare the scenario with price structure and potential turning zones. What you see on the chart Interactive boundaries let you select a historical analysis window directly on the chart. Cycle componen
RAD Real Acummulation and Distribution
Jose Alejandro Jacome Jimenez
RAD CRITICAL LEVES RAD indicator tracks “Relevant Volume” in real time, identifying accumulation and distribution processes, projecting them in the chart as SUPPORT or RESISTANCE zones. Natural   support   and resistance levels are generated by Volume Accumulation and Distribution processes. As these processes evolve, levels at which the relevant volume in the market place is positioned, become difficult areas to cross upwards or downwards. By using this information, traders can identify very s
Garuda Support Resistance Indicator is a powerful smart trading tool designed to automatically detect high-probability support and resistance zones on your chart. Built especially for Gold (XAUUSD) and Forex traders, this indicator removes the need for manual drawing and provides clean, visually clear buy and sell areas. This indicator uses intelligent swing-based logic to identify key price reaction levels where the market is most likely to reverse or react. The zones are dynamically updated an
Introduction to Fractal Pattern Scanner Fractal Indicator refers to the technical indicator that makes use of the fractal geometry found in the financial market. Fractal Pattern Scanner is the advanced Fractal Indicator that brings the latest trading technology after the extensive research and development work in the fractal geometry in the financial market. The most important feature in Fractal Pattern Scanner is the ability to measure the turning point probability as well as the trend probabil
Orderflow Scalp Pro
TitanScalper
5 (2)
Orderflow Scalp Pro v2.4   delivers institutional-grade trading intelligence through advanced volume analysis, dynamic VWAP calculations, real-time aggressive score monitoring, and precision arrow signals. This complete trading system transforms complex market data into clear, actionable signals for consistent profitability on 3-4 minute timeframes. Full Documentation: [Download PDF] Four Powerful Components in One System Volume Profile HeatMap with POC/VAH/VAL Transform your charts into inst
Quant Volatility Bands
Leonardo Marins Cordeiro
Institutional Volatility Bands Pro MTF The Institutional Volatility Bands Pro MTF is a professional econometric indicator built for individual retail traders, institutional operators, prop firm traders, and quantitative analysts across all financial markets (Futures, Spot, and Options). Unlike traditional indicators (such as Bollinger Bands or ATR) that suffer from lag and continuous dynamic repainting, this tool utilizes advanced econometric models to project 100% static, zero-repaint horizon
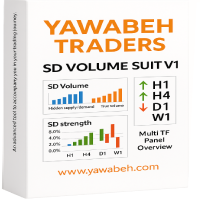
Yawabeh SD Pro –  Professional Supply and Demand Indicator Trade Smarter with Volume-Confirmed Supply/Demand Zones Our institutional-grade algorithm identifies high-probability reversal zones before price reacts, giving you the edge in Forex, Crypto, and Stocks. Key Features Multi-Timeframe Confirmation – View trend strength across multiple timeframes simultaneously – Align your trades with higher timeframe momentum Smart Alert System – Real-time notifications for: – Strong demand/supply zone
Limitless MT5
Dmitriy Kashevich
Limitless MT5 is a universal indicator suitable for every beginner and experienced trader. works on all currency pairs, cryptocurrencies, raw stocks Limitless MT5 - already configured and does not require additional configuration And now the main thing Why Limitless MT5? 1 complete lack of redrawing 2 two years of testing by the best specialists in trading 3 the accuracy of correct signals exceeds 80% 4 performed well in trading during news releases Trading rules 1 buy signal - the ap
Vector Fibo Scalp
Cristofher Robles
Vector Fibo Scalp is a speed and breakout-oriented intraday indicator. It monitors current price movements against daily high/low channels and provides immediate signals upon breakout confirmation. Key Features: Vector Velocity: Fast detection of daily breakouts using moving average channels. Visual candles: 4-color candle highlighting engine for active scalping states. Breakout Targets: Automatic projection of profit targets up to 161.8% Fibo ratio. R:R Panel: Dynamic calculations of risk-to-re
SignalArrows - Trading Signal Indicator SignalArrows is a MetaTrader 5 indicator designed to identify potential BUY and SELL signal conditions using moving-average crossover logic with additional confirmation filters. The indicator processes a signal through several stages before plotting an arrow on the chart: How It Works 1. Raw MA Cross Detection The indicator first detects a crossover between the fast and slow moving averages. 2. Gap Confirmation After a crossover, the indicator checks whe
Gold Kinetic Pro
Deynis Alejandro Puro Rodriguez
An Applied Mathematical and Physical Model for XAUUSD – (Prop Firm Ready) Gold Kinetic Pro is a short-term intraday system for XAUUSD that brings six independent strategies together inside a single Expert Advisor. Gold moves in bursts, pauses and sharp turns. Gold Kinetic Pro is designed to recognise one specific kind of moment in that behaviour and to act only when its conditions are fully met, in both directions. When they are not met, it waits. The approach is built on precision rather than v
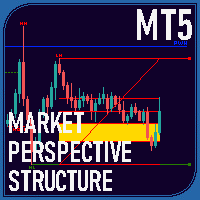
Overview The Market Perspective Structure Indicator is a comprehensive MetaTrader indicator designed to provide traders with a detailed analysis of market structure across multiple timeframes. It identifies and visualizes key price action elements, including swing highs and lows, Break of Structure (BOS), Change of Character (CHOCH), internal structures, equal highs/lows, premium/discount levels, previous levels from higher timeframes, and trading session zones. With extensive customization opt
MarketMagnet
Kelly Adediran Raymond
Are you ready to take your trading journey to new heights? Look no further than MarketMagnet, this groundbreaking indicator designed to propel your trading success with excitement and accuracy. Powered by the convergence of Momentum and CCI (Commodity Channel Index), MarketMagnet equips traders with the ultimate tool to determine direction and entry prices for a wide range of recommended currency pairs and instruments. It is designed for traders seeking to scalp for a few pips on lower timeframe
First time on MetaTrader, introducing IQ Star Lines, an original Vedic Astrology Based Intraday Trading Indicator. We don't offer free or bonus indicators in exchange of reviews from you. You won't need any free products with this indicator to make it work. ;) Enjoy! Welcome to the new and updated  IQ Star Lines , the ultimate fusion of ancient planetary cycles and modern quantitative trading, published for the first time on Metatrader. This is an indicator built by the developer, who has spent
They say history repeats itself. What if you could prove it in real-time? The Propfolio Ghost Pattern is an advanced algorithmic pattern-matching engine. It empowers you to select any current price action structure on your chart and instantly scan thousands of historical candles to find the exact moment in the past where the market did the exact same thing. Once it finds the highest probability match, it projects the historical outcome into the future as "Ghost Candles"—giving you a highly calcu
SwingCross
Subho Adhikary
Short description (one line) ZigZag-style swing indicator that plots swing highs/lows, leg midpoints, range labels and dynamic Small/Medium/Large target levels with a latched target-chaser line. Full description Swing Cross is a highly customizable ZigZag-style indicator that identifies swing highs and lows, draws the connecting legs, and automatically builds dynamic target levels from your symbol's recent leg-range history. How it works Detects local swing highs/lows using the classic ZigZag
The indicator is designed to work on any trading platform. The program is based on proprietary algorithms and W.D.Ganna's mathematics, allowing you to calculate target levels of price movement based on three points with the highest degree of certainty. It is a great tool for stock trading. The indicator has three buttons: NEW - call up a triangle for calculation. DEL - delete the selected triangle. DELS - completely remove all constructions. The probability of achieving the goals is more than 80
Pan PrizMA CD Phase
Aleksey Panfilov
The Expert Advisor and the video are attached in the Discussion tab . The robot applies only one order and strictly follows the signals to evaluate the indicator efficiency. Pan PrizMA CD Phase is an option based on the Pan PrizMA indicator. Details (in Russian). Averaging by a quadric-quartic polynomial increases the smoothness of lines, adds momentum and rhythm. Extrapolation by the sinusoid function near a constant allows adjusting the delay or lead of signals. The value of the phase - wave s
SMC OrderFlow Indicator v1.79 Pro Let’s be upfront: no single indicator can guarantee profitability on its own. Trading results depend on the trader's judgment, risk management, market conditions, and execution discipline. The SMC OrderFlow Indicator v1.79 Pro is neither an "automated money-making" tool nor a simple signal system that merely displays arrows. Instead, it is designed to help traders gain a clearer understanding of market structure, order flow zones, and the relationships between
Dual Bollinger Session Channel
Danton Dos Santos Sardinha Junior
Dual Bollinger Session Channel MetaTrader 5 전문 고정 세션 볼린저 채널 실제 세션 데이터를 기반으로 가격 행동(price action), 돌파(breakout), 기관급 시장 구조 분석을 위해 설계되었습니다. 제품 개요 Dual Bollinger Session Channel 은 MetaTrader 5용 프로페셔널급 기술적 인디케이터로, 직전의 실제 거래 세션 (일간 또는 주간) 데이터만을 기반으로 두 개의 독립적인 볼린저 밴드 계산을 수행하여 고정된 통계적 가격 채널을 생성합니다. 기존의 볼린저 밴드가 새 캔들이 형성될 때마다 지속적으로 재계산되는 것과 달리, 본 인디케이터는 현재 활성 세션 전체 동안 모든 채널 레벨을 고정 하여 트레이더에게 거래 기간 내내 안정적이고 신뢰할 수 있는 통계적 프레임워크를 제공합니다. 이 방식은 다음을 정밀하게 시각화할 수 있게 해줍니다: 가격 균형 구역 통계적 과신장(overextension) 영역 변동성 확장
Advance Entry Levels Light
Kundan Kumar Srivastava
Introducing Your Ultimate Trading Edge:   Dynamic Support & Resistance, Advance Entry Levels Light Indicator for MT5 platform Unlock the power of precision trading with our cutting-edge Dynamic Support & Resistance Indicator. Designed to give traders unparalleled clarity, this indicator is your roadmap to identifying exactly where to buy and sell, maximizing your potential for consistent, sustainable profits. Why Choose Our Indicator? Crystal Clear Entry and Exit Points : No more guesswork. Our
Smart Recovery AI Multi Level MT5 는 지능형 진입 로직, 적응형 시장 필터링 및 구조화된 멀티 레벨 회복을 하나의 강력한 전문가 자문에 통합하도록 설계된 MetaTrader 5 용 차세대 자동화 거래 시스템입니다. 실제 거래 조건을 위해 구축된 이 전문가 자문은 무작위 거래 실행이 아닌 정밀한 진입, 제어된 회복 동작 및 바스켓 기반 이익 관리를 우선시합니다. 핵심 전략 로직 Smart Recovery AI Multi Level MT5 는 방향성 및 회복 하이브리드 시스템으로 작동합니다: 다중 확인 필터를 사용하여 유효한 시장 기회 감지 확인된 방향성 편향에 기반한 초기 거래 개설 가격이 포지션에 반하여 이동할 경우 제어된 회복 레벨 활성화 조정된 청산 관리를 위해 모든 거래를 통합된 바스켓으로 관리 달러로 정의된 이익 목표에 도달 시 전체 바스켓 청산 이 접근 방식은 가중 진입 우위를 창출하여 가격이 안정화될 때 효율적인 청산을 가능하게 하면서 회복 프
KT Pin Bar MT5
KEENBASE SOFTWARE SOLUTIONS
KT Pin Bar identifies the pin bar formation which is a type of price action pattern which depicts a sign of reversal or rejection of the trend. When combined with support and resistance, BRN and other significant levels, Pin Bar pattern proved to be a very strong sign of reversal. Basically, a pin bar is characterized by a small body relative to the bar length which is closed either in upper or lower 50% part of its length. They have very large wicks and small candle body. A pin bar candlestic
WsFx Kvoo
Yasir Mohammed Sachit Sachit
WSFX KVOO is a complete, all-in-one price-action toolkit for MetaTrader 5. It combines a smart zigzag wave engine, auto-detected support/resistance order blocks, trend legs, a regression-based price channel, Head & Shoulders pattern recognition, and a live trade-plan builder (entry, trailing stop, and multi-target ladder) — all in one non-repainting indicator. Four live on-chart dashboards give you a full picture at a glance: overall trend and liquidity, a multi-timeframe (2m/15m/1h/4h/Daily) co
TopBot
Michael Ndukwo
This Bot works with three timeframe analysis which are the; the daily , the hourly and the minutes timeframes. It uses the daily do detect a bearish or bullish market trend , the hourly detects premium and discount zones while the minute is used to detect supply and demand , before a trading decision is made by the bot. It has two entry modes which are the passive  and aggressive , the aggressive has more potential rewards with more risks while the passive has less risk and less rewards. I recom
이 제품의 구매자들이 또한 구매함
Boba Analysis Suite
Trade Ready Solutions LLC
5 (2)
Boba Analysis Suite Boba Analysis Suite는 MetaTrader 5용 분석 지표입니다. 시장 구조, 주요 가격 영역, 전반적인 시장 상황을 하나의 차트 화면에 통합하여 표시합니다. 트레이더이자 트레이딩 코치로서의 실무 경험을 바탕으로 개발되었으며, 시장 방향 평가, 주요 가격 수준 식별, 여러 시간대의 종합적인 분석 등 체계적인 분석 과정을 지원합니다. 시장 맥락을 고려한 분석 개별 신호의 의미는 시장 상황에 따라 달라집니다. Boba Analysis Suite는 현재 차트 상황을 더 넓은 시장 구조와 연결하고, 사전에 정한 규칙에 따라 매매 아이디어를 검토할 수 있도록 돕습니다. 주요 분석 기능은 다음과 같습니다. 추세 및 시장 구조: 시장 방향과 관련 구조적 맥락을 평가합니다. 주요 가격 영역 및 수준: 추가 분석이 필요한 중요한 영역을 차트에 시각적으로 표시합니다. 여러 시간대: 서로 다른 시간대의 정보를 통합하여 전반적인 시장 상황을 평가합니다.
Zain Gold Scalping
Ahmed Gamal Abdel Nasser Mohamed
A complete price-action analysis tool built around dual independent entry logic, each confirmed against a volatility band, combined with a configurable set of nine optional confirmation filters that let you shape exactly how conservative or aggressive the tool's signals behave. Core Strategy Two independent entry setups, each triggering only when price moves outside a dynamic volatility band — giving two distinct ways to spot potential reversal points, which can be used together or separately.
ARIPoint
Temirlan Kdyrkhan
1 (4)
ARIPoint is a powerful trading companion designed to generate high-probability entry signals with dynamic TP/SL/DP levels based on volatility. Built-in performance tracking shows win/loss stats, PP1/PP2 hits, and success rates all updated live. Key Features: Buy/Sell signals with adaptive volatility bands Real-time TP/SL/DP levels based on ATR Built-in MA Filter with optional ATR/StdDev volatility Performance stats panel (Success, Profit/Loss, PP1/PP2) Alerts via popup, sound, push, or email Cu
UZFX {SSS} 스캘핑 스마트 시그널 v5.0 MT5는 급변하는 시장에서 정확한 실시간 시그널을 필요로 하는 스캘퍼, 데이 트레이더, 스윙 트레이더를 위해 설계된 리페인팅이 없는 고성능 트레이딩 지표입니다. (UZFX-LABS)에서 개발한 이 지표는 가격 움직임 분석, 추세 확인 및 스마트 필터링을 결합하여 모든 통화 쌍과 시간대에서 높은 확률의 매수 및 매도 신호, 경고 신호, 추세 지속 기회를 생성합니다. 거래에 대한 망설임을 멈추고, 명확성, 정밀성, 그리고 규율 있는 시장 실행을 원하는 트레이더를 위해 설계된 체계적인 신호 시스템을 따르기 시작하세요. 제 말을 믿으세요. 이 지표는 MQL5에서 구할 수 있는 최고의 지표 중 하나입니다. 그러니 절대 놓치지 마세요!! “현명한 트레이더를 위한 스마트 신호” 지금 최신 버전 5.0이 출시되었으며, 사전 공지 없이 가격이 최대 $499.99까지 인상될 수 있으니 기회를 놓치기 전에 서둘러 구매하세요!! 최종 구매 전! 무료 체
The indicator is designed to close positions on the market in time. For example: to take profits ahead of schedule if the price has not reached TakeProfit, and the market is turning around. The indicator analyzes the momentum, not the trend. He does not give any information about the trend. The indicator is well suited for finding divergence. The Ershov 38 Parrots indicator dynamically adjusts to the market and detects price movement impulses of medium and high amplitude. It almost does not rea
Chimera Volume
Marko Milenkovic
MetaTrader 5용 Chimera Volume 고급 거래량 분석 및 시장 활동 시각화 Chimera Volume은 MetaTrader 5 전용 사용자 정의 지표로, 정규화된 거래량 활동을 분석하고 역동적인 시각적 프레임워크를 통해 시장 참여도의 변화를 보여주도록 설계되었습니다. 이 지표는 적응형 정규화 알고리즘을 사용하여 틱 거래량 데이터를 처리하며, 다양한 시장 상황 속에서 거래량의 강도, 매집 단계, 활동 변화를 구조화된 형태로 생성합니다. 원시 거래량 값을 표시하는 일반 거래량 지표와 달리, Chimera Volume은 추가 계산을 적용하여 시장 활동의 상대적 변화를 강조하고 차트의 가독성을 향상시킵니다. 주요 기능 루트 인텐트 히스토그램 (Root Intent Histogram): 정규화된 거래량 강도와 시장 참여도를 시각화하는 동적 히스토그램입니다. 적응형 색상 전환을 사용하여 활동 증가 시기와 참여 감소 시기를 명확하게 구분합니다. 관성 라인 (Inertia Line
Meravith Scanner
Ivan Stefanov
5 (3)
MERAVITH SCANNER는 MetaTrader 5용 전문 금융 시장 지표로, 여러 분석 도구를 하나의 통합 시스템으로 결합합니다. 독점적인 거래량 가중 평균 가격(VWAP) 방법론을 사용하여 모든 계산을 자동으로 수행하며, 주관적인 해석을 완전히 배제합니다. 이 지표는 모든 자산 클래스(Forex, 주식, 지수, 상품, 암호화폐)와 M1부터 월간 차트까지 모든 시간 프레임에서 작동합니다. 기본 원리는 “가격은 거래량을 따른다”입니다. MERAVITH는 기관 거래량이 집중되는 위치를 식별하고, 그 집중에서 수학적으로 정확한 가격 수준을 도출합니다. 예측이나 투기를 하지 않으며, 계산만 수행합니다. MERAVITH SCANNER를 사용하면 28개의 주요 Forex 통화쌍을 모든 시간 프레임에서 단 2~3분 만에 스캔할 수 있습니다. 또한 원하는 시장을 스캔할 수도 있으며, 예를 들어 약 100개의 주식을 약 10분 안에 스캔할 수 있습니다. 지표는 소진 레벨, 균형선, 편차, 통계
TrendMaestro5
Stefano Frisetti
note: this indicator is for METATRADER4, if you want the version for METATRADER5 this is the link:  https://www.mql5.com/it/market/product/108106 TRENDMAESTRO ver 2.5 TRENDMAESTRO recognizes a new TREND from the start, he never makes mistakes. The certainty of identifying a new TREND is priceless. DESCRIPTION TRENDMAESTRO identifies a new TREND in the bud, this indicator examines the volatility, volumes and momentum to identify the moment in which there is an explosion of one or more of these da
Meravith MT5
Ivan Stefanov
5 (3)
MERAVITH는 MetaTrader 5용 멀티 타임프레임 거래량·유동성 지표로, 모든 타임프레임에서 추세, 지지와 저항 구간, 진입, 목표, 손절을 보여줍니다. 시장의 완전한 유동성 지도, 헤지펀드 스타일의 유동성 도구를 제공하며, 자체 거래량 가중 평균 가격 방식으로 모든 계산을 자동으로 수행하므로 주관적인 해석이 없습니다. 외환, 금(XAUUSD), 지수, 암호화폐에서 작동하며, 모든 타임프레임에서 사용할 수 있습니다. 구매 후 보너스: MERAVITH로 거래하는 방법에 대한 동영상 강의 모음. 구매 후 저에게 메시지를 보내주세요. MERAVITH의 기능 모든 타임프레임을 분석하고 각 타임프레임에서 현재 유효한 추세를 보여줍니다. 유동성 구간(Volume Equilibrium)을 표시합니다. 상승 거래량과 하락 거래량이 같아지는 지점입니다. 모든 타임프레임의 유동성 레벨을 차트에 직접 표시합니다. 참고용으로 시장의 텍스트 분석을 작성합니다. 현재 추세를 기준으로 진입, 목표,
AriFocus
Temirlan Kdyrkhan
AriFocus - Non-Repainting Buy/Sell Signals AriFocus - one clear signal. AriFocus marks buy and sell signals directly on the chart and suggests a stop-loss level for each one. Every signal is confirmed on bar close and never repaints. - Buy/sell arrows, confirmed on bar close - Suggested stop-loss level for every signal - Trend band and candle coloring to show direction at a glance - 10 ready-made presets, or your own settings (14 calculation methods) - Pop-up, push and email alerts with entr
Cycles Plotter
Edoardo Centorame
Cycles Plotter 이동 평균과 시작 날짜가 있는 사용자 지정 가능 사이클 지표 Cycles Plotter는 사용자의 입력에 의해서만 완전히 사용자 지정 가능한 두 개의 사인파 사이클을 그리는 고급 기술 지표입니다. 사이클을 자동으로 생성하지 않습니다. 모든 사이클은 사용자가 설정한 매개변수에만 기반하여 계산되며, 자동 신호나 예측을 생성하지 않고 가격 진동과 잠재적인 추세 변화를 연구하기 위한 시각적 도구를 트레이더에게 제공합니다. 핵심 사항: 사용자 정의 사이클: 사이클 1 P1 및 2 P2는 사용자가 완전히 구성할 수 있습니다. 사이클 길이, 진폭, 이동 평균, 정확한 시작 날짜와 시간을 설정할 수 있습니다. 사용자가 매개변수를 입력하지 않으면 어떤 사이클도 그려지지 않습니다. 진폭 제어: 각 사이클은 다른 진폭을 가질 수 있어 기준 이동 평균에 대한 진동의 높이를 조정할 수 있습니다. 추세 감지: 빠른 이동 평균과 느린 이동 평균은 사이클의 방향을 나타냅니다: Fast
Quantum Momentum Guard (QMG) Breakout and Momentum Indicator for MetaTrader 5 Overview Quantum Momentum Guard (QMG) is a technical indicator for MetaTrader 5 designed to identify potential breakout opportunities by combining momentum analysis, breakout conditions, and mathematical validation. The indicator evaluates market conditions to generate directional signals when its configured criteria are met. It is designed primarily for XAUUSD (Gold) and can also be used on other financial instruments
AriX
Temirlan Kdyrkhan
1 (4)
AriX Indicator for MT5 A powerful trend-following and signal-evaluation tool AriX is a custom MT5 indicator that combines Moving Averages and ATR-based risk/reward logic to generate clear buy/sell signals. It visualizes dynamic SL/TP levels, evaluates past trade outcomes, and displays win/loss statistics in a clean on-chart panel. Key features include: Buy/Sell signals based on MA crossovers ATR-based SL/TP1/TP2/TP3 levels with visual lines and labels Signal outcome tracking with real-time stat
Title:FX-AIEA Supply and Demand Zone Indicator (MT5) — Technical Overview Version: 2.51 | Platform: MetaTrader 5 Introduction Supply and demand zones are considered a core manifestation of institutional order flow, providing a more direct reflection of buying and selling pressure than traditional support/resistance levels. This indicator attempts to automate the identification of high-probability supply and demand zones using an adaptive ZigZag algorithm, reducing the subjectivity and time asso
ORB Seeker MT5
Marcela Goncalves De Oliveira
한정 수량 판매 및 제품 희소성 유지를 위한 특별 가격입니다! 단돈 599달러! 구매 후 저에게 연락 주시면 보너스 ORB Seeker EA와 개인 최적화 설정 파일을 보내드립니다. 깔끔한 세션 브레이크아웃을 자신감 있게 활용하세요! ORB Seeker MT5는 정확성, 단순성, 유연성 및 명확한 차트 구조를 원하는 트레이더를 위해 개발된 전문적인 시가 범위 돌파(ORB) 지표입니다. 이 프로그램은 모든 금융 상품에 대해 장전 거래 또는 사용자 지정 세션 범위를 자동으로 표시하고, 진입, 손절매, 목표 수익 및 선택적으로 50% 부분 목표 수익 수준을 포함한 명확한 돌파 신호를 제공합니다. 모든 계산은 실시간으로 차트에 직접 표시됩니다. 런던 개장, 뉴욕 세션, 아시아 세션 또는 사용자 지정 시장 시간대를 선택하여 거래하세요. ORB Seeker MT5는 사용자가 선택한 세션 시간에 맞춰 작동하므로 시장 범위, 돌파 레벨 및 거래 레벨을 정확하게 확인할 수 있습니다. 모든 구매
Volume Arrow Signal Product Description Volume Arrow Signal is a smart trading indicator designed to help traders identify potential buy and sell opportunities using price action, volume behavior, and directional arrow signals. The indicator places clear arrows directly on the chart, making it easy to spot possible market reversals, trend continuations, and entry opportunities without spending hours analyzing charts manually. Whether you are trading Gold (XAUUSD) , Forex pairs, Indices, or Crypt
OrderFlow Absorption – MT5용 전문 델타 & 흡수 신호 인디케이터 OrderFlow Absorption으로 진정한 오더플로우 분석의 힘을 경험하세요. MetaTrader 5를 위한 궁극의 델타 히스토그램 및 흡수 신호 인디케이터입니다. 가격 움직임의 이면에서 실제로 무슨 일이 일어나는지 알고 싶은 트레이더를 위해 설계된 이 도구는, 시장을 움직이는 숨겨진 매수/매도 압력과 흡수 이벤트를 드러냅니다. 주요 기능 델타 히스토그램 시각화:   매수와 매도 압력을 색상별 히스토그램으로 즉시 확인할 수 있습니다. 흡수 신호 감지:   고급 로직으로 강세 및 약세 흡수 이벤트를 식별하여 반전 신호를 미리 알려줍니다. 차트 마커:   흡수 신호가 차트에 직접 표시되어 시각적으로 쉽게 확인할 수 있습니다. 팝업 알림:   새로운 흡수 신호가 발생하면 실시간으로 알림을 받을 수 있습니다. 사용자 지정 임계값:   약한 신호는 필터링하고, 확률이 높은 기회에 집중할 수 있습니다.
Zain Gold ScalpingV5
Ahmed Gamal Abdel Nasser Mohamed
Zain Gold Scalping V5 is a technical analysis indicator for MetaTrader 5 designed for Forex and Gold markets. It provides chart-based market information, trend analysis, signal conditions, and an on-screen dashboard to help traders analyze price movement across multiple timeframes. Main Features The indicator supports multiple timeframes, including M1, M5, M15, M30, H1 and higher timeframes. It can be used with Gold (XAUUSD), Forex currency pairs, indices and other supported instruments. The in
KenKem Master Volume Profiler - Brief Introduction A Display-only volume-profile cockpit for XAUUSD, BTCUSD and other liquid symbols. Draws profile structure, multi-timeframe flow, EMA trend and study-only setup markers. Places no orders. Not a signal service.  It maps where the market has actually traded and reads recent order flow, so you can see structure and lean at a glance.  What it shows: Master and local volume profiles (POC and value-area high/low) - the price shelves that matter. A liv
VTrende Pro
Andrii Diachenko
5 (1)
VTrende Pro - MTF indicator for trend trading with a display panel for MT5 *** Videos can be translated into any language using subtitles (video language - Russian) Although the signals of the VTrende Pro indicator can be used as signals of a full-fledged trading system, it is recommended to use them in conjunction with the Bill Williams TS. VTrende Pro is an extended version of the VTrende indicator. Difference between Pro version and VTrende: - Time zones - Signal V - signal 1-2 waves -    S
Navigator Equilibrium: 시장 국면, 모멘텀, 피크, 다이버전스를 하나의 창에서 모멘텀 오실레이터, 추세 필터, 변동성 지표, 다이버전스 스캐너를 오가며 확인할 필요가 없습니다. Navigator Equilibrium은 이 모두를 색상으로 구분되는 하나의 창에 담았습니다. 모멘텀이 강해지는지 약해지는지, 누가 주도권을 쥐고 있는지, 시장이 추세 중인지 횡보 중인지, 그리고 가격과 모멘텀이 어디서 엇갈리는지를 한눈에 확인할 수 있습니다. 시장을 명확하게 읽고 싶은 재량 트레이더와, 깔끔하고 문서화된 버퍼가 필요한 EA 개발자를 위해 만들었습니다. 차별점 상승 또는 하락만 보여 주는 것이 아닌, 다섯 가지 상태의 히스토그램. 방향뿐 아니라 모멘텀이 강해지는지, 약해지는지, 과도하게 늘어난 피크 상태인지를 색상으로 보여 줍니다. 시장 상태를 알려 주는 제로 라인. 색이 바뀌면서 시장이 추세 중인지 횡보 중인지 알려 줍니다. "누가 주도하는가"를 한눈에. 히스토그램 막대 위
Boom & Crash & PainX & GainX Ultimate Spike Detector Trade Spikes With Confidence — Not Guesswork Catching spikes should be one of the most profitable strategies in synthetic markets. But for most traders, it becomes one of the most frustrating. You enter too early… price goes against you. You wait for a spike… it never comes. You finally catch one… but don’t know whether to hold or close. You make profit… then give it all back because there’s no exit plan. This is exactly the problem the Ultim
한 문장으로 이해하면 이 인디케이터는 RSI와 MACD, 두 전문가를 하나로 묶은 것 입니다. 두 지표를 따로 보며 판단할 필요 없이, 둘 다 동의할 때만 "매수" 또는 "매도" 화살표를 보여줍니다. 화살표는 다시 그려지지 않습니다 . 한 번 나타나면 그 자리에 고정됩니다. "콤보"의 의미 보통 트레이더는 RSI(가격 움직임의 힘)와 MACD(추세 방향)를 따로 봅니다. 그런데 둘의 신호가 충돌할 때가 많죠. 이 인디케이터는 두 지표가 동시에 같은 방향을 가리킬 때만 신호를 냅니다 . 덕분에 가짜 신호가 훨씬 줄어듭니다. 화면에서 보이는 것 가격 차트와 분리된 인디케이터 창 파란색과 빨간색 화살표 – 바로 쓸 수 있는 매매 신호 확대된 MACD 히스토그램 (모멘텀을 쉽게 파악하도록 더 크고 선명하게 표시) RSI와 MACD 선도 함께 표시되지만, 주목할 것은 화살표 이런 분께 적합합니다 초보자 – 두 지표를 따로 해석하고 모순을 처리할 필요 없음 경험자 – 빠른 신호 필터링, 다시
Gold Uptrend Insider
Lawrence Chiiambb Mkandawi
5 (1)
Uptrend Insider A clean and powerful trend-following indicator that helps you catch the beginning of uptrends and exit before the market turns into a range or downtrend. How it works:   Green → Uptrend signal (potential buying opportunity) Orange → Ranging / sideways market possibility but maintain the trend positions just keep an eye for possible ranges and reversals. Red → Downtrend or exit signal (time to close long positions) The indicator is designed to be extremely simple and visual. You o
MasterTrend
Temirlan Kdyrkhan
MasterTrend Indicator for MT5 A powerful trend-following and signal-evaluation tool MasterTrend   is a custom MT5 indicator that combines Moving Averages and ATR-based risk/reward logic to generate clear buy/sell signals. It visualizes dynamic SL/TP levels, evaluates past trade outcomes, and displays win/loss statistics in a clean on-chart panel. Key features include: Buy/Sell signals based on MA crossovers ATR-based SL/TP1/TP2/TP3 levels with visual lines and labels Signal outcome tracking wit
SMC Sweep Fvg MT5
Daniil Sleptsov
5 (1)
SMC Sweep Fvg MT5 — 스마트 머니처럼 시장을 보세요, 차트 위에서 바로 이런 경험, 알고 계실 겁니다. 가격이 스톱을 훑고, 돌아서, 기대했던 방향으로 그대로 갑니다. 방향은 맞았습니다. 틀린 것은 진입뿐이었습니다. 이 지표는 그런 일이 덜 일어나도록 만들어졌습니다. 분석에서 가장 무거운 부분—차트 마킹—을 대신하고, 진짜 중요한 것인 결정은 당신에게 남깁니다. 차트에서 보이는 것 시장 구조 — 실제 구조적 고점·저점에 HH / HL / LH / LL 라벨과 레벨 라인. 추측 없이 추세가 바로 보입니다. 불균형 구간(FVG) — 가격이 너무 빠르게 지나갔고 나중에 자주 되돌아오는 영역. 열린 구간과 이미 메워진 구간은 다른 색으로 표시됩니다. 유동성 행동 — 반전 전에 시장이 레벨을 훑는 순간을 추적합니다. 완성된 트레이드 레이아웃 — 진입 화살표, 손절 레벨, 이익 목표. 모두 그려져 있어 머릿속 계산이 필요 없습니다. 추세 필터 — 상위 타임프레임 라인으로
Gold Xausd Hunter
Metin Erkamoglu
5 (2)
MATADOR GOLD XAUUSD M5 Scalp Signals for MT5 MATADOR GOLD is a decision-support indicator for MetaTrader 5, designed for traders who analyze short-term Gold movement on the M5 timeframe. The indicator does not open, close, or manage trades automatically. It provides buy and sell signal guidance so the user can make their own trading decisions according to their risk plan, broker conditions, and trade management rules. Main purpose MATADOR GOLD is built to help traders avoid noisy signal flow and
Footprint is an indicator for order flow and volume analysis. It helps identify market structure at the cluster level, find key zones with increased activity, and work with filters directly on the chart without constantly opening the settings window. Footprint Indicator Features cluster-based Bid x Ask and Delta charts; on-chart control panel; sliders for filter adjustments; Absorption; Initiative; Stacked Imbalances; Big Trades; dPOC / Dynamic Point of Control; Delta; side market profile; cumul
Historical Similarity Matcher Indicator (HI.SI.MA) Try it free today — demo version now available!   https://www.mql5.com/en/market/product/167114 Overview The Historical Similarity Matcher is a technical analysis indicator for MetaTrader 5. It scans historical price data to find segments that show statistical similarity to a user-selected reference period on the chart.
필터:
리뷰 없음
리뷰 답변