Titan SMC Pro
- 지표
- 버전: 6.0
- 업데이트됨: 10 5월 2026
- 활성화: 5

Titan SMC Ultimate Suite
Titan SMC Ultimate Suite, yüksek hassasiyet, netlik ve yapısal doğruluk sağlamak üzere tasarlanmış hepsi bir arada Smart Money Concepts (SMC) analitik çerçevesidir. Gelişmiş bir Piyasa Yapısı motorunu kapsamlı likidite arama mekanizmalarıyla entegre ederek, bu paket yatırımcılara birleşik bir teknik matris sunar ve tek bir grafikte birden fazla örtüşen gösterge ihtiyacını ortadan kaldırır.
6.00 sürümünde yenilikler:
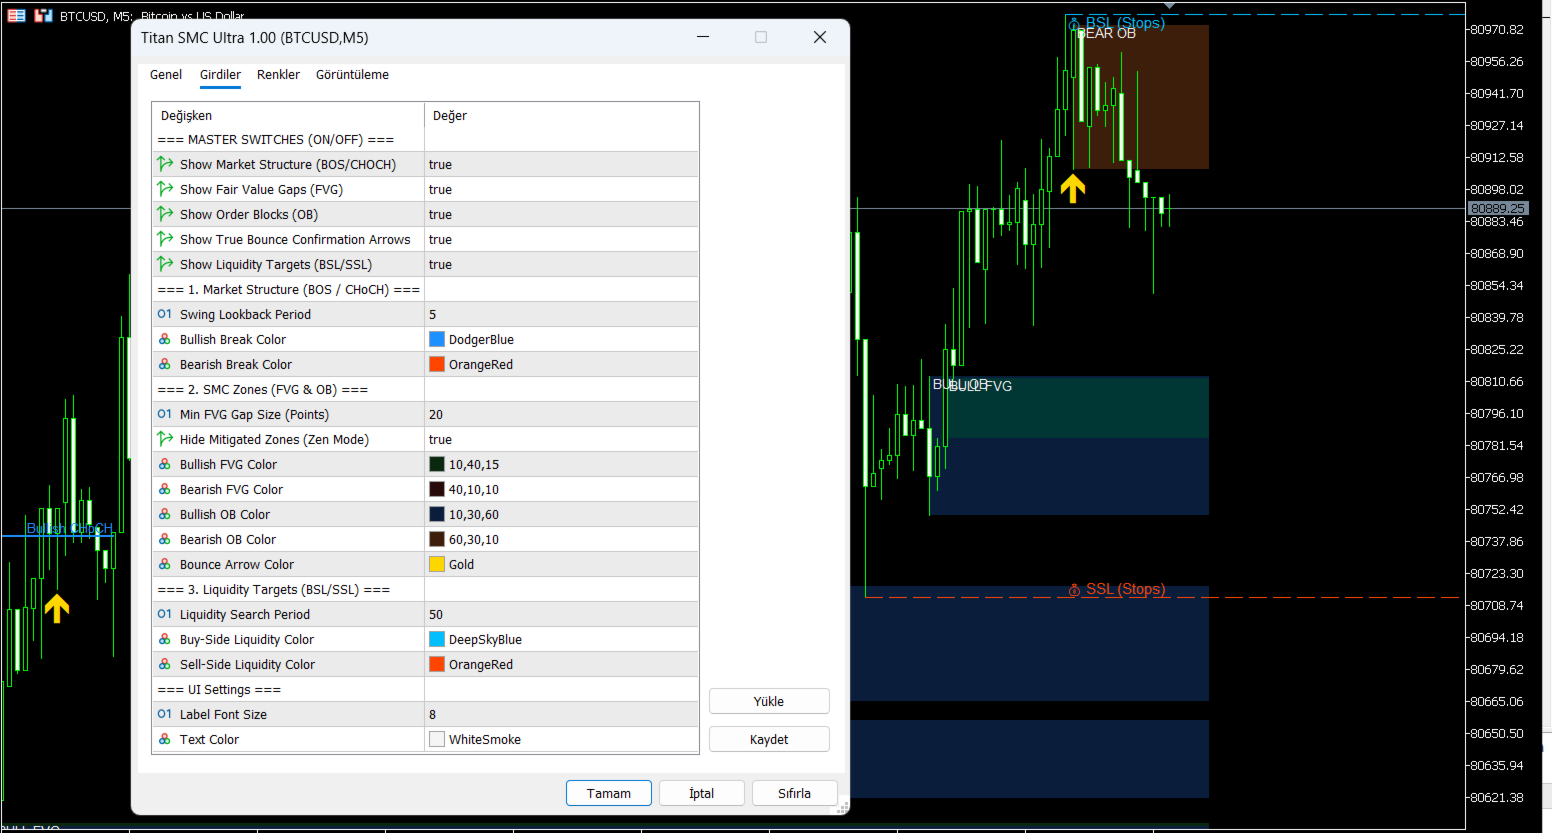
Çekirdek motor sıfırdan yeniden tasarlandı ve giriş parametreleri içinde sezgisel bir "Master Switch" Kullanıcı Arayüzü eklendi. Bu, yatırımcıların Piyasa Yapısı (BOS/CHOCH), Adil Değer Boşlukları (FVG'ler), Sipariş Blokları (OB) ve Likidite Havuzları gibi bireysel yapısal öğeleri anında değiştirmelerini sağlar; böylece özel analitik gereksinimlere göre tamamen özelleştirilmiş bir grafik ortamı oluşturulur ve görsel gürültüyü en aza indirir.
Temel Özellikler:
-
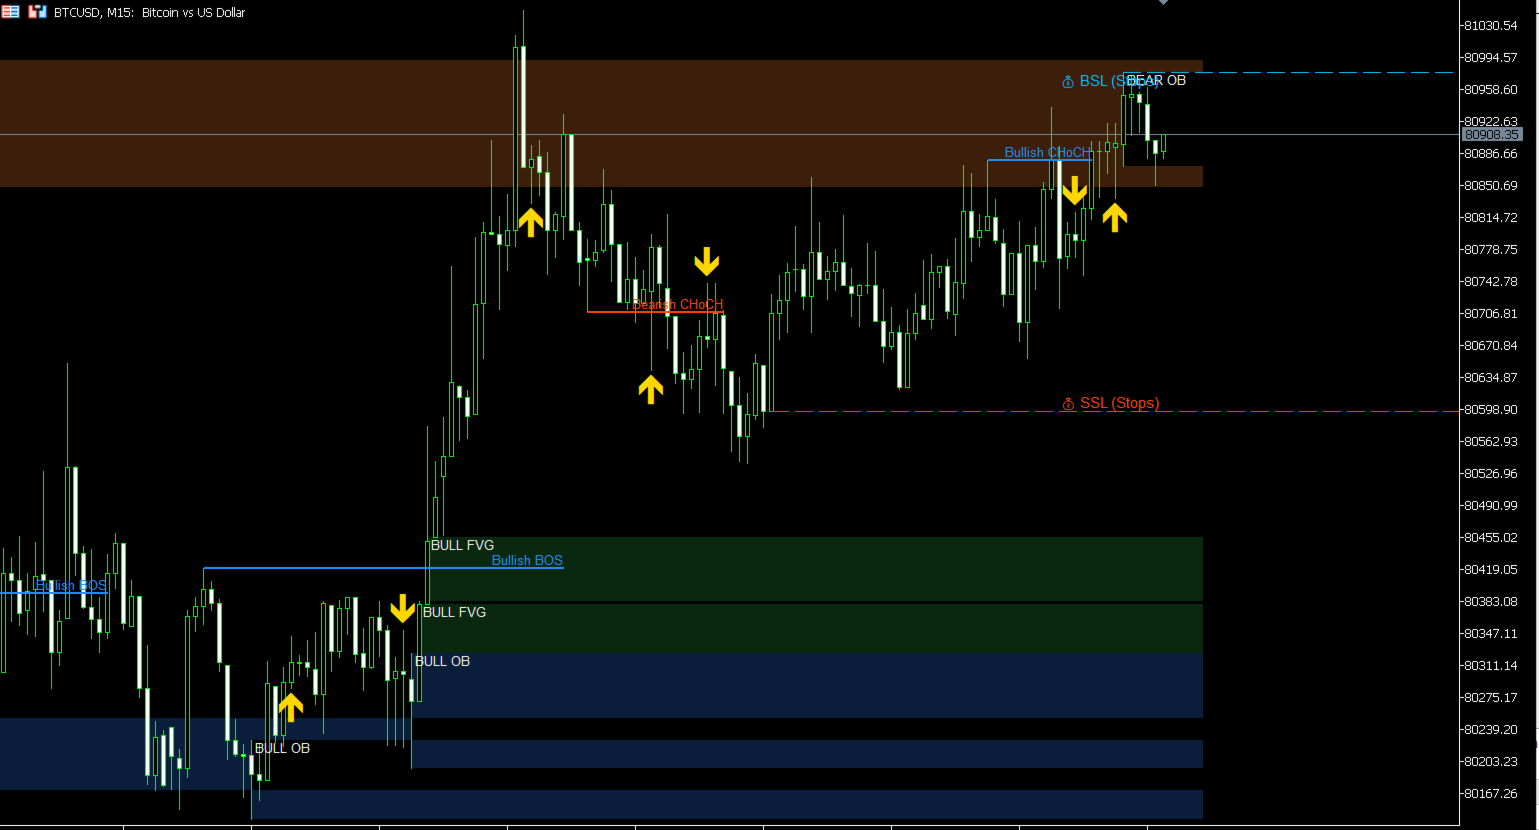
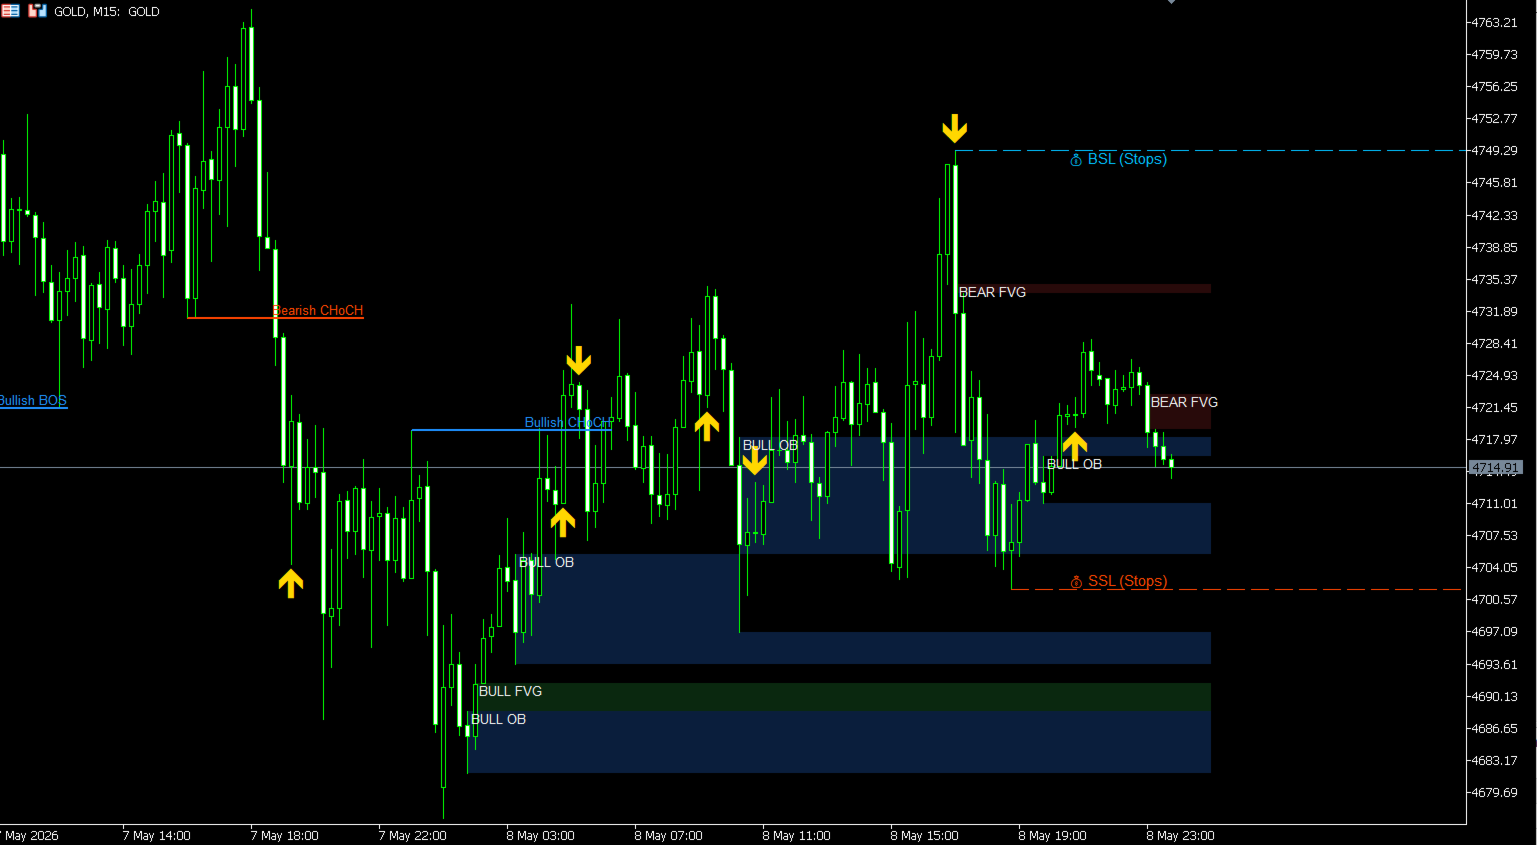
Otomatik Likidite Hedefleri (BSL/SSL): Dinamik Buyside Likidite (BSL) ve Satma Tarafı Likidite (SSL) havuzlarını otomatik olarak tanımlar ve projeksiyon, yüksek olasılıklı kurumsal mıknatıs bölgelerini ve nesnel kâr hedeflerini vurgular.
-
Hassas Piyasa Yapısı: Gerçek zamanlı, yeniden boyanmayan Yapı Kırılması (BOS) ve Karakter Değişikliği (CHOCH) tespitine, sıkı mum gövdesi kapanış doğrulama mantığına dayanır.
-
Dinamik Azaltma Motoru (Zen Modu): Korumalar, fiyat hareketiyle tamamen azaltıldığında Adil Değer Boşlukları ve Sipariş Bloklarını otomatik olarak kaldırır veya ortadan kaldırır.
-
Yapısal Zıplama Doğrulama Okları: Ana bölgelerdeki şamdanları (pin barları ve yutucu desenler gibi) izleyen bir fiyat eylemi doğrulama modülü içerir. Yapısal reddetme doğrulandığında net bir yön oku basar.
-
Optimize Çekirdek Mimarisi: Yüksek optimize edilmiş çok iş parçacıklı çalıştırma özelliğine sahiptir; bu özellik, karmaşık SMC verilerinin geniş tarihsel çubukları işlenirken bile stabil terminal performansı ve minimum gecikme sağlar.
Ticaret Uygulaması ve Stratejisi:
-
Likidite Süpürmesi: Büyük bir Likidite Havuzunu (BSL veya SSL) süpüren bir genişleme için piyasayı takip edin.
-
Yapısal Değişim: Yön yanlılığı oluşturmak için mum gövdesi yakınında onaylanan karşı trend Karakter Değişikliği (CHOCH) bekleyin.
-
Bölge Tanımlaması: Yapısal değişimin geride bıraktığı yeni oluşan, dengesiz Adil Değer Boşluklarını veya Sipariş Bloklarını bulun.
-
Onay ve Uygulama: Fiyatın bu prim/indirim bölgelerine geri çekildiğinde giriş pozisyonlarını değerlendirin ve yapıyı yapısal zıplama oku ile doğrulayın.
Önerilen Konfigürasyonlar:
-
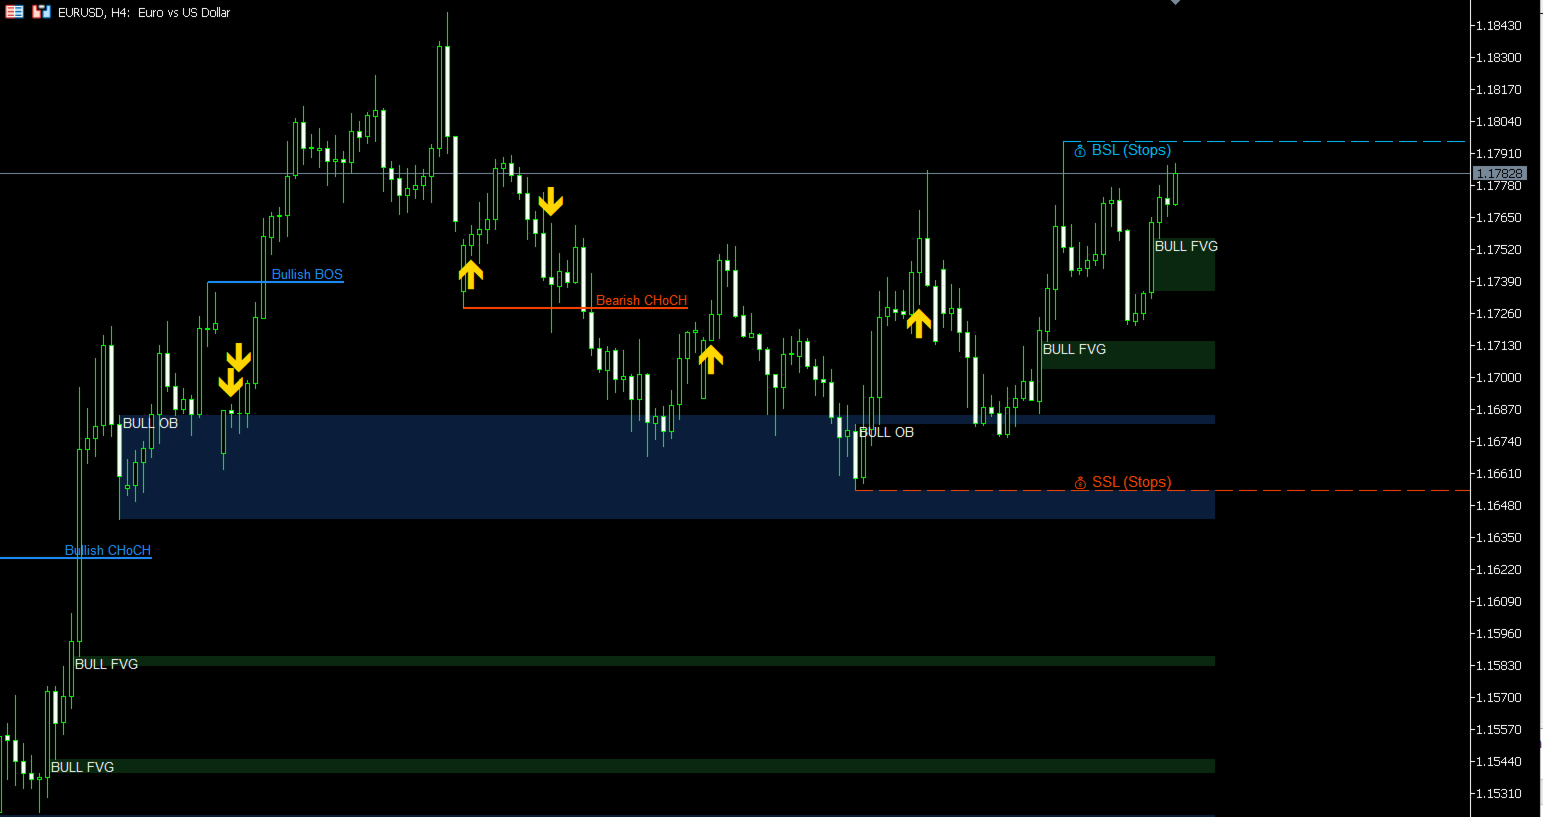
Desteklenen Varlıklar: Büyük döviz çiftleri (FX Majors), Hisse Senedi Endeksleri (örneğin NASDAQ, US30) ve yüksek likiditeli Kripto Para Yatırımları (BTCUSD, ETHUSD) için optimize edilmiştir.
-
Zaman Dilimleri: M15'in gün içi uygulama ve giriş iyileştirmesi için kullanılması, H1 ve H4 grafiklerinin makro yön önyargısı için izlenmesi şiddetle tavsiye edilir.