Volume Spread Analysis
- 지표
- 버전: 1.30
- 업데이트됨: 18 11월 2021
- 활성화: 10

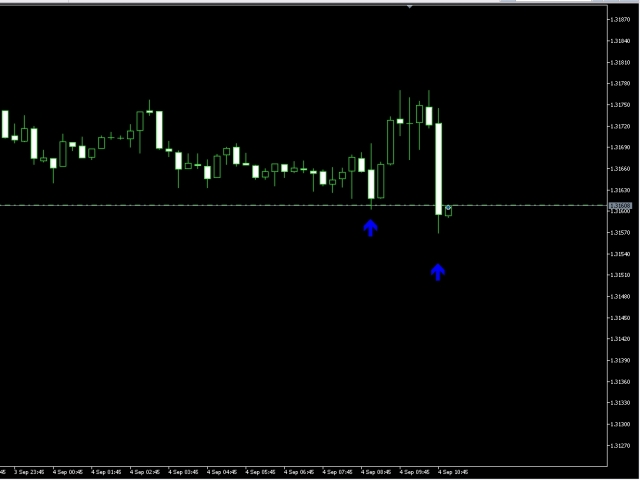
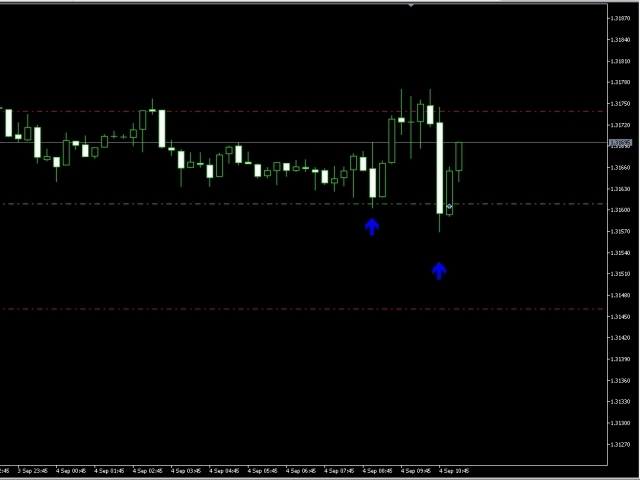
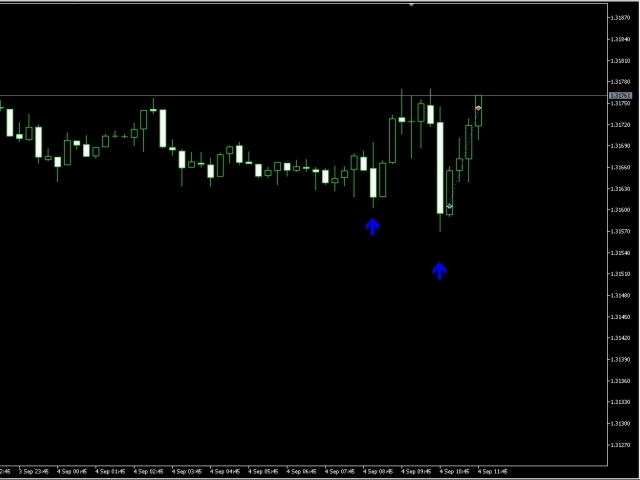
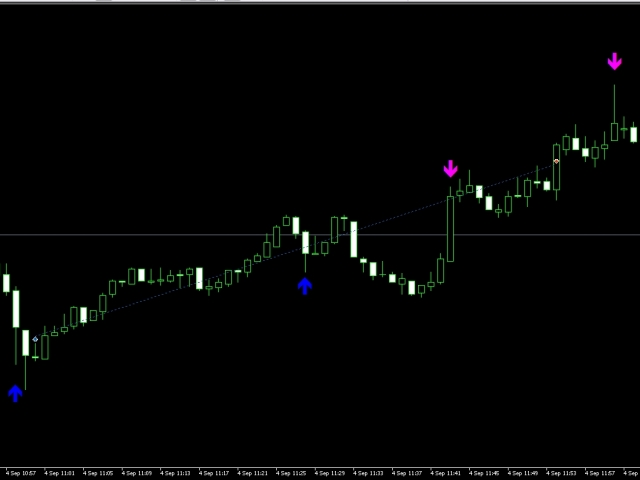
The indicator produces signals according to the methodology VSA (Volume Spread Analysis) - the analysis of trade volume together with the size and form of candlesticks. The signals are displayed at closing of bars on the main chart in the form of arrows. The arrows are not redrawn.
Input Parameters:
- DisplayAlert - enable alerts, true on default;
- Pointer - arrow type (three types), 2 on default;
- Factor_distance - distance rate for arrows, 0.7 on default.
Recommended timeframe - М15. Currency pair - any. The screenshots demonstrate a real deal on EURUSD М15 (from entry to closing the profit) and the M1 view.