Session Bias and Signals Pro
- 지표
-
Sizolwethu Dlodlo
 I am a Quantitative Trader and Systems Specialist at FX Momentum, specializing in momentum-based strategies for XAUUSD and GBPUSD. Uniquely positioned at the intersection of finance and technology, Leveraging a deep background in IT infrastructure and low-latency systems—forged supporting major
 - 버전: 1.0
Session Bias & Trade Signals in one tool.
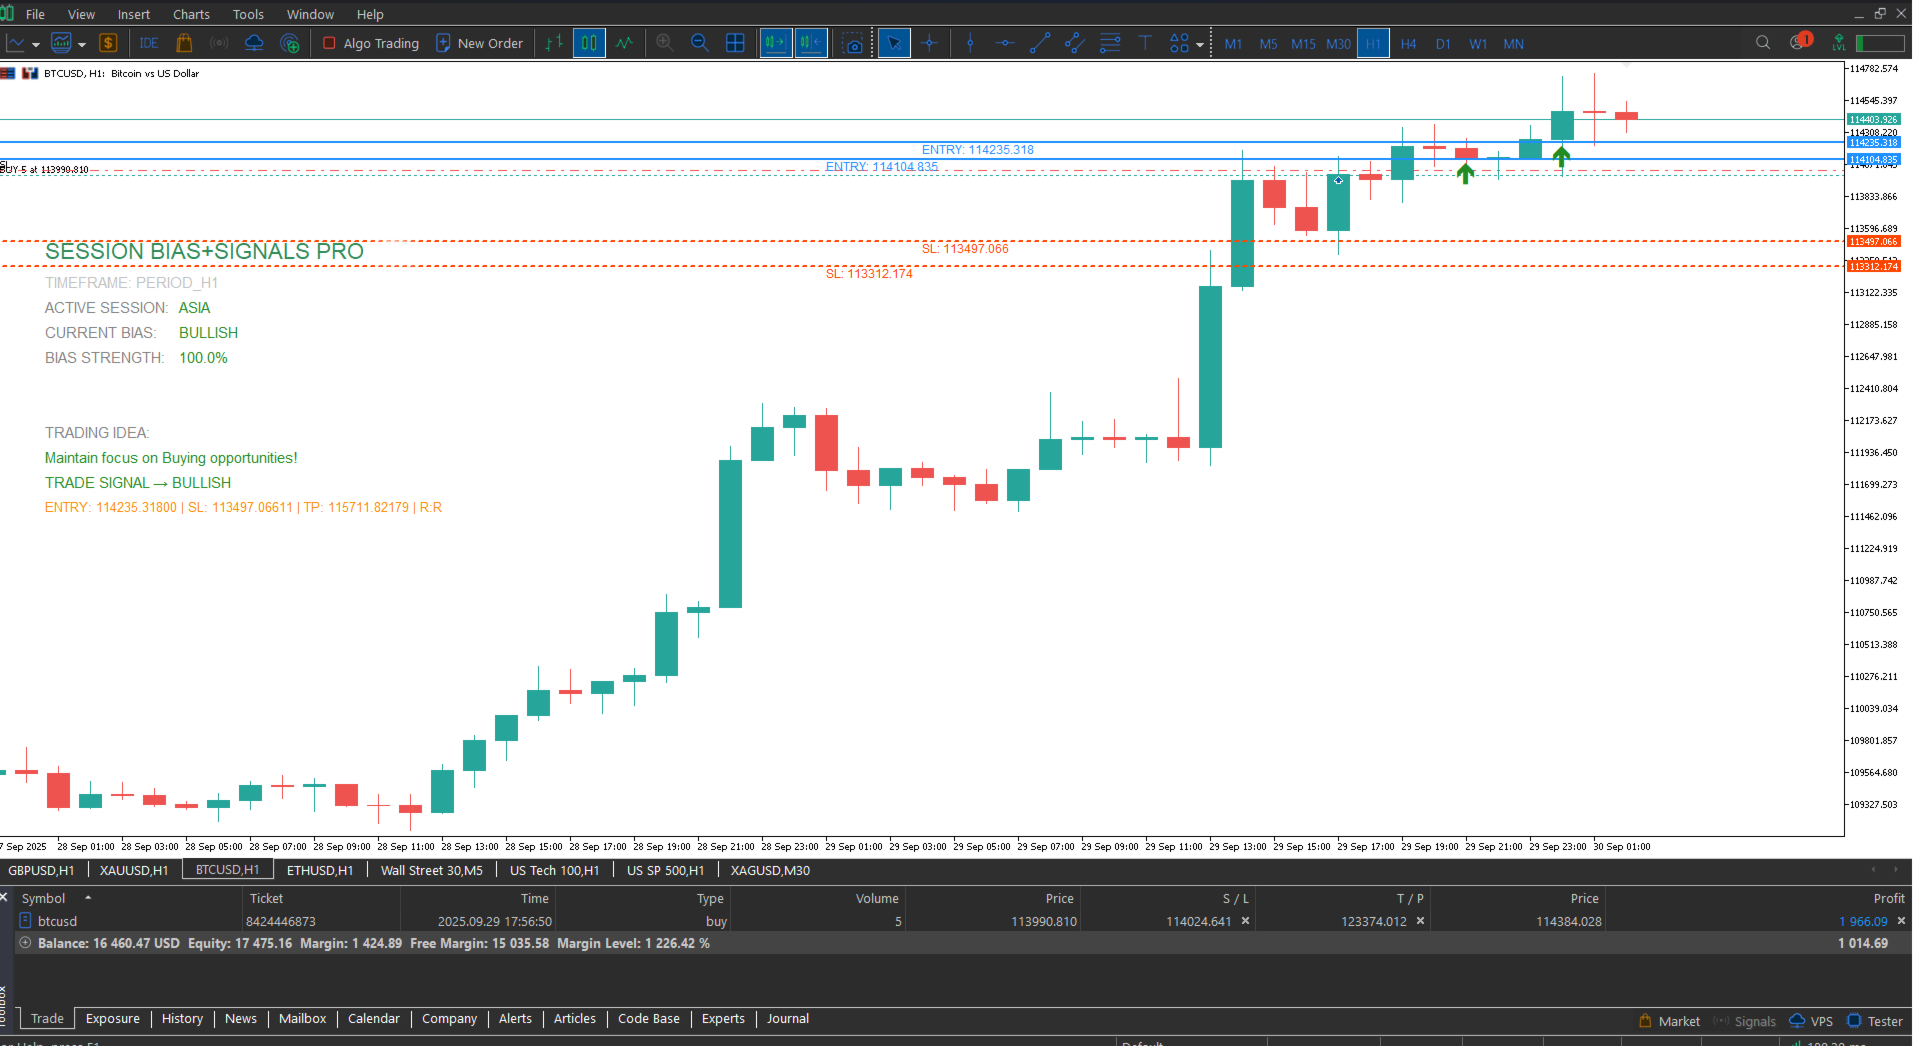
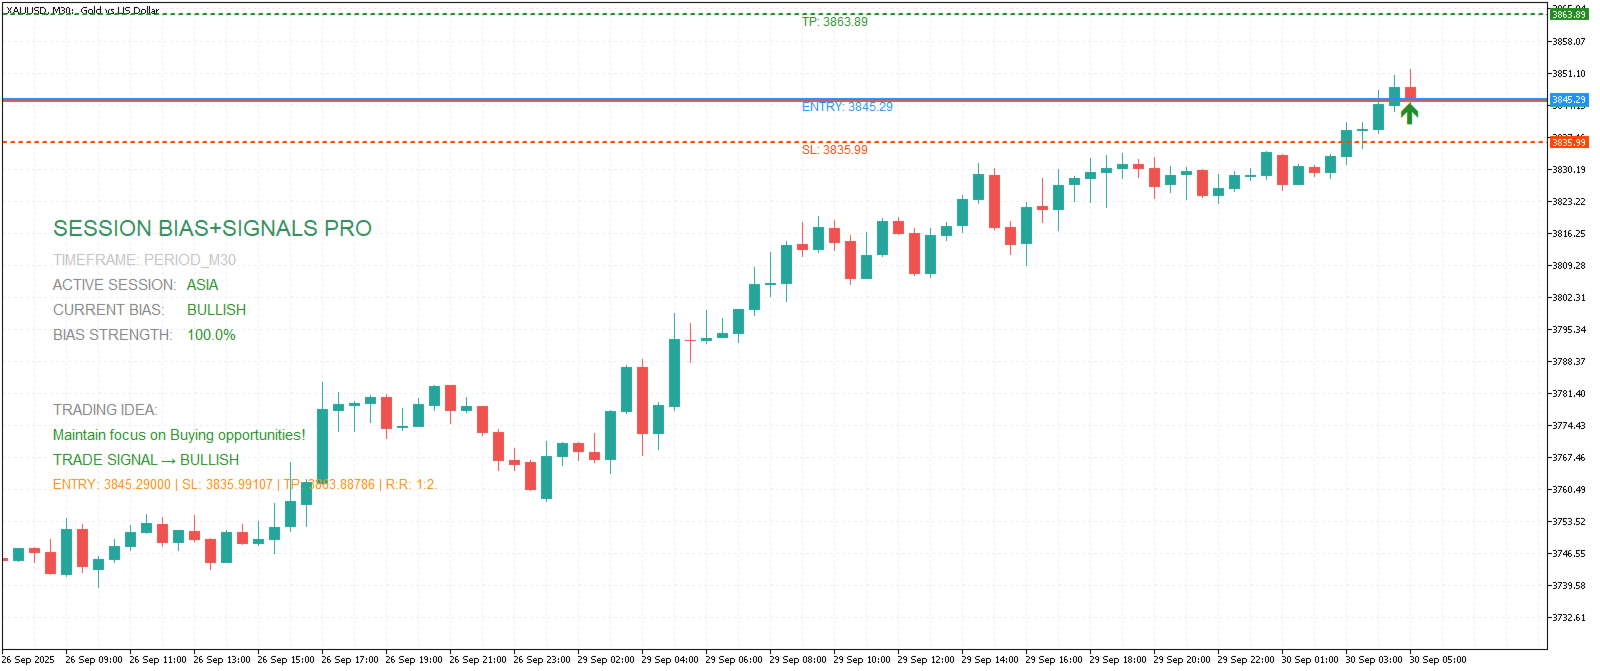
Detects Asia, London & NY session trends, shows bias strength, alerts bias flips, and plots Entry/SL/TP levels with R:R. Simple dashboard for quick decisions.
Simple but powerful trading assistant.
This indicator automatically detects the market bias during the Asia, London, and New York sessions.
It helps traders stay on the right side of the trend, avoid neutral zones, and catch bias flips with alerts.
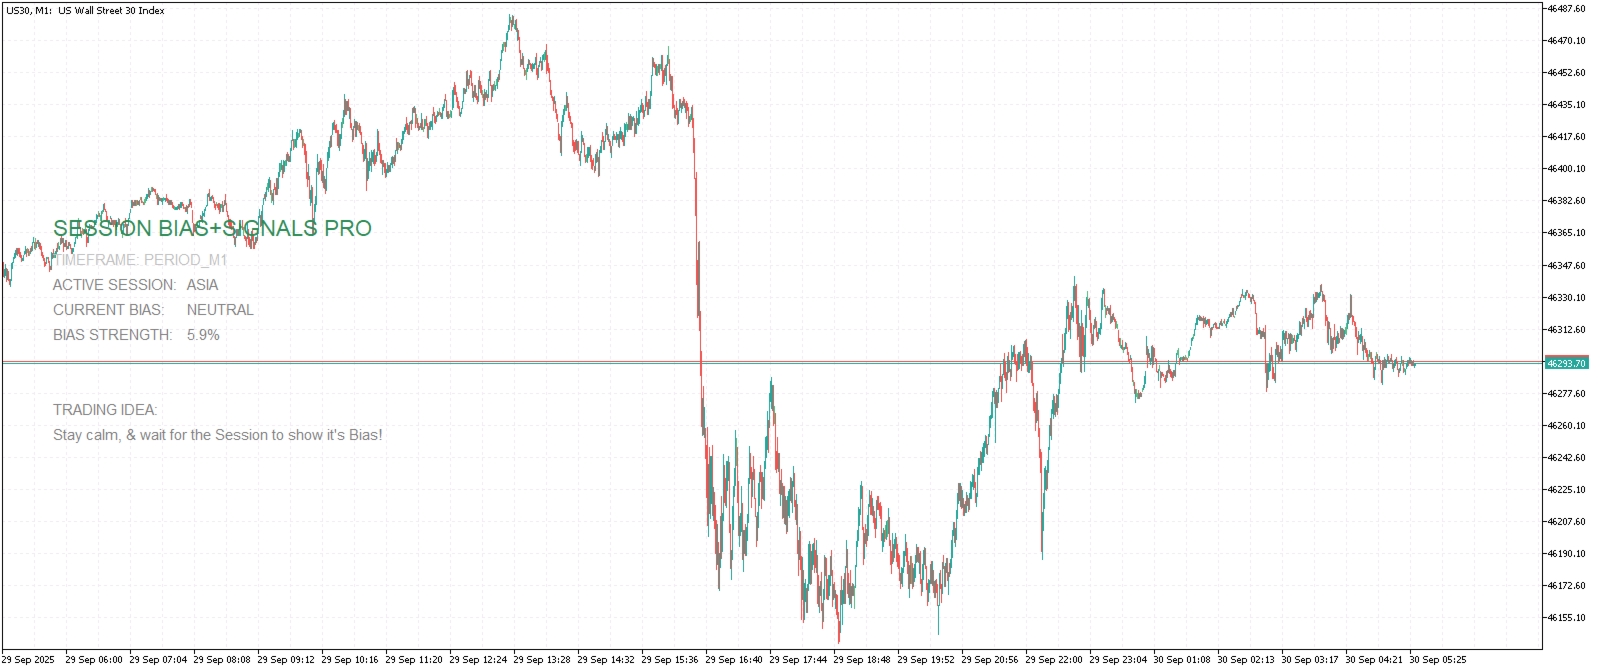
✅ Bias Detection – Shows session bias as Bullish, Bearish or Neutral.
✅ Bias Strength Meter – Measure of trend confidence (0–100%).
✅ Bias Flip Alerts – Get notified when market bias changes.
✅ Visual Trade Signals – Entry, Stop Loss & Take Profit levels plotted on the chart.
✅ Risk-to-Reward Display – Every trade idea shows R:R ratio.
✅ Session Dashboard – Clean, simple panel with all important info in one place.
Good for both beginners and experienced traders.
Beginners can follow the clear dashboard, while experienced traders can use it to confirm entries.
-
Attach the indicator to any chart and timeframe.
-
The dashboard will show:
-
Current active session (Asia, London, or New York)
-
Market bias (Bullish / Bearish / Neutral)
-
Bias strength in %
-
Bias flip alerts
-
Trade signals with Entry, SL & TP levels
-
-
Wait for clear bias + strong signal before trading.
-
Use the visual levels (Entry, SL, TP) to manage trades.
-
Alerts Settings – Enable/disable bias flip and trade signal alerts.
-
Dashboard Settings – Choose dashboard corner, size, and position.
-
Trade Signals Settings – R:R ratio, signal strength filter, colors.
-
Visual Signals – Show/hide entry, SL, TP levels and labels.
-
Session Settings – Asia, London, and New York session times.
-
Colors – Choose bias, signal, and dashboard colors.
⚠️ This indicator does not open trades automatically.
It is a decision-support tool for manual or EA-assisted trading.
Always use proper risk management.
Installation
-
Download the indicator from the MQL5 Market.
-
Open MetaTrader 5.
-
Go to File → Open Data Folder.
-
In the opened window, navigate to:
MQL5 → Indicators -
Copy the indicator file into this Indicators folder.
-
Restart MetaTrader 5 (or refresh the Navigator panel).
-
The indicator will appear under Navigator → Indicators → Market.
How to Use
-
Open a chart of your preferred symbol (e.g. EURUSD, XAUUSD).
-
Attach the indicator from the Navigator panel.
-
The dashboard will appear on the chart:
-
Active trading session (Asia / London / New York)
-
Current bias (Bullish / Bearish / Neutral)
-
Bias strength in %
-
Alerts if bias flips
-
Trade signals with entry, SL, and TP levels
-
-
Wait for clear bias + strong signal before entering a trade.
-
Use the visual lines (Entry, SL, TP) for trade execution and management.
-
Customize input parameters (alerts, sessions, colors, dashboard size, R:R ratio) in the indicator settings.
Tips
-
Best used on London and New York sessions where market volatility is higher.
-
Combine with your own analysis for confirmation.
-
Always apply proper risk management.
⚠️ Disclaimer:
This indicator is a decision-support tool.
It does not open trades automatically.
Trading involves risk. Past results do not guarantee future performance.
1. Does the indicator work on all pairs?
👉 Yes. It works on all Forex pairs, indices, metals (like Gold/XAUUSD), and crypto.
2. Which timeframes are best?
👉 Works on all timeframes. Best results are usually on M15, H1, and H4 during active sessions (London & New York).
3. Does the indicator repaint?
👉 No. All signals and bias flips are based on closed candles, so they do not repaint.
4. Can I use it with my own strategy?
👉 Yes. Many traders use the session bias as confirmation for their own strategies.
5. Does it open or close trades automatically?
👉 No. This is not an Expert Advisor (EA). It gives signals, alerts, and visual levels. You manage trades manually.
6. Can I use it on multiple charts at once?
👉 Yes. You can attach the indicator to several charts at the same time.
7. Will I receive alerts on my phone?
👉 Yes. If you enable MetaTrader push notifications or email alerts, you can receive bias flip and trade signal alerts on your phone.
8. What does the Bias Strength % mean?
👉 It shows how strong the bias is.
-
Below 30% = Weak / Neutral
-
30–60% = Moderate
-
60%+ = Strong bias
9. Can I use it for scalping or long-term trading?
👉 Both. Scalpers can use lower timeframes (M5–M15), while swing traders can use higher timeframes (H1–H4, Daily).