EMAtrix

🧠 Adaptive EMA Complete System

Intelligent Self-Optimizing Moving Average System

🎯 WHAT THE INDICATOR DOES

The Adaptive EMA Complete System is an advanced indicator that manages 4 exponential moving averages with periods that automatically adapt to market conditions. Unlike traditional static EMAs, this system continuously analyzes historical performance and optimizes periods to maximize signal effectiveness in real-time.

⚙️ HOW THE SYSTEM OPERATES

🔄 Intelligent Optimization Engine

The system operates with two calculation modes:

  • 🚀 CONTINUOUS MODE: More frequent optimization for volatile markets
  • ⚖️ FIXED N-BARS MODE: Stable optimization every N bars for greater consistency

📊 Optimization Process

  1. Data Collection: Stores prices from the last N periods (configurable lookback)
  2. Combination Analysis: Tests thousands of EMA period combinations
  3. Performance Evaluation: Calculates a fitness score based on:
    • Sharpe Ratio (return/volatility ratio)
    • Win Rate (percentage of successful signals)
    • Profit Factor (profit/loss ratio)
    • Maximum Drawdown (maximum consecutive loss)
  4. Smooth Transition: Gradually changes periods to avoid abrupt jumps

🎯 Signal Generation

The system generates BUY/SELL signals when:

  • EMA1 crosses EMA2 (base signal)
  • EMAs maintain hierarchical order (EMA1 < EMA2 < EMA3 < EMA4)
  • Minimum EMA separation is respected (anti-noise filter)
  • Cooldown period has expired (prevents excessive signals)

📈 CORE FEATURES

🧮 4-EMA Adaptive System

  • EMA1: Fast (8-16 periods range, configurable)
  • EMA2: Medium (20-30 periods range, configurable)
  • EMA3: Slow (40-60 periods range, configurable)
  • EMA4: Very Slow (80-120 periods range, configurable)

🎛️ Advanced Controls

  • Lookback Period: Defines how many bars to analyze (default: 100)
  • Optimization Frequency: How often to recalculate periods (default: 50 bars)
  • Smoothing Factor: Controls transition speed between period changes (0.2)
  • Minimum EMA Separation: Prevents signals in ranging markets (5 points)
  • Signal Cooldown: Minimum bars between signals (3 bars)

🔍 Signal Validation System

  • Basic Mode: Simple EMA crossover signals
  • Enhanced Mode: Multi-layer validation including:
    • Price position relative to EMAs
    • EMA hierarchy confirmation
    • Minimum separation requirements
    • Market structure analysis

📊 REAL-TIME PERFORMANCE TRACKING

📈 Comprehensive Statistics

  • Total Signals: Complete count of generated signals
  • Buy/Sell Breakdown: Separate tracking for long and short signals
  • Win Rate Analysis: Success percentage for each signal type
  • Average Returns: Mean profit/loss per signal type
  • Overall P&L: Cumulative performance tracking

🎯 Signal History Management

  • 50-Signal Buffer: Stores recent signal performance data
  • Automatic Evaluation: Calculates P&L after 5-bar holding period
  • Performance Updates: Real-time win rate and return calculations
  • Historical Analysis: Tracks optimization effectiveness over time

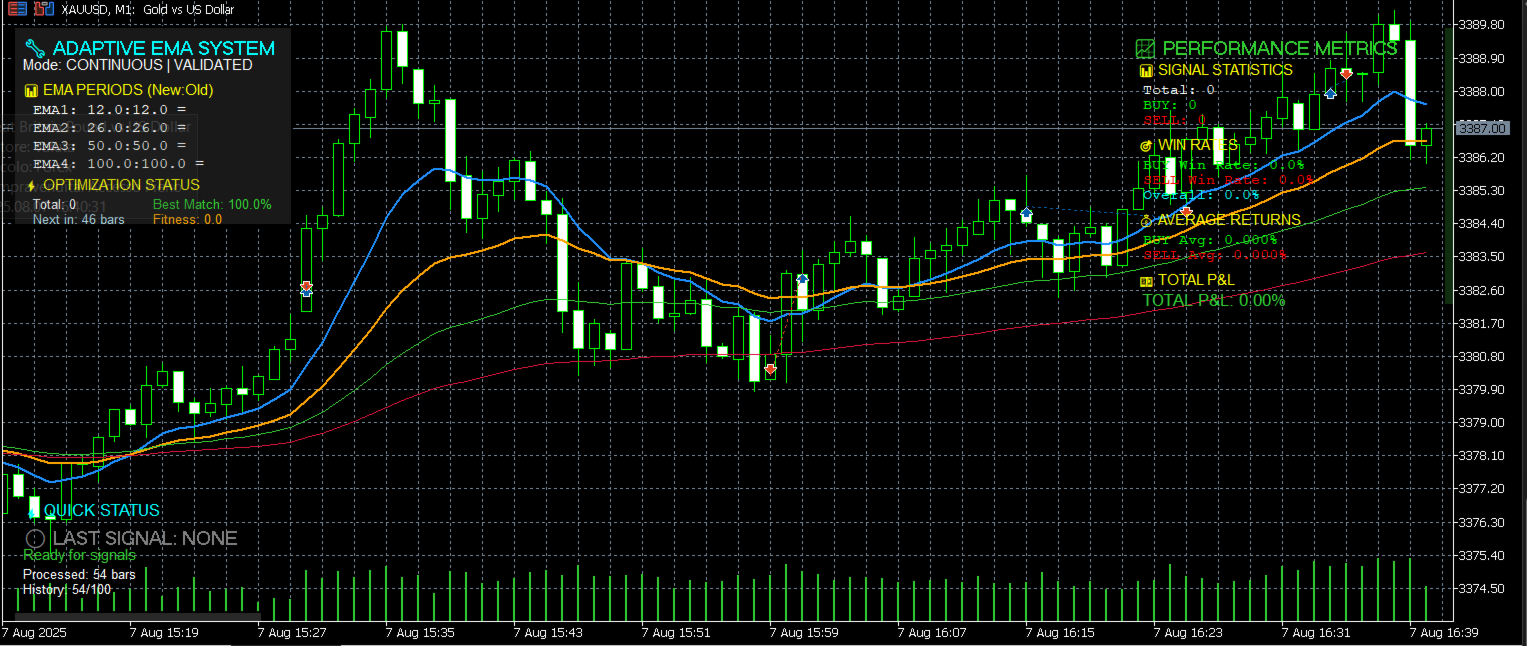
🖥️ PROFESSIONAL INTERFACE

📱 Three Information Panels

🔧 Main System Panel

  • Current calculation method (Continuous/Fixed-Bars)
  • Signal validation mode (Basic/Enhanced)
  • Live EMA periods with change indicators
  • Optimization status and countdown to next optimization
  • System fitness score and performance metrics

📈 Performance Metrics Panel

  • Signal statistics (total, buy, sell counts)
  • Win rates for each signal type
  • Average returns per signal category
  • Total cumulative P&L
  • Performance trend indicators

⚡ Quick Status Panel

  • Last signal generated (Buy/Sell/None)
  • Signal cooldown status
  • Bars processed counter
  • Price history cache status
  • Last optimization timestamp

🔔 NOTIFICATION SYSTEM

📢 Multiple Alert Types

  • Popup Alerts: Detailed signal information windows
  • Sound Notifications: Customizable audio alerts (configurable .wav files)
  • Push Notifications: Mobile device alerts
  • Telegram Integration: External bot support for instant messaging

🎯 Smart Filtering

  • Validation-Only Mode: Send alerts only for enhanced validated signals
  • Signal Type Selection: Choose to receive buy-only, sell-only, or both
  • Comprehensive Data: Each notification includes all relevant trading data

⚙️ TECHNICAL SPECIFICATIONS

🔧 Calculation Method

  • EMA Alpha Calculation: Uses 2/(period+1) formula for optimal responsiveness
  • Price Cache System: Maintains rolling buffer of recent prices for analysis
  • Fitness Algorithm: Multi-factor scoring system for period optimization
  • Smooth Transitions: Gradual period changes using configurable smoothing factor

📊 Performance Evaluation

The system evaluates EMA period combinations using:

  • Historical signal performance over lookback period
  • Risk-adjusted returns (Sharpe ratio optimization)
  • Win rate maximization
  • Drawdown minimization
  • Signal frequency optimization

🎨 Visual Elements

  • 4 Color-Coded EMAs: Clear visual distinction (Blue, Orange, Green, Red)
  • Signal Arrows: Buy (green up) and Sell (red down) markers
  • Optimization Markers: Shows period changes on chart
  • GUI Panels: Professional information displays with real-time updates

🎯 PRACTICAL APPLICATIONS

📈 Trading Scenarios

  • Trend Following: Adaptive EMAs automatically adjust to trend strength
  • Volatility Adaptation: System responds to changing market volatility
  • Multi-Timeframe: Works effectively across all timeframes
  • Universal Markets: Suitable for Forex, Stocks, Commodities, Crypto

⏱️ Optimization Timing

  • Market Open: Increased optimization frequency during high volatility
  • Trend Changes: System adapts quickly to new market conditions
  • Consolidation: Reduces optimization frequency in ranging markets
  • News Events: Responds to sudden volatility changes

🛠️ CONFIGURATION OPTIONS

🎛️ Customizable Parameters

  • Period Ranges: Set min/max values for each EMA
  • Optimization Settings: Control when and how often periods are recalculated
  • Signal Filters: Adjust validation criteria and separation requirements
  • Visual Settings: Customize colors, sizes, and display options
  • Notification Preferences: Choose alert types and conditions

📋 Default Settings

  • Lookback: 100 bars for historical analysis
  • Optimization Frequency: Every 50 bars (Fixed-Bars mode)
  • EMA Ranges: 8-16, 20-30, 40-60, 80-120 periods
  • Smoothing: 0.2 factor for gradual transitions
  • Cooldown: 3 bars minimum between signals

💡 KEY ADVANTAGES

Self-Adapting: No manual parameter adjustment required

Market Responsive: Automatically adjusts to changing conditions

Performance Tracked: Comprehensive statistics for informed decisions

False Signal Reduction: Advanced validation filters noise

Professional Interface: Clear, informative display panels

Flexible Configuration: Customizable for different trading styles

Multi-Modal Operation: Choose between continuous or fixed optimization

The Adaptive EMA Complete System represents a new generation of intelligent technical indicators that evolve with market conditions, providing traders with dynamic, performance-optimized signals backed by comprehensive statistical analysis.


추천 제품
Nyse Usdxy
Mitchell Dean Ede
5 (1)
Displays a USD DXY chart in a seperate window below the main chart. YOUR BROKER MUST HAVE THESE SYMBOLS FOR THE INDICATOR TO WORK Based on EUR/USD, USD/JPY, GBP/USD, USD/CAD, USD/CHF and USD/SEK All these pairs must be added to Market Watch for the indicator to work correctly As this is calculated using a formula based on the 6 pairs it will only work when the market is open. YOUR BROKER MUST HAVE THESE SYMBOLS FOR THE INDICATOR TO WORK Displays a USD DXY chart in a seperate window below the m
FREE
Breaker Blocks
Navdeep Singh
Market structures, Market balance, Range breakouts This tools helps to identify areas of market ranges, structures and plots colored boxes on breakout of those areas. User is given the option to receive alerts and notifications on the formation of the blocks. The tool has the ability to become an essential part of a technical trading system or even pure price action trading. Usage:- An essential tool for price action or technical traders.  More information in the blog
This code creates a custom indicator for the MetaTrader 5 platform. The indicator generates strong buy and sell signals using a combination of ZigZag, Moving Average (MA), and Relative Strength Index (RSI). Here’s a detailed explanation of the code: Indicator Definition and Features: The indicator is displayed in the chart window. It uses 5 indicator buffers and 3 plots. Separate graphs are defined for ZigZag, buy signals, and sell signals. Input Parameters: Various parameters are defined for Z
Graphic Alignment Context
Ricardo Alexandre Laurentino
The Graphic Alignment Context (GAC) Technical Indicator measures the vertical difference of the simple average price of a financial instrument in the context of three different timeframes determined by a defined number of bars or candles (periods) to determine the strength of the buy or sell trend. sale. Ascending average prices indicate Buying strength (1), Descending average prices indicate Selling strength (-1) and any scenario different from the previous two conditions indicates Neutrality
FREE
Just $10 for six months!!!. This will draw Order Blocks just by clicking on a candle with different colors for different time frames. It will use the body or the wicks. It can also draw the mean threshold of the candle open/close or high/low. As a drawing tool, it is not active all the time after adding it to the chart. Activate by pressing 'b' twice on the keyboard within a second. If activated but then decided not to draw, deactivate by pressing 'b' once.  Box color depends if candle is abo
Multi TF Trend Dashboard
Watcharapon Sangkaew
Multi-TF Trend Dashboard Short Description / Slogan: See the entire market trend in a single glance! A simple, clean, and powerful dashboard for every trader. Full Description: (1. For Free Distribution) Hello MQL5 Community, I am excited to share the Multi-TF Trend Dashboard , a tool I developed to simplify trend analysis. This indicator is offered completely free as a contribution to this amazing community. (2. Indicator's Functionality) Are you tired of constantly switching between timeframe
FREE
Previous Day Close
Vincent Kipleting Burugo
The indicator is a line right at yesterday's closing price. With the indicator, there is no need for adding or deleting previous day close lines each new day. T he line gives you an instant visual reference point for support, resistance, and market sentiment.   Whether you are day trading or swing trading, this line helps you quickly gauge where the market closed last session and how current price action relates to that level. It works seamlessly across all timeframes - from 1-minute charts to d
FREE
Provlepsis 지표에 오신 것을 환영합니다. "Provlepsis"는 MQL 마켓을 위해 개발된 고급 지표입니다. 같은 시간대의 이전 바를 분석하여 시장 움직임의 잠재적 범위를 정확하게 계산하여 향후 가격 변동에 대한 소중한 통찰력을 제공합니다. 전통적인 ATR 지표와 달리 "Provlepsis"는 시간 요소를 고려하여 다양한 시장 조건에 적응하는 더 강력한 도구입니다. 밤에는 좁은 범위를 예측하고 활발한 거래 시간대에는 더 넓은 범위를 예측합니다. "Provlepsis"가 제공하는 포괄적인 범위 분석으로 거래 전략에서 경쟁 우위를 확보하세요. 여기에서 Provlepsis 지표의 길이와 시프트를 변경할 수 있는 전체 버전을 확인할 수 있습니다! https://www.mql5.com/ko/market/product/98802 프로블렙시스 사용의 이유 범위 기반 트레이딩: 이 지표는 시장 움직임의 잠재적 범위를 식별하는 능력으로 범위 기반 트레이딩 전략에 가치를 제공할 수 있
FREE
CChart
Rong Bin Su
Overview In the fast-paced world of forex and financial markets, quick reactions and precise decision-making are crucial. However, the standard MetaTrader 5 terminal only supports a minimum of 1-minute charts, limiting traders' sensitivity to market fluctuations. To address this issue, we introduce the Second-Level Chart Candlestick Indicator , allowing you to effortlessly view and analyze market dynamics from 1 second to 30 seconds on a sub-chart. Key Features Support for Multiple Second-Level
TilsonT3
Jonathan Pereira
5 (1)
Tillson's T3 moving average was introduced to the world of technical analysis in the article ''A Better Moving Average'', published in the American magazine Technical Analysis of Stock Commodities. Developed by Tim Tillson, analysts and traders of futures markets soon became fascinated with this technique that smoothes the price series while decreasing the lag (lag) typical of trend-following systems.
FREE
New Day and New Week Opening Gap ICT NWOG NDOG MT5 The New Day and New Week Opening Gap ICT NWOG NDOG MT5 indicator is a powerful and practical tool designed for traders using MetaTrader 5. It helps detect price gaps that emerge at the start of a new trading day or week, making them visible on the chart. When the market closes at the end of a session, the reopening price may differ from the previous close, leading to a price gap. This indicator marks weekly price gaps ( NWOG ) in red and daily
FREE
DataFeeder
Joao Paulo Euko
Hi you, I need your help! Be my Patron, let's make it possible! https://www.patreon.com/joaopeuko https://github.com/Joaopeuko/Mql5-Python-Integration Esse Expert Advisor copia os dados("symbol,last,bid,ask") dos ativos que foram colocados na lista e só funciona enquanto o mercado esta aberto. Esse EA não é um link DDE ou RTD, as informações não são passadas em tempo real ao excel. O EA tem um delay de 30 segundos e o Excel tem um delay de 1 minuto. A vantagem desse EA é que ele dispensa o
FREE
Slow RSI
Flavio Javier Jarabeck
4.8 (5)
For those who feel that regular RSI is too fast and too noisy to be used on regular trades or in EAs and want to have an alternative to meter the Momentum of the Price, here is a solution presented on the great article of the Technical Analysis of Stocks & Commodities magazine (April, 2015), by Vitali Apirine, called: Slow Relative Strenght Index . Its reading is almost the same as the regular RSI, but its levels of Overbought and Oversold are 80 and 20 instead. SRSI is very powerful to show div
FREE
Breakout MV
Emmanouil Bampalos
Breakout MV :  This Expert Advisor offers you one of the most fundamental trading strategy,  combining Moving Average and Volums indicators!  Key Features : Consistent Performance : Breakout strategy has demonstrated a robust performance across various market conditions, by capitalizing on significant price movements. Strategic Trade Execution : We select the desired range, and once the price approaches these levels and the indicators confirm our entry, we open a trade. The trade will close eit
FREE
Color Trend
Bruno Goncalves Mascarenhas
Combining the best of Price Action , Directional Movement , and Divergence / Convergence analysis, the Candle Color Trend is the easy and reliable way to identify the direction of the trend. The indicator automatically paints the candles according to the premise that the upward trend is defined by prices that form a series of ascending tops and bottoms. On the other hand, the downward trend is defined by prices that form a series of descending tops and bottoms. Color Trend is certainly one of
FREE
Daily Drop Analyzer
Rafael Gazzinelli
Daily Drop Analyzer is a technical indicator for MetaTrader 5 that performs historical backtests based on daily drop entries. It analyzes up to 200 assets from the Market Watch to detect recurring entry levels within a configurable range. The calculation uses daily candles (default: 120 days) and tests percentage drops from 0% to -5% in steps (e.g., 0.1%). The optimal entry percentage is automatically selected based on your chosen criterion: Total Result or Recovery Factor . Results are displaye
FREE
NakaTrend
Ricardo De Andrade Nakano
2 (1)
"NakaTrend를 소개합니다: MetaTrader 5용 궁극적인 트렌드 감지기! 거래 경험을 혁신하시기 준비 되셨나요? NakaTrend를 만나보세요. 정확하고 쉽게 트렌드 변화를 식별하는 데에 최적의 인디케이터입니다. NakaTrend를 사용하면 시장 변동을 놓치지 않습니다. 상승 트렌드가 발생하면 NakaTrend가 초록색 달러 표시로 신호를 보내 구매 주문을 넣으라고 안내합니다. 그리고 하락 트렌드로 변할 때는 빨간색 달러 표시가 나타나 매도 주문을 넣을 때 최적의 시점임을 알려줍니다. 하지만 이것만이 아닙니다 - NakaTrend는 수동 주문 입력을 허용하여 귀하가 거래를 제어할 수 있도록 돕습니다. 당신의 직감과 NakaTrend의 통찰력이 수익성 있는 결과로 이끌어줍니다. 추측하거나 시대에 뒤떨어진 인디케이터에 의존하는 시대는 지났습니다. NakaTrend는 신뢰할 수 있는 명확하고 실행 가능한 신호를 제공하기 위해 고급 알고리즘을 활용합니다. 그리고 Nak
FREE
Simple MACD Expert
Abraao Moreira
3 (1)
Estratégia de negociação MACD O cálculo do MACD é executado uma vez a cada tick, e são considerados para fim de cálculo os três últimos resultados, para analisar o cruzamento da linha de zero, ou seja quando o último resultado for maior que 0 e o antepenúltimo não então há um cruzamento para cima e analogamente para baixo, quando um cruzamento é constatado o estado de uma variável de controle é alterado de "false" para "true", permitindo o abertura de uma posição caso a média de sinal também cru
FREE
The 4 headed dragon is an indicator that has two functions. 1) Set the background trend. 2) Mark the predominant trend. By combining these two indicator signals, we will be able to trade for or against the trend, adapting the signals to your reading of the market. You can download the demo and test it yourself. 1) Set the background trend.    Define four possibilities of trend that are the four heads of the dragon, marked by colors on the indicator, marking a) Powerful buying trend. b) Weak
This indicator uses a different approach from the previous version to get it's trendlines. This method is derived from Orchard Forex, and the process of making the indicator is demonstrated in there video   https://www.youtube.com/watch?v=mEaiurw56wY&t=1425s . The basic idea behind this indicator is it draws a   tangent line   on the highest levels and lowest levels of the bars used for calculation, while ensuring that the lines don't intersect with the bars in review (alittle confusing? I know
FREE
Quarter EMA
Jithin Sajan Sajan
5 (2)
Kindly rate and comment about the product for upgradation & Support The 5 EMA is plotted in green color ( Lime ). The 14 EMA is plotted in red color ( Red ). The 20 EMA is plotted in blue color ( Blue ). The 200 EMA is plotted in yellow color ( Yellow ). The Quarter EMA that provided calculates and plots four Exponential Moving Averages (EMAs) on the chart using different periods: 5, 14, 20, and 200. Each EMA is represented by a different color on the chart. Here's a description of each EMA:
FREE
Quintet EMA
Jithin Sajan Sajan
Kindly rate and comment about the product for upgradation & Support The   5 EMA   is plotted in   green   color ( Lime ). The  14 EMA  is plotted in  red  color ( Red ). The   20 EMA   is plotted in   blue   color ( Blue ). The  200 EMA  is plotted in  black  color ( Black ). The   200 EMA   is plotted in   yellow   color ( Yellow ). The Quarter EMA that provided calculates and plots four Exponential Moving Averages (EMAs) on the chart using different periods: 5, 14, 20, and 200. Each EMA is
FREE
Alphabet AI MT5
Sergei Pomytkin
3.43 (7)
알파벳 AI는 평균 회귀 전략을 기반으로 하는 어드바이저입니다. 즉, 시장의 자연스러운 특성인 큰 변동 후 평균값으로 회귀하는 특성을 활용합니다. 이 알고리즘은 자산의 현재 가격을 지속적으로 분석하여 계산된 평균값과 비교합니다. 가격이 평균값에서 크게 벗어나면 어드바이저는 이를 행동 신호로 해석합니다. 상한선을 초과하면 가격 하락을 예상하여 숏 포지션을, 하한선 아래로 떨어지면 가격 상승을 예상하여 롱 포지션을 취합니다. 저희 어드바이저의 특징은 채널 경계를 파악하고 잘못된 신호를 걸러내는 적응형 접근 방식으로, 중간 정도의 추세에서도 효과적으로 작동한다는 것입니다. 특히 가격 채널 내에서 급격한 변동을 보이는 통화쌍에서 탁월한 성과를 보입니다. Advisor는 20년 넘게 데이터 테스트를 거쳤으며 그 기간 동안 가장 불안정한 기간도 견딜 수 있습니다. 컴퓨터를 연중무휴 24시간 실행할 수 없다면 VPS 서버 서비스를 이용하는 것이 좋습니다. 고문은 12개월 이상 낮은 손실률로 안
SMC Structure Markup
Seyed Mohammad Hosseini Hejazi
4.78 (9)
Overview The Smart Money Structure Markup Indicator for MetaTrader 5 is a powerful tool designed to help traders identify key market structures based on popular Smart Money Concepts (SMC) strategies. This indicator detects micro-market structures, providing insights into price movements and potential trend changes. It highlights important elements such as valid Break of Structure (BOS), Change of Character (CHoCH), and Inducement (IDM), helping traders to make informed decisions. Key Features Ma
FREE
Hydra Trend Rider is a non-repainting, multi-timeframe trend indicator that delivers precise buy/sell signals and real-time alerts for high-probability trade setups. With its color-coded trend line, customizable dashboard, and mobile notifications, it's perfect for traders seeking clarity, confidence, and consistency in trend trading. Download the Metatrader 4 Version Read the Indicator User Manual here. HURRY!   FLASH SALE is  ON . Price  increasing soon! Read the product description carefully
MT5용 신호 이동 평균 Lux 알고리즘 이동 평균 교차 시스템에서 신호선 사용을 위해 특별히 설계된 고유한 이동 평균 지표를 만나보세요. 이 고급 도구는 범위가 좁은 시장에서는 가격에서 벗어나는 반면, 추세가 있는 시장에서는 표준 이동 평균을 면밀히 반영한다는 점에서 차별화됩니다. 이러한 특징은 트레이더가 시장 변동으로 인한 불필요한 노이즈와 잠재적인 과매도를 방지하는 데 도움이 됩니다. 이동 평균은 범위가 좁은 시장에서는 가격에서 벗어나고, 추세가 있는 시장에서는 일반 이동 평균값에 도달합니다. 이동 평균 교차 전략은 일반적인 추세를 파악하는 데 사용되는 느린 이동 평균인 "신호선"에 의존하는 경우가 많습니다. 이 신호선은 빠른 이동 평균과 함께 사용되어 일반 가격과 신호선의 교차에서 발생할 수 있는 휩소 거래를 걸러냅니다. 제안된 지표는 범위가 좁은 기간 동안 가격에서 벗어나지 않으므로 가격과 신호선 사이에 발생하는 교차 횟수를 효과적으로 줄일 수 있습니다. 가격과
FREE
YenFlow
Kelly Philip Aketch
This is a machine learning trend following strategy based on the Ichimoku Kinko Hyo indicator combined with market volatility and volume metrics. It works best on the H1 Chart . The signals utilized to begin trading are carefully vetted via the machine learning capability, and a sophisticated algorithm ensures that the trader remains in the trend for as long as possible. Features. This is a fully automated multi-symbol expert advisor. It works on the following symbols USDJPY, AUDJPY, CHFJPY, EU
Gartley Harmonic Pattern Indicator for MetaTrader 5 The Gartley Harmonic Pattern Indicator is a harmonic analysis tool for MetaTrader 5, designed for traders aiming to identify market reversals through harmonic price formations. Using precise Fibonacci ratios and key pivot points, this indicator helps traders detect potential reversal zones and refine their trading strategies. Its customizable settings and adaptability make it suitable for both novice and experienced traders across various mark
FREE
Analyze potential   Covered Call   structures in the Brazilian market. Define where you want the break-even of your structure and see what structure to use. It works for any asset that has authorized series of options on B3 (Brazilian Stock Exchange). Associate the indicator to the asset you want to set up the Covered Call. *** ATENTION *** For the robot to work, the service that consults the authorized series of B3 options must be running on your terminal. Download the utility for free from t
FREE
스토캐스틱 멀티커런시 스캐너 대시보드 MT5 는 스토캐스틱 오실레이터를 사용하여 여러 통화 쌍과 시간 프레임을 모니터링하도록 설계된 강력한 도구입니다. 심볼과 시간 프레임(M1에서 MN1까지)을 기준으로 신호를 정리하는 그리드 형식으로 제공됩니다. 트레이더는 전략에 맞게 특정 시간 프레임을 활성화하거나 비활성화할 수 있습니다. MT4 버전은 여기에서 확인할 수 있습니다: Stochastic Oscillator Multicurrency Scanner MT4 자세한 문서는 여기에서 클릭하세요: 문서 이 도구는 다음 스토캐스틱 전략을 기반으로 신호를 표시합니다: 과매수/과매도 전략: 스토캐스틱이 과매수(상위 레벨 초과) 또는 과매도(하위 레벨 미만) 구역에 진입하거나 벗어날 때 신호가 생성되어 잠재적인 반전을 나타냅니다. 역레벨 전략: 스토캐스틱이 사용자 정의 또는 자동 계산된 상위 또는 하위 레벨을 역방향으로 교차할 때 신호가 트리거되어 모멘텀의 변화를 시사합니다. 크로스오버 전략: 스
이 제품의 구매자들이 또한 구매함
Divergence Bomber
Ihor Otkydach
4.98 (58)
이 지표를 구매하신 분께는 다음과 같은 혜택이 무료로 제공됩니다: 각 거래를 자동으로 관리하고, 손절/익절 수준을 설정하며, 전략 규칙에 따라 거래를 종료하는 전용 도우미 툴 "Bomber Utility" 다양한 자산에 맞게 지표를 설정할 수 있는 셋업 파일(Set Files) "최소 위험", "균형 잡힌 위험", "관망 전략" 모드로 설정 가능한 Bomber Utility의 셋업 파일 이 전략을 빠르게 설치, 설정, 시작할 수 있도록 돕는 단계별 영상 매뉴얼 주의: 위의 모든 보너스를 받기 위해서는 MQL5 개인 메시지 시스템을 통해 판매자에게 연락해 주세요. 독창적인 커스텀 지표인 “Divergence Bomber(다이버전스 봄버)”를 소개합니다. 이 지표는 MACD 다이버전스(괴리) 전략을 기반으로 한 올인원(All-in-One) 거래 시스템입니다. 이 기술 지표의 주요 목적은 가격과 MACD 지표 간의 다이버전스를 감지하고, **향후 가격이 어느 방향으로 움직일지를 알려주는
ARIPoint
Temirlan Kdyrkhan
ARIBot is a powerful trading companion designed to generate high-probability entry signals with dynamic TP/SL/DP levels based on volatility. Built-in performance tracking shows win/loss stats, PP1/PP2 hits, and success rates — all updated live. Key Features: Buy/Sell signals with adaptive volatility bands Real-time TP/SL/DP levels based on ATR Built-in MA Filter with optional ATR/StdDev volatility Performance stats panel (Success, Profit/Loss, PP1/PP2) Alerts via popup, sound, push, or email Cus
AriX
Temirlan Kdyrkhan
1 (1)
AriX Indicator for MT5 A powerful trend-following and signal-evaluation tool AriX is a custom MT5 indicator that combines Moving Averages and ATR-based risk/reward logic to generate clear buy/sell signals. It visualizes dynamic SL/TP levels, evaluates past trade outcomes, and displays win/loss statistics in a clean on-chart panel. Key features include: Buy/Sell signals based on MA crossovers ATR-based SL/TP1/TP2/TP3 levels with visual lines and labels Signal outcome tracking with real-time stat
Trend Screener Pro MT5
STE S.S.COMPANY
4.87 (90)
트렌드 표시기, 트렌드 트레이딩 및 필터링을 위한 획기적인 고유 솔루션, 하나의 도구 안에 내장된 모든 중요한 트렌드 기능! Forex, 상품, 암호 화폐, 지수 및 주식과 같은 모든 기호/도구에 사용할 수 있는 100% 다시 칠하지 않는 다중 시간 프레임 및 다중 통화 표시기입니다. Trend Screener는 차트에 점이 있는 화살표 추세 신호를 제공하는 효율적인 지표 추세 추종 지표입니다. 추세 분석기 표시기에서 사용할 수 있는 기능: 1. 트렌드 스캐너. 2. 최대 이익 분석이 있는 추세선. 3. 추세 통화 강도 측정기. 4. 경고가 있는 추세 반전 점. 5. 경고가 있는 강력한 추세 점. 6. 추세 화살표 Trend Screener Indicator가 있는 일일 분석 예, 일일 신호 성능...등은 여기에서 찾을 수 있습니다. 여기를 클릭하십시오. LIMITED TIME OFFER : Trend Screener Indicator는 50$ 및 평생 동안만 사용할 수 있습니다.
Trend indicator AI mt5
Ramil Minniakhmetov
5 (8)
트렌드 인공 지능 지표는 실행 가능한 진입 점 및 반전 경고와 추세 식별을 결합하여 상인의 시장 분석을 향상시킬 훌륭한 도구입니다. 이 표시기는 사용자가 자신감과 정밀도로 외환 시장의 복잡성을 탐색 할 수 있도록 지원합니다 기본 신호 외에도 트렌드 인공 지능 지표는 풀백 또는 되돌림 중에 발생하는 2 차 진입 점을 식별하여 거래자가 기존 트렌드 내에서 가격 수정을 활용할 수 있도록합니다. 중요한 장점: ·작동 4 및 5 *명확한 구매 또는 판매 신호 *다시 칠하지 않습니다 *모든 자산에서 작동 나는 전보 사기에 개 또는 세트를 판매하지 않도록주의. 모든 설정은 블로그에 여기에 무료.  중요! 지침 및 보너스를 얻기 위해 구입 후 즉시 저에게 연락! 진짜 가동 감시는 뿐 아니라 나의 다른 제품 여기에서 찾아낼 수 있습니다: https://www.mql5.com/en/users/mechanic/seller&nbsp ; 설정 및 입력: 모든 자산에 대해 기본 설정을 권
Gold Stuff mt5
Vasiliy Strukov
4.92 (189)
Gold Stuff mt5는 금을 위해 특별히 설계된 추세 지표이며 모든 금융 상품에서도 사용할 수 있습니다. 표시기가 다시 그려지지 않고 지연되지 않습니다. 권장 기간 H1. 설정 및 개인 보너스를 받으려면 구매 후 즉시 저에게 연락하십시오!     강력한 지원 및 트렌드 스캐너 표시기의 무료 사본을 받으실 수 있습니다. 메시지를 보내주세요. 나!   설정 화살표 그리기 - 켜기 끄기. 차트에 화살표 그리기. 경고 - 가청 경고를 끕니다. 이메일 알림 - 켜기 끄기. 이메일 알림. Puch-notification - 켜기 끄기. 푸시 알림. 다음으로 색 영역을 조정합니다. Gold Stuff mt5는 금을 위해 특별히 설계된 추세 지표이며 모든 금융 상품에서도 사용할 수 있습니다. 표시기가 다시 그려지지 않고 지연되지 않습니다. 권장 기간 H1. 설정 및 개인 보너스를 받으려면 구매 후 즉시 저에게 연락하십시오!   설정 화살표 그리기 - 켜기 끄기. 차트에 화살표 그
Entry In The Zone and SMC Multi Timeframe는 Smart Money Concepts(SMC) 프레임워크를 기반으로 개발된 실시간 시장 분석 도구입니다. 이 도구는 여러 시간 프레임에 걸쳐 반전 지점과 주요 존(Key Zones)을 자동으로 분석하며, 리페인트 없는 신호와 관심 지점(POI)을 강조하는 데 중점을 둡니다. 또한 자동 피보나치 레벨(Auto Fibonacci Level) 시스템이 포함되어 있어, 피보나치 라인을 자동으로 그려 되돌림 및 반전 지점을 파악하는 데 도움을 줍니다. 이 도구는 트레이더가 더 높은 자신감과 체계적인 접근으로 거래 계획을 세우고 결정을 내릴 수 있도록 하여, Smart Money Concepts를 기반으로 한 진입 효율성을 높여줍니다. 인디케이터 + 신호 시스템(2-in-1) 패키지로 구성되어 있으며, 지능형 존 분석과 실시간 거래 진입 신호를 하나의 도구에 통합하였습니다. 직접 거래에 사용하든 개인 분석 도구로 활용
Grabber System MT5
Ihor Otkydach
5 (15)
탁월한 기술적 지표인 Grabber를 소개합니다. 이 도구는 즉시 사용 가능한 “올인원(All-Inclusive)” 트레이딩 전략으로 작동합니다. 하나의 코드 안에 강력한 시장 기술 분석 도구, 매매 신호(화살표), 알림 기능, 푸시 알림이 통합되어 있습니다. 이 인디케이터를 구매하신 모든 분들께는 다음의 항목이 무료로 제공됩니다: Grabber 유틸리티: 오픈 포지션을 자동으로 관리하는 도구 단계별 영상 매뉴얼: 설치, 설정, 그리고 실제 거래 방법을 안내 맞춤형 세트 파일: 인디케이터를 빠르게 자동 설정하여 최고의 성과를 낼 수 있도록 도와줍니다 다른 전략은 이제 잊어버리세요! Grabber만이 여러분을 새로운 트레이딩의 정점으로 이끌어 줄 수 있습니다. Grabber 전략의 주요 특징: 거래 시간 프레임: M5부터 H4까지 거래 가능한 자산: 어떤 자산이든 사용 가능하지만, 제가 직접 테스트한 종목들을 추천드립니다 (GBPUSD, GBPCAD, GBPCHF, AUDCAD, AU
FX Volume MT5
Daniel Stein
4.84 (19)
FX Volume: 브로커 시각에서 바라보는 진짜 시장 심리 간단 요약 트레이딩 접근 방식을 한층 더 향상시키고 싶으신가요? FX Volume 는 소매 트레이더와 브로커의 포지션을 실시간으로 파악할 수 있게 해 줍니다. 이는 COT 같은 지연된 보고서보다 훨씬 빠릅니다. 꾸준한 수익을 추구하는 분이든, 시장에서 더 깊은 우위를 원하시는 분이든, FX Volume 을 통해 대규모 불균형을 찾아내고, 돌파 여부를 확인하며 리스크 관리를 정교화할 수 있습니다. 지금 시작해 보세요! 실제 거래량 데이터가 의사결정을 어떻게 혁신할 수 있는지 직접 경험해 보시기 바랍니다. 1. 트레이더에게 FX Volume이 매우 유익한 이유 탁월한 정확도를 지닌 조기 경보 신호 • 다른 사람들보다 훨씬 앞서, 각 통화쌍을 매수·매도하는 트레이더 수를 거의 실시간으로 파악할 수 있습니다. • FX Volume 은 여러 리테일 브로커에서 추출한 실제 거래량 데이터를 종합해 명확하고 편리한 형태로 제공하는
소개       Quantum Breakout PRO   , 브레이크아웃 존 거래 방식을 변화시키는 획기적인 MQL5 지표! 13년 이상의 거래 경험을 가진 숙련된 트레이더 팀이 개발한       퀀텀 브레이크아웃 PRO       혁신적이고 역동적인 브레이크아웃 존 전략으로 거래 여정을 새로운 차원으로 끌어올리도록 설계되었습니다. Quantum Breakout Indicator는 5개의 이익 목표 영역이 있는 브레이크아웃 영역의 신호 화살표와 브레이크아웃 상자를 기반으로 한 손절 제안을 제공합니다. 초보자 거래자와 전문 거래자 모두에게 적합합니다. Quantum EA 채널:       여기를 클릭하세요 중요한! 구매 후 설치 매뉴얼을 받으려면 개인 메시지를 보내주십시오. 추천: 기간: M15 통화쌍: GBPJPY, EURJPY, USDJPY,NZDUSD, XAUUSD 계정 유형: 스프레드가 매우 낮은 ECN, Raw 또는 Razor 브로커 시간: GMT +3 중개인 :
Atbot
Zaha Feiz
4.66 (50)
AtBot: 작동 방식 및 사용 방법 ### 작동 방식 MT5 플랫폼용 "AtBot" 지표는 기술 분석 도구의 조합을 사용하여 매수 및 매도 신호를 생성합니다. 01:37 단순 이동 평균(SMA), 지수 이동 평균(EMA), 평균 진폭 범위(ATR) 지수를 통합하여 거래 기회를 식별합니다. 또한 Heikin Ashi 캔들을 사용하여 신호의 정확성을 향상시킬 수 있습니다. 구매 후 리뷰를 남기면 특별 보너스 선물을 받게 됩니다. ### 주요 기능: - 비재표시: 신호는 플로팅 후 변경되지 않습니다. - 비재작성: 신호는 일관되며 변경되지 않습니다. - 지연 없음: 지연 없이 시기적절한 신호를 제공합니다. - 다양한 시간대: 거래 전략에 맞게 모든 시간대에서 사용할 수 있습니다. ### 운영 단계: #### 입력 및 설정: - firstkey (TrendValue): 추세 감지의 민감도를 조정합니다. - Secondkey (SignalValue): 매수/매도 신호 생성의 민감도를 정의
Berma Bands
Muhammad Elbermawi
5 (6)
Berma Bands(BBs) 지표는 시장 동향을 파악하고 이를 활용하려는 트레이더에게 귀중한 도구입니다. 가격과 BBs 간의 관계를 분석함으로써 트레이더는 시장이 추세 단계인지 범위 단계인지를 분별할 수 있습니다. 자세한 내용을 알아보려면 [ Berma Home Blog ]를 방문하세요. 버마 밴드는 세 개의 뚜렷한 선으로 구성되어 있습니다. 어퍼 버마 밴드, 미들 버마 밴드, 로어 버마 밴드입니다. 이 선들은 가격 주위에 그려져 전체 추세에 대한 가격 움직임을 시각적으로 표현합니다. 이 밴드들 사이의 거리는 변동성과 잠재적인 추세 반전에 대한 통찰력을 제공할 수 있습니다. 버마 밴드 라인이 각각에서 분리될 때, 그것은 종종 시장이 횡보 또는 범위 이동 기간에 접어들고 있음을 시사합니다. 이는 명확한 방향 편향이 없음을 나타냅니다. 트레이더는 이러한 기간 동안 추세를 파악하기 어려울 수 있으며 더 명확한 추세가 나타날 때까지 기다릴 수 있습니다. 버마 밴드 라인이 단일 라인으로
Trade smarter, not harder: Empower your trading with Harmonacci Patterns This is arguably the most complete harmonic price formation auto-recognition indicator you can find for the MetaTrader Platform. It detects 19 different patterns, takes fibonacci projections as seriously as you do, displays the Potential Reversal Zone (PRZ) and finds suitable stop-loss and take-profit levels. [ Installation Guide | Update Guide | Troubleshooting | FAQ | All Products ] It detects 19 different harmonic pri
FX Levels MT5
Daniel Stein
5 (7)
FX Levels: 모든 시장을 위한 뛰어난 정확도의 지지와 저항 간단 요약 통화쌍, 지수, 주식, 원자재 등 어떤 시장이든 믿을 만한 지지·저항 레벨을 찾고 싶나요? FX Levels 는 전통적인 “Lighthouse” 기법과 첨단 동적 접근을 결합해, 거의 보편적인 정확성을 제공합니다. 실제 브로커 경험을 반영하고, 자동화된 일별 업데이트와 실시간 업데이트를 결합함으로써 FX Levels 는 가격 반전 포인트를 파악하고, 수익 목표를 설정하며, 자신 있게 트레이드를 관리할 수 있게 돕습니다. 지금 바로 시도해 보세요—정교한 지지/저항 분석이 어떻게 여러분의 트레이딩을 한 단계 끌어올릴 수 있는지 직접 확인하세요! 1. FX Levels가 트레이더에게 매우 유용한 이유 뛰어난 정확도의 지지·저항 존 • FX Levels 는 다양한 브로커 환경에서도 거의 동일한 존을 생성하도록 설계되어, 데이터 피드나 시간 설정 차이로 인한 불일치를 해소합니다. • 즉, 어떤 브로커를 사용하
FX Power MT5 NG
Daniel Stein
5 (17)
FX Power: 통화 강세 분석으로 더 스마트한 거래 결정을 개요 FX Power 는 어떤 시장 상황에서도 주요 통화와 금의 실제 강세를 이해하기 위한 필수 도구입니다. 강한 통화를 매수하고 약한 통화를 매도함으로써 FX Power 는 거래 결정을 단순화하고 높은 확률의 기회를 발견합니다. 트렌드를 따르거나 극단적인 델타 값을 사용해 반전을 예측하고자 한다면, 이 도구는 귀하의 거래 스타일에 완벽히 적응합니다. 단순히 거래하지 말고, FX Power 로 더 스마트하게 거래하세요. 1. FX Power가 거래자에게 매우 유용한 이유 통화와 금의 실시간 강세 분석 • FX Power 는 주요 통화와 금의 상대적 강세를 계산하고 표시하여 시장 역학에 대한 명확한 통찰력을 제공합니다. • 어떤 자산이 앞서고 있고 어떤 자산이 뒤처지는지 모니터링하여 보다 현명한 거래 결정을 내릴 수 있습니다. 포괄적인 멀티 타임프레임 뷰 • 단기, 중기 및 장기 타임프레임에서 통화와 금의 강세를
Entry Points Pro for MT5
Yury Orlov
4.46 (133)
다시 색을 칠하지 않고 거래에 진입할 수 있는 정확한 신호를 제공하는 MT5용 지표입니다. 외환, 암호화폐, 금속, 주식, 지수 등 모든 금융 자산에 적용할 수 있습니다. 매우 정확한 추정값을 제공하고 매수와 매도의 가장 좋은 시점을 알려줍니다. 하나의 시그널로 수익을 내는 지표의 예와 함께 비디오 (6:22)시청하십시오! 대부분의 거래자는 Entry Points Pro 지표의 도움으로 첫 거래 주 동안 트레이딩 결과를 개선합니다. 저희의   Telegram Group 을 구독하세요! Entry Points Pro 지표의 좋은점. 재도색이 없는 진입 신호 신호가 나타나고 확인되면(시그널 캔들이 완성된 경우) 신호는 더 이상 사라지지 않습니다. 여타 보조지표의 경우 신호를 표시한 다음 제거되기 때문에 큰 재정적 손실로 이어집니다. 오류 없는 거래 게시 알고리즘을 통해 트레이드(진입 또는 청산)를 할 이상적인 순간을 찾을 수 있으며, 이를 통해 이를 사용하는 모든 거래자의 성공률이
SupportResistancePeaks Indicator indicator - is the combination of dynamic support/resitance and price action pattern. As a rule support/resistance indicators uses already calculated, history levels. The most disadvantage of this method - new(incomming) levels always are not the same as were on history, in other words accuracy is not so high as expected. My indicator is looking for dynamic/live levels that are forming right now after trend lost it's power and choppy market starts. As a rule exac
Support And Resistance Screener는 하나의 지표 안에 여러 도구를 제공하는 MetaTrader에 대한 하나의 레벨 지표입니다. 사용 가능한 도구는 다음과 같습니다. 1. 시장 구조 스크리너. 2. 완고한 후퇴 영역. 3. 약세 후퇴 영역. 4. 일일 피벗 포인트 5. 주간 피벗 포인트 6. 월간 피벗 포인트 7. 고조파 패턴과 볼륨에 기반한 강력한 지지와 저항. 8. 은행 수준 구역. LIMITED TIME OFFER : HV 지원 및 저항 표시기는 50 $ 및 평생 동안만 사용할 수 있습니다. ( 원래 가격 125$ ) MQL5 블로그에 액세스하면 분석 예제와 함께 모든 프리미엄 지표를 찾을 수 있습니다. 여기를 클릭하십시오. 주요 특징들 고조파 및 볼륨 알고리즘을 기반으로 하는 강력한 지원 및 저항 영역. Harmonic 및 Volume 알고리즘을 기반으로 한 강세 및 약세 풀백 영역. 시장 구조 스크리너 일간, 주간 및 월간 피벗 포인트. 실제 거래의
RelicusRoad Pro MT5
Relicus LLC
5 (21)
훌륭한 백테스트, 환상적인 숫자로 입증된 실제 계정 성능, 그리고 모든 곳에 퍼져 있는 통계를 자랑하는 트레이딩 지표를 얼마나 자주 구매하셨습니까? 하지만 사용 후에는 결국 계좌를 날려버리셨나요? 신호 자체만으로는 신뢰할 수 없습니다. 신호가 왜 처음 나타났는지 알아야 하며, 그것이 바로 RelicusRoad Pro가 가장 잘하는 일입니다! 사용자 매뉴얼 + 전략 + 교육 비디오 + VIP 액세스 전용 그룹 + 모바일 버전 사용 가능 시장을 보는 새로운 방법 RelicusRoad는 외환, 선물, 암호화폐, 주식 및 지수를 위한 세계에서 가장 강력하고 최고의 트레이딩 지표 로서, 트레이더가 계좌를 성장시키는 데 필요한 모든 정보와 도구를 제공합니다. 우리는 기술 분석 및 트레이딩 계획 을 제공하여 초보자 부터 고급 트레이더 까지 모든 트레이더가 성공할 수 있도록 돕습니다. 이것은 미래 시장을 예측 하는 데 충분한 정보를 제공하는 핵심 트레이딩 지표 입니다. 우리는 차트에서 의미 없
Algo Pumping
Ihor Otkydach
4.74 (19)
PUMPING STATION – 당신만을 위한 올인원(All-in-One) 전략 PUMPING STATION은 당신의 외환 거래를 더욱 흥미롭고 효과적으로 바꿔줄 혁신적인 인디케이터입니다. 단순한 보조 도구가 아니라, 강력한 알고리즘을 갖춘 완전한 거래 시스템으로서 보다 안정적인 트레이딩을 시작할 수 있도록 도와줍니다. 이 제품을 구매하시면 다음의 혜택을 무료로 받으실 수 있습니다: 전용 설정 파일: 자동 설정으로 최대의 퍼포먼스를 제공합니다. 단계별 동영상 가이드: PUMPING STATION 전략으로 거래하는 법을 배워보세요. Pumping Utility: PUMPING STATION과 함께 사용하도록 설계된 반자동 거래 봇으로, 거래를 더욱 쉽고 편리하게 만들어줍니다. ※ 구매 후 바로 저에게 메시지를 보내주세요. 추가 자료에 대한 접근 권한을 제공해드립니다. PUMPING STATION은 어떻게 작동하나요? 트렌드 컨트롤: 시장의 추세 방향을 즉시 파악합니다. 추세는 최고의
Nirvana trend
Aiireza Arjmandi Nezhad
프롭 챌린지 통과를 꿈꾸시나요? 이제 꿈이 이루어졌습니다! FTMO, MyForexFunds 등 프롭 펌(Prop Firms)의 챌린지에 참여하는 것은 큰 자금을 확보할 수 있는 절호의 기회입니다. 하지만 이러한 챌린지에는 일일 손실액(Daily Drawdown)과 최대 손실액(Max Drawdown)이라는 엄격한 규칙이 있습니다. 작은 실수, 감정적인 거래, 또는 잘못된 분석 하나가 당신의 모든 노력을 순식간에 망칠 수 있습니다. 바로 이럴 때 Nirvana Trend 지표가 전문 코치이자 보호막처럼 당신을 지켜줍니다! Nirvana Trend는 어떻게 당신을 성공적인 프롭 트레이더로 만들어 줄까요? 이 지표는 프롭 챌린지에서 가장 큰 적, 감정과 자제력 부족을 극복하도록 특별히 설계되었습니다! 1. 감정적이고 과도한 거래와 작별하세요: 프롭 챌린지는 극심한 심리적 스트레스를 유발합니다. 자본 손실에 대한 두려움이나 수익 목표 달성에 대한 욕심 때문에 성급하고 전략에 어긋나
Trend Forecaster
Alexey Minkov
5 (7)
The Trend Forecaster indicator utilizes a unique proprietary algorithm to determine entry points for a breakout trading strategy. The indicator identifies price clusters, analyzes price movement near levels, and provides a signal when the price breaks through a level. The Trend Forecaster indicator is suitable for all financial assets, including currencies (Forex), metals, stocks, indices, and cryptocurrencies. You can also adjust the indicator to work on any time frames, although it is recommen
PZ Swing Trading MT5
PZ TRADING SLU
5 (5)
Protect against whipsaws: revolutionize your swing trading approach Swing Trading is the first indicator designed to detect swings in the direction of the trend and possible reversal swings. It uses the baseline swing trading approach, widely described in trading literature. The indicator studies several price and time vectors to track the aggregate trend direction and detects situations in which the market is oversold or overbought and ready to correct. [ Installation Guide | Update Guide | Tro
PZ Trend Trading MT5
PZ TRADING SLU
3.8 (5)
Capture every opportunity: your go-to indicator for profitable trend trading Trend Trading is an indicator designed to profit as much as possible from trends taking place in the market, by timing pullbacks and breakouts. It finds trading opportunities by analyzing what the price is doing during established trends. [ Installation Guide | Update Guide | Troubleshooting | FAQ | All Products ] Trade financial markets with confidence and efficiency Profit from established trends without getting whip
Atomic Analyst MT5
Issam Kassas
4.14 (21)
우선적으로 언급할 점은이 거래 지표가 다시 그리지 않고 지연되지 않으며 이를 통해 수동 및 로봇 거래 모두에 이상적이라는 점입니다. 사용자 매뉴얼: 설정, 입력 및 전략. Atomic Analyst는 가격의 강도와 모멘텀을 활용하여 시장에서 더 나은 이점을 찾는 PA Price Action Indicator입니다. 고급 필터를 장착하여 잡음과 거짓 신호를 제거하고 거래 잠재력을 높이는 데 도움이 됩니다. 복잡한 지표의 다중 레이어를 사용하여 Atomic Analyst는 차트를 스캔하고 복잡한 수학적 계산을 간단한 신호와 색상으로 변환하여 초보 트레이더가 이해하고 일관된 거래 결정을 내릴 수 있도록합니다. "Atomic Analyst"는 새로운 및 경험이 풍부한 트레이더를위한 종합적인 거래 솔루션입니다. 프리미엄 지표와 최고 수준의 기능을 하나의 거래 전략에 결합하여 모든 종류의 트레이더에 대한 다재다능한 선택지가되었습니다. 인트라데이 거래 및 스캘핑 전략 : 빠르고 정확한 일일
ACB Breakout Arrows MT5
KEENBASE SOFTWARE SOLUTIONS
5 (1)
ACB Breakout Arrows 지표는 특별한 돌파 패턴을 감지하여 시장에서 중요한 진입 신호를 제공합니다. 이 지표는 차트를 지속적으로 스캔하면서 한 방향으로 움직임이 자리 잡을 때를 포착하여 큰 움직임 직전에 정확한 진입 신호를 제공합니다. 다중 종목 및 다중 시간대 스캐너는 여기에서 확인하세요 - ACB Breakout Arrows MT5용 스캐너 핵심 기능 지표가 자동으로 손절(Stop Loss) 및 익절(Take Profit) 수준을 제공합니다. 모든 시간대의 돌파 신호를 추적하는 MTF 스캐너 대시보드 포함. 데이 트레이더, 스윙 트레이더 및 스캘퍼에게 적합합니다. 신호 정확도를 높이기 위해 최적화된 알고리즘 사용. 손익분기점 또는 빠른 수익 목표를 위한 특별한 라인 (Quick Profit Line) 제공. 승률, 성공 비율, 평균 수익 등의 성과 분석 지표 제공. 재도색 없음. 신호는 고정되어 신뢰할 수 있습니다. 거래 확인 - ACB Trade Filter 지
Matrix Arrow Indicator MT5
Juvenille Emperor Limited
5 (16)
매트릭스 화살표 표시기 MT5 는 외환, 상품, 암호 화폐, 지수, 주식과 같은 모든 기호/도구에 사용할 수 있는 100% 다시 칠하지 않는 다중 기간 표시기를 따르는 고유한 10 in 1 추세입니다.  Matrix Arrow Indicator MT5 는 다음과 같은 최대 10개의 표준 지표에서 정보와 데이터를 수집하여 초기 단계에서 현재 추세를 결정합니다. 평균 방향 이동 지수(ADX) 상품 채널 지수(CCI) 클래식 하이켄 아시 캔들 이동 평균 이동 평균 수렴 발산(MACD) 상대 활력 지수(RVI) 상대 강도 지수(RSI) 포물선 SAR 스토캐스틱 오실레이터 윌리엄스의 백분율 범위 모든 지표가 유효한 매수 또는 매도 신호를 제공하면 강력한 상승/하락 추세를 나타내는 다음 캔들/막대가 시작될 때 해당 화살표가 차트에 인쇄됩니다. 사용자는 사용할 표시기를 선택하고 각 표시기의 매개변수를 개별적으로 조정할 수 있습니다. 매트릭스 화살표 표시기 MT5는 선택한 표시기에서만 정보를 수
AT Forex Indicator MT5
MQL TOOLS SL
5 (5)
The AT Forex Indicator MT5 is a sophisticated trading tool designed to provide traders with a comprehensive analysis of multiple currency pairs. This powerful indicator simplifies the complex nature of the forex market, making it accessible for both novice and experienced traders. AT Forex Indicator uses advanced algorithms to detect trends, patterns and is an essential tool for traders aiming to enhance their forex trading performance. With its robust features, ease of use, and reliable signal
Dark Absolute Trend MT5
Marco Solito
4.64 (11)
Dark Absolute Trend   is an Indicator for intraday trading. This Indicator is based on   Trend Following  strategy but use also candlestick patterns and Volatility. We can enter in good price with this Indicator, in order to follow the main trend on the current instrument. It is advised to use low spread ECN brokers. This Indicator does   Not repaint   and   N ot lag . Recommended timeframes are M5, M15 and H1. Recommended working pairs: All. I nstallation and  Update Guide   -  Troubleshooting
Easy Breakout MT5
Mohamed Hassan
4.6 (5)
Summer Sale: 50% OFF!!! Promotion is valid until 08 August 2025!  After your purchase, feel free to contact me for more details on how to receive a bonus indicator called VFI, which pairs perfectly with Easy Breakout for enhanced confluence!     Easy Breakout MT5   is a powerful price action trading system built on one of the most popular and widely trusted strategies among traders: the   Breakout strategy ! This indicator delivers crystal-clear Buy and Sell signals based on breakouts from k
제작자의 제품 더 보기
Matrix Multi Light
Mattia Nardi
5 (1)
Matrix Multi Light Plus - Professional Multi-Strategy Scalping EA Product Overview Matrix Multi Light Plus is an advanced Expert Advisor designed specifically for Gold (XAU/USD) trading that combines four distinct trading strategies operating simultaneously with independent management systems. This professional-grade scalping system leverages sophisticated technical analysis and advanced risk management to maximize trading opportunities while maintaining strict control over risk exposure. Key Fe
필터:
리뷰 없음
리뷰 답변