Fractal Pivot Lines
- 지표
- 버전: 1.0
- 활성화: 5

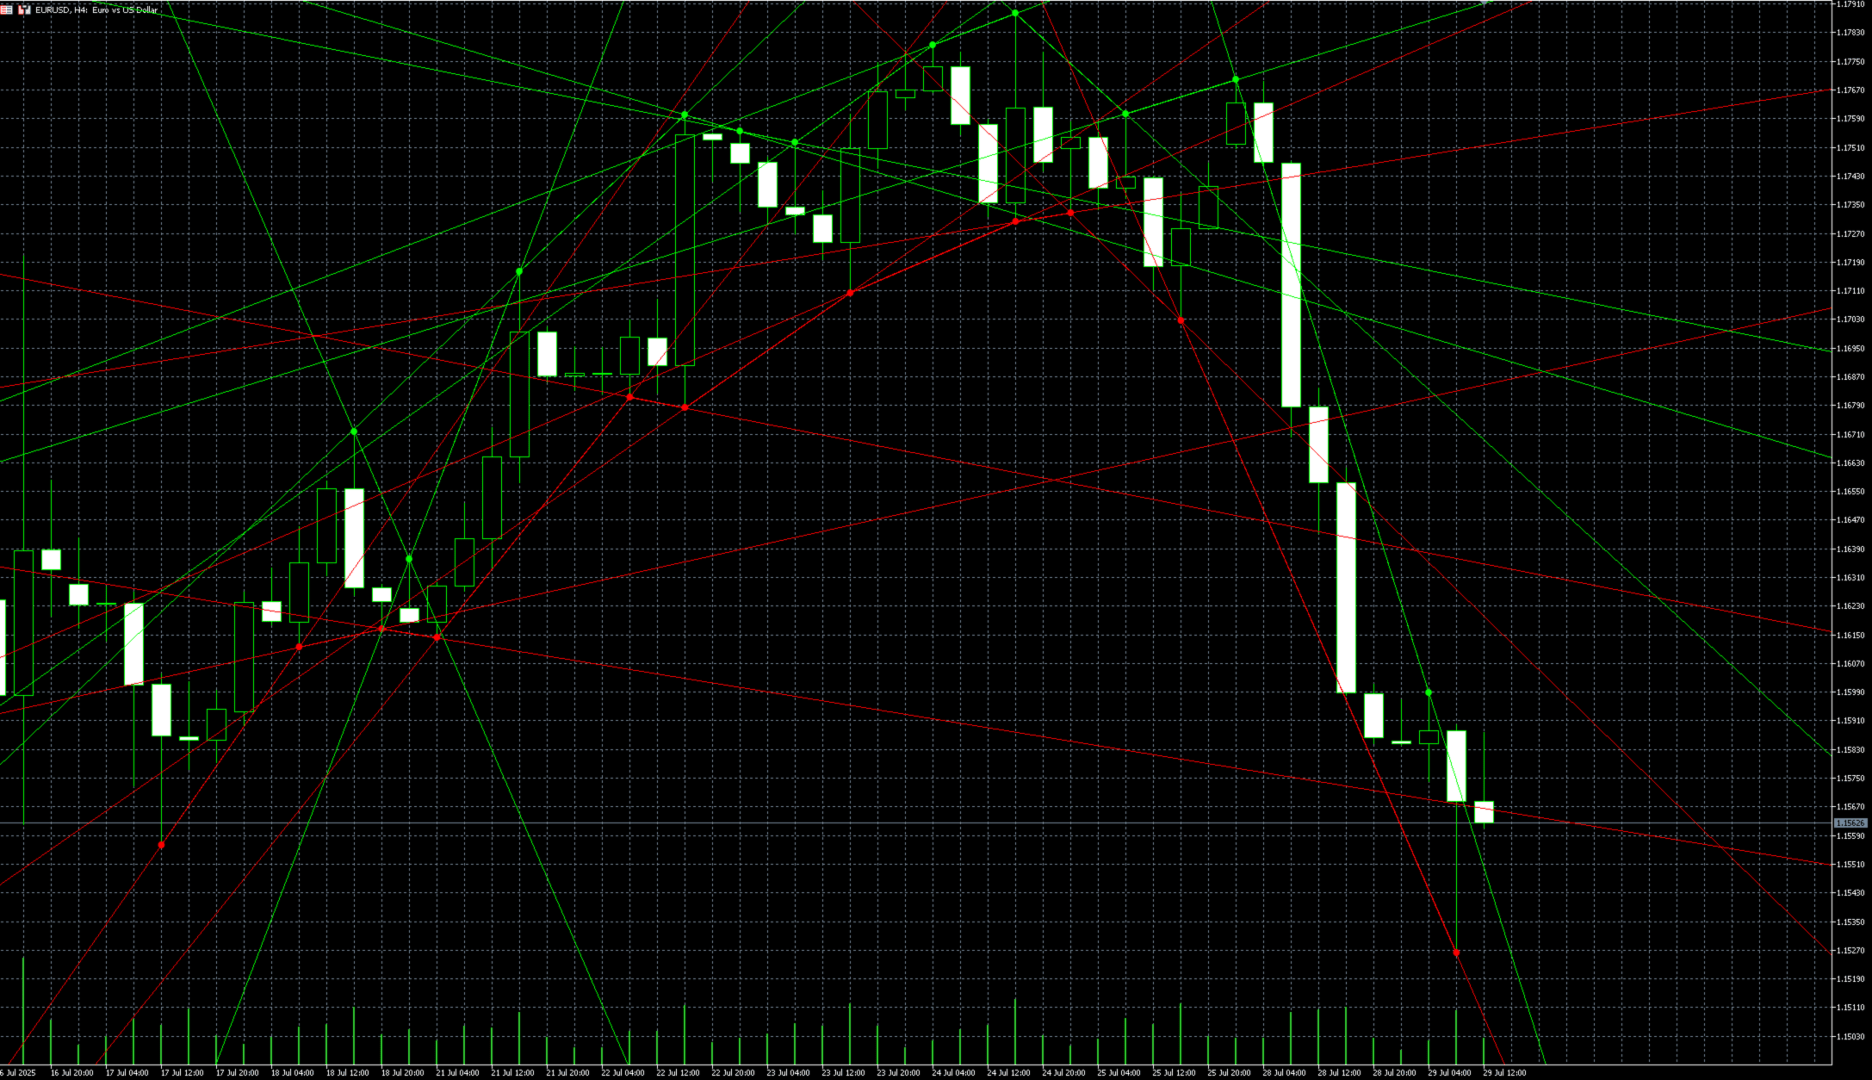
Fractal Pivot Lines — Indicator Overview
Fractal Pivot Lines is a custom trend-structure indicator for MetaTrader 5.
It automatically connects key fractal highs and lows with dynamic lines so you can see how price is respecting local structure, building channels, and preparing for potential reversals.
Instead of staring at dozens of candles and guessing where the real pivots are, the indicator turns fractals into clear support/resistance paths and trend channels.
What the Indicator Does
-
🔹 Connects fractal highs (pivot ups)
-
Recent fractal highs are linked with green lines.
-
These lines often act as dynamic resistance paths and show how sellers are stepping in.
-
-
🔹 Connects fractal lows (pivot downs)
-
Recent fractal lows are linked with red lines.
-
These lines highlight dynamic support paths and show where buyers are defending price.
-
You can choose how the lines are built:
-
Basic mode (point-to-previous)
-
Each new fractal connects only to the previous one of the same type.
-
Result: clean, simple trend paths without clutter.
-
-
Extended mode (all combinations)
-
Each fractal can connect to multiple previous fractals.
-
Result: a richer network of lines that helps reveal:
-
Wedges
-
Trend channels
-
Converging zones and breakout structures
-
-
Key Inputs
-
FractalDepth
Controls how many candles on each side are checked to confirm a fractal.
Smaller values = more signals, more lines.
Larger values = fewer but stronger pivots. -
Number of Fractals
Limits how many recent fractals are used for drawing lines.
Helps you control chart clutter and focus on the most relevant structure. -
Extend Lines Backward
When enabled, lines are drawn backwards from the last fractal, giving you a historical view of how price has reacted to the same pivot line in the past. -
Extend Lines Forward
When enabled, lines are extended forward beyond the last fractal, projecting possible future support/resistance paths and potential reaction zones.
How Traders Use It
1. Trend Visualization
Watch how price respects or breaks fractal-based lines:
-
Multiple bounces on a red line → strong support.
-
Repeated rejections from a green line → strong resistance.
-
Break and retest of a line → potential trend continuation or reversal area.
2. Fractal Projection & Channels
By extending lines forward, the indicator helps you:
-
See where future price might collide with past fractal structure.
-
Detect converging zones where support and resistance meet (ideal for breakouts).
-
Outline trend channels and wedge patterns built purely from fractal pivots.
3. Trade Planning & Confluence
Use Fractal Pivot Lines together with:
-
Classic support/resistance
-
Trendlines
-
Oscillators or volume tools
to build high-confluence trade zones instead of random entries in the middle of nowhere.
In Short
Fractal Pivot Lines for MT5 converts raw fractals into a clear map of trend paths, channels, and projection levels.
If you like trading from structure — not from guesswork — this tool gives you a visual edge in reading how price respects its own pivot history.