True Volume
- 지표
- 버전: 2.3
- 업데이트됨: 10 1월 2026
- 활성화: 5

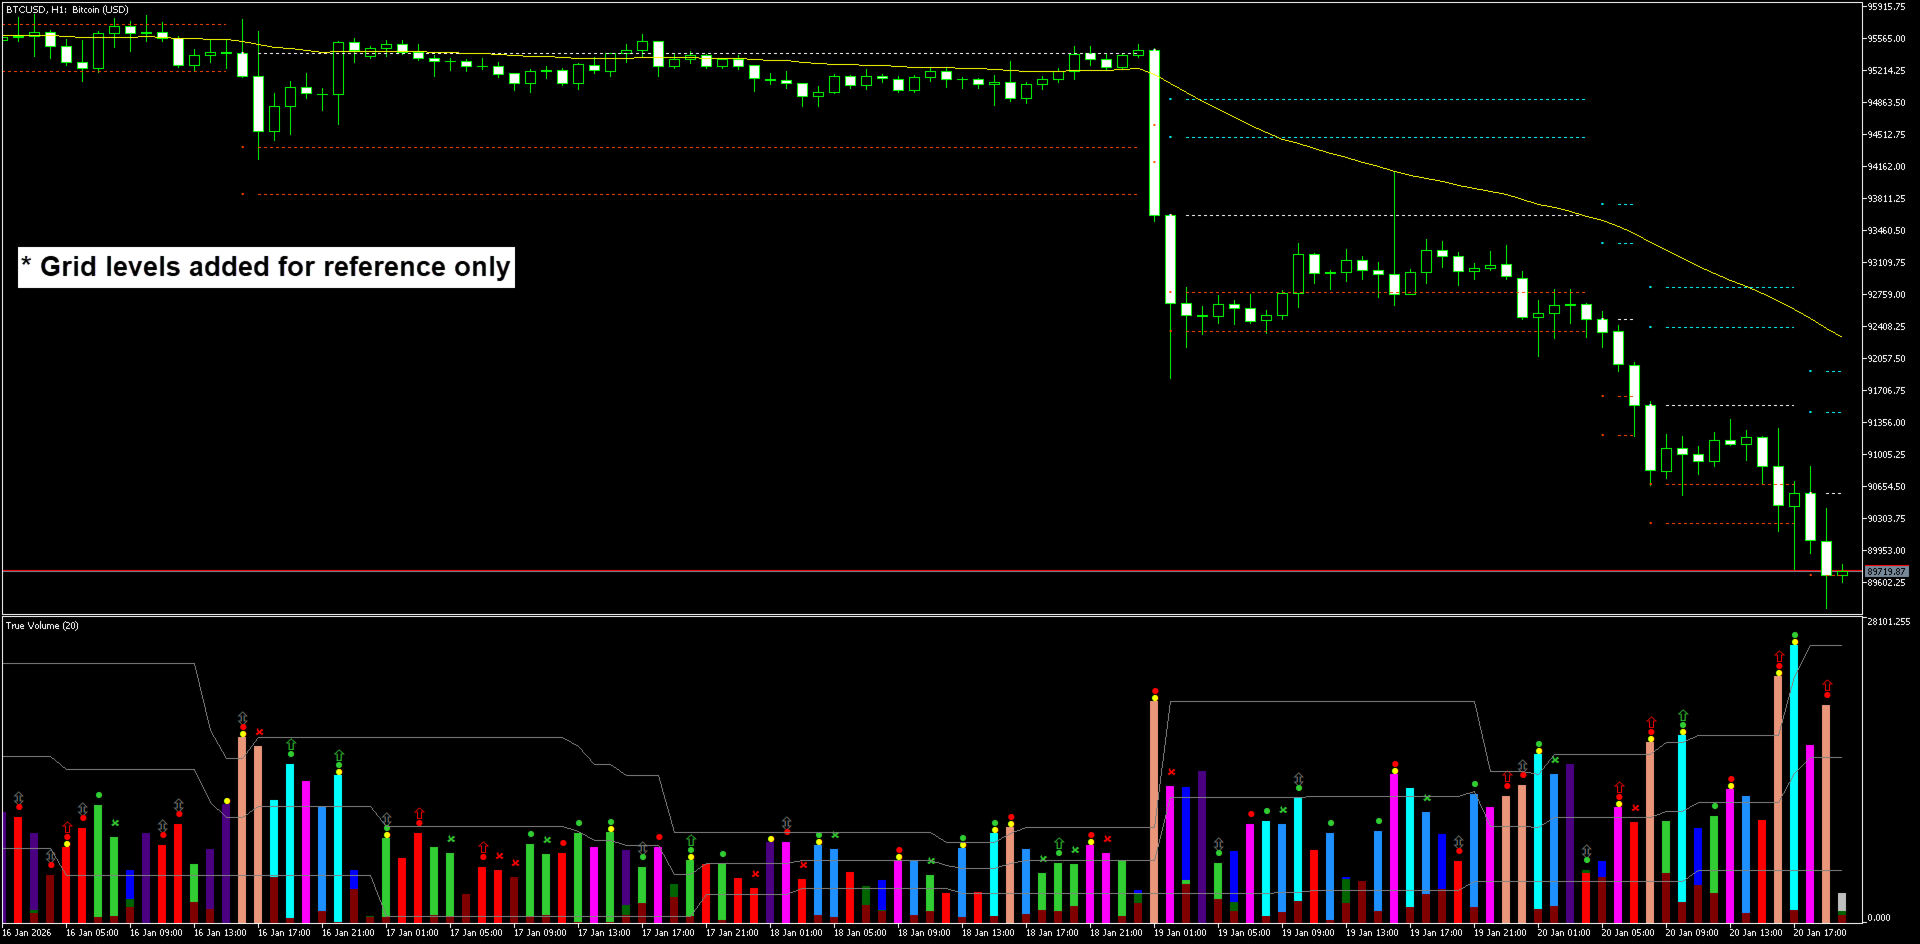
True Volume: See the Story Behind the Price
True Volume is not just another histogram; it is a forensic analysis engine for price action. While standard volume indicators only tell you how much was traded, True Volume tells you who traded it and who won.
By combining Geometric Decomposition, VSA (Volume Spread Analysis), and Anomaly Detection, this indicator dissects every bar to reveal the hidden battle between Bulls, Bears, and the "Churn" (Indecision).
The Core Engine:
Unlike standard indicators that rely on simple Close vs. Open math, True Volume uses a Consensus Engine that evaluates:
-
Displacement: Who actually moved the price?
-
Pressure: Who defended the highs and lows?
-
Efficiency: Is the volume validating the move, or is it a "Squat" (Fakeout)?
-
Anomalies: Detecting hidden "Iceberg" orders and absorption.
Key Features:
-
3-Way Volume Split: See Bullish (Green), Bearish (Red), and Neutral (Blue) volume separately.
-
Sniper Signals: 10 distinct arrow types to identify Breakouts, Reversals, and Exhaustion.
-
Churn Detection: Identifies "Trap" candles where volume is high but price is stuck (often precedes a massive breakout).
Integrated Split-Volume Profile
True Volume doesn't just show you where volume traded; it shows you who traded it.
-
Split Profiles: Automatically plots separate Point of Control (POC), Value Area (VA), and VWAP lines for Bullish, Bearish, and Neutral volume. See exactly where buyers are stepping up versus where sellers are defending.
-
Naked Projection: Automatically projects "Virgin" levels (untouched POCs/VWAPs) into the future to identify high-probability targets. Lines automatically terminate when price crosses them.
-
Session Management: Includes a built-in session manager (Sydney, Tokyo, London, New York) with auto-GMT detection to visualize institutional liquidity pools.
Forensic Smart Alerts
Stop getting spammed with meaningless alerts. True Volume uses a Context-Aware Engine that combines three layers of data into a single, actionable message:
-
The Signal: (e.g., Bullish Eclipse, Breakout, Pressure).
-
The Level: (e.g., Break of Daily POC, Rejection off London VWAP).
-
The Context: (e.g., Extreme Volume, Weak Volume).
True Volume :: EXTREME BULL : Bull Eclipse & Vol BrkOut -> BrkUp: Curr POC, S-1 VAH :: XAUUSD, H1
(Translation: Extreme buying volume caused a Bullish Eclipse and Breakout, smashing through the Current POC and Yesterday's Value Area High).
How to Interpret the Signals
1. The Histogram (The Context)
-
Green/Red Bars: Strong directional volume. The trend is healthy.
-
Blue/Indigo Bars (Neutral): WARNING. This is "Churn." Big money is fighting, but price isn't moving.
-
Trading Tip: Do not trade inside a Blue bar. Wait for a breakout.
-
2. The Arrows (The Triggers)
-
🟡 Breakout (Yellow):
-
Meaning: Volume has exploded through the recent average, and price has broken structure.
-
Action: This is your "Go" signal for momentum trades.
-
-
🟢/🔴 Eclipse (Big Arrows):
-
Meaning: Absorption/Reversal. The current volume completely overwhelmed the opposing volume of the previous bar. (e.g., Buyers ate all the Sellers).
-
Action: High-probability reversal signal, especially at Support/Resistance.
-
-
🟢/🔴 Pressure (Small Arrows):
-
Meaning: Sustained effort. Volume is increasing in the direction of the trend.
-
Action: Great for adding to positions or confirming a trend continuation.
-
-
🟢/🔴 Weakness (Hollow/Small Arrows):
-
Meaning: Exhaustion. Price is moving, but volume is dropping. The fuel is running out.
-
Action: Tighten your stop loss or look for a counter-trend entry.
-
⚪ Weakness (Hollow/Small Arrows):
-
Meaning: Conflict. Buyers are buying harder, and Sellers are selling harder simultaneously.
-
Action: Watch for absorption, potential reversal or continuation.
Core Settings Explained
1. True Volume Features
-
Show Highest/Lowest Lines: Toggles the gray reference lines on the histogram window. These help you instantly see if current volume is breaking recent records (Highest) or is below average (Midian).
2. Periods & Sensitivity
-
Volume Evaluation Period: The "Heartbeat" of the indicator. Lower values (e.g., 10) make it faster/more sensitive; higher values (e.g., 50) make it smoother.
-
HiLo Period: Determines the lookback for the gray Highest/Lowest reference lines.
-
Volume Thresholds (Extreme/Strong/Weak): These control the Color Intensity of the histogram bars.
-
Extreme (2.0): Triggers the brightest colors (e.g., Aqua/Magenta).
-
Strong (1.0): Triggers standard colors.
-
Weak (0.0): Triggers darker/dull colors.
-
3. Visuals (Arrows & Shifts)
-
Arrow Shifts: Allows you to move the arrows up or down relative to the candle. Use this to prevent arrows from overlapping with the candle wicks or other indicators.
-
Histogram Width: Adjusts the thickness of the volume bars..
4. Alerts
-
Trigger Candle:
-
Set to 1: Alerts when the candle closes (Confirmed signal).
-
Set to 0: Alerts immediately while the candle is forming (Aggressive/Repainting possible).
-
-
Notification Types: Supports Pop-ups, Sound, Email, and Mobile Push Notifications.
5. Volume Profile: Master Settings
-
Profile Modes: Toggle between Main Profile (standard timeframes like Daily/Weekly) or Session Profile (specific trading hours like London/New York).
-
History Depth: Controls how many past days or sessions are drawn on the chart.
-
Update Frequency: Optimizes performance. Choose On New Bar for efficiency or Every Tick for real-time scalping precision.
-
Naked Projection: Automatically projects important levels (POC, VWAP) forward into the future until price touches them.
-
Smart Cut(Terminate Projection): Keeps your chart clean by automatically terminating projected lines the moment price crosses them (Close-based).