Harness institutional strategies with Institutional VWAP Reversal EA: Capture reversals via VWAP deviation bands, volume spikes, and 200 EMA trend filter. Targets 5% monthly profit with 5% max daily DD, including profit caps, breakeven SL, and signal reversal options—ideal for prop-trading challenges. Customize TP/SL by percentages, RR, or candles; trade with trend or both sides. Optimized for forex majors and gold, with time-restricted execution for low-risk, reliable automation in volatile mar
Adaptive Multi-Hybrid (AMH) v3.0: A Next-Generation Intelligent Trading System for MetaTrader 5 Basic concept Unlike classic robots, AMH doesn't use grids, Martingale, or dangerous pending orders. Entries are made only at the market , when the global trend and local momentum are in sync. The system "breathes" with the market, widening or narrowing stop-losses depending on current volatility (ATR-Adaptation). Key Features (The Edge) Market Precision Execution: Entry at market price elim
This Volume Delta Profile is an advanced MetaTrader 5 indicator that visualizes volume delta (order flow imbalance) using a volume profile-style histogram. It shows the difference between buying and selling pressure at specific price levels, helping traders identify supply and demand zones. This indicator provides a unique perspective on market dynamics by visualizing the imbalance between buying and selling pressure, offering insights beyond traditional volume analysis. Core Concept Positiv
The "MR Volume Profile 5" indicator is a charting tool that displays trading volume at different price levels rather than time intervals. A key concept in volume profile is the point of control (POC)—the price level with the highest volume traded during the session or time range. While tools like VWAP or OBV provide volume trends, the "MR Volume Profile 5" indicator offers granular detail about where the most market activity occurs at specific price levels. This makes it a more precise tool for
The indicator works to convert normal volume into levels and determine financial liquidity control points.
It is very similar in function to Fixed Volume Profile.
But it is considered more accurate and easier to use than the one found on Trading View because it calculates the full trading volumes in each candle and in all the brokers present in MetaTrade, unlike what is found in Trading View, as it only measures the broker’s displayed prices.
To follow us on social media platforms:
telegram
Here our more valuable tools
SMC Trend Trading , Easy SMC Trading , Institutional SMC Architect Volume Analysis Tools , Volume flow Profile , Market volume profile , FVG with Volume , Liquidity Heatmap Profile , Volume Spread Analysis Short Description:
Stop overloading your charts with dozens of indicators. Bollinger Fibo Pro is a sophisticated, all-in-one trading system for MetaTrader 5 that merges two legendary concepts into a single, powerful tool. It enhances standard
Intraday Session TPO: Precision Volume Profiling for Day Traders Stop trading blind during the most volatile hours of the day. Standard daily volume profiles blend everything together, masking the true areas of liquidity and institutional interest. The Intraday Session TPO is engineered specifically for session-to-session traders. It empowers you to isolate and profile specific time windows—like the London Open, the New York Killzone, or the Asian range—so you can see exactly where the volume is
Correlation Matrix Pro - 다중 통화 헤지 스캐너 실시간으로 통화쌍 간의 상관관계를 파악하세요! 최대 6개의 통화쌍 간 통계적 관계를 동시에 시각화하는 강력한 분석 도구입니다. 포트폴리오 관리, 리스크 분산 및 헤지 전략에 완벽합니다. 주요 기능 - 로그 수익률을 사용한 실시간 피어슨 상관관계 - 최대 6개 통화쌍 동시 모니터링 - 자동 타임프레임 감지 - 조정 가능한 룩백 기간 (5-200 봉) - 헤지 기회 자동 감지 - 미니멀하고 접을 수 있는 패널 디자인 - 즉각적인 해석을 위한 색상 코딩 매트릭스 색상 코드 녹색 (+0.70 ~ +1.00) = 강한 양의 상관관계 연녹색 (+0.50 ~ +0.69) = 중간 양의 상관관계 회색 (-0.49 ~ +0.49) = 약한/상관관계 없음 주황색 (-0.50 ~ -0.69) = 중간 음의 상관관계 빨간색 (-0.70 ~ -1.00) = 강한 음의 상관관계 (헤지) 왜 상관관계인가? 리스크 관리 높은 상관관계 포지션을
This indicator, titled "Fixed Volume Profile.mq5", is a custom tool for MetaTrader 5 (MQL5) designed to calculate and display a Volume Profile over a user-defined fixed time range. The Volume Profile shows the distribution of trading volume at different price levels during a specific period, helping to identify areas of high activity (such as Points of Control or POCs) and volume-based support/resistance areas.
Main Functionality: Interactive Range: The indicator creates two vertical lines on
The safest Martin
The safest Martin 是一个多货币 EA,采用马丁策略,以其自有的波段算法为基础,并配以控仓技巧。只有价格到达关键位后EA才会发生交易。 The safest Martin 使用即时交易 4种货币对:EURUSD、AUDNZD、NZDUSD、USDCAD,GBPCAD。算法信号通过十年数据跑测验证,可以实现平稳盈利。 EA 在所有时间框架上都有效,不会丧失其盈利能力。然而,在 H4上观察到了最大效率。在此周期上的风险/盈利比最好。 建议使用账户余额在美元 10000 以上,且每一万美金的仓Lots建议0.01开始。
Lots 是选择固定手数后的具体数值。 H01Symbol--H05Symbol 是参与操作的7个货币对。请根据交易商特有商品表示对应改动。货币对后缀添加。
Here our more valuable tools
SMC Trend Trading , Easy SMC Trading , Institutional SMC Architect Volume Analysis Tools , Volume flow Profile , Market volume profile , FVG with Volume , Liquidity Heatmap Profile , Volume Spread Analysis 2. Key Features Dynamic Filtering : The core feature. As soon as the current price crosses a historical liquidity level, that level disappears. This reduces chart clutter and prevents you from trading off "dead" support/resistance. Liquidity Heatma
Volume & Move Strength (VMS) Indicator for MT5 The VMS Indicator displays the relationship between trading volume and price movement strength, helping traders assess how well market activity supports price action. How It Works: Measures tick volume as trading activity. Calculates move strength using a normalized True Range (%). Both values can be smoothed (default: 5) and optionally normalized (0–100) for consistency across markets. Plots two lines in a separate window: Blue (Volume) – trading a
The indicator automatically calculates the level and real volume Point of control, and also displays the market profile for an array of candles, within the boundaries of a rectangle. If your strategy is based on taking profit on a rebound from price accumulations, the Range profile indicator will become the main tool in scalping trading. Point of control is calculated based on the total volume for each tick or minute candles, depending on the settings and trading timeframe. In the abse
VWAP Fibo Bands RSJ is an indicator that traces the lines of the daily VWAP and from it creates bands using Fibonacci proportions. This spectacular indicator creates 10 band levels through the selected VWAP period using Fibonacci ratios.
It is fantastic how the prices respect each level of the bands, where it is possible to realize that almost every time the price closes above / below a level of the bands he will seek the next one. If close above will seek to reach the level above and if close
uGenesys AI - 90% Accurate Daytrading Indicator
Introducing the ultimate forex trading indicator system, uGenesys AI, powered by cutting-edge AI technology and advanced analytical techniques, including Time-Series Analysis and Genetic Algorithms. Our AI-powered trading system leverages the power of time-series analysis to identify trends and patterns in historical price data, allowing traders to make informed predictions about future market movements. By analyzing vast amounts of data, our syst
Scalper Vault 는 성공적인 스캘핑에 필요한 모든 것을 제공하는 전문 스캘핑 시스템입니다. 이 표시기는 외환 및 바이너리 옵션 거래자가 사용할 수 있는 완전한 거래 시스템입니다. 권장 시간 프레임은 M5입니다. 시스템은 추세 방향으로 정확한 화살표 신호를 제공합니다. 또한 상단 및 하단 신호와 Gann 시장 수준을 제공합니다. 이 시스템은 사용하기가 매우 쉽습니다. 원하는 시장 지역의 화살표만 따라가면 됩니다. 엑시트는 가격이 적정 수준에 도달하거나 시장의 고점 또는 저점 신호가 나타날 때 수행됩니다. 표시기는 PUSH 알림을 포함한 모든 유형의 경고를 제공합니다. 인디케이터 구매 후 연락주세요. 내 개인 거래 권장 사항과 훌륭한 보너스 지표를 무료로 공유합니다! 나는 당신에게 행복하고 유익한 거래를 기원합니다!
Here our more valuable tools
SMC Trend Trading , Easy SMC Trading , Institutional SMC Architect Volume Analysis Tools , Volume flow Profile , Market volume profile , FVG with Volume , Liquidity Heatmap Profile , Volume Spread Analysis The Liquidity Heatmap is a sophisticated institutional trading tool designed to reveal where over-leveraged traders are trapped. By calculating estimated liquidation levels based on volume spikes and leverage, this indicator draws a dynamic "h
VOLUME PROFILE SAF-XII MT5용 전문가급 마켓 프로파일 분석 도구 (그리드 스타일 트레이더를 위한 드림 인디케이터) 볼륨 프로파일(Volume Profile)이란? 볼륨 프로파일은 단순히 '시간'에 따른 거래량을 보여주는 일반 지표와 달리, 특정 '가격 수준'에서의 거래 활동을 표시하는 전문 기관용 도구입니다. 설정한 기간 내에 거래가 '어디서' 발생했는지를 시각화하여 다음을 식별할 수 있도록 돕습니다. 가치 영역 (VAH/VAL) – 전체 거래의 대부분이 발생한 가격대. 제어 지점 (POC) – 거래량이 가장 많이 집중된 단일 가격 수준. 유동성 불균형 – 각 가격대에서의 매수(Bull) vs 매도(Bear) 지배력. 지지/저항 – 실제 거래 활동에 기반한 자연적인 가격 지지 및 저항선. 3가지 작동 모드 – "설정 후 방치(Set and Forget)" 가능 VP_MANUAL (스윙 트레이딩 및 주요 레벨 분석) 사용자가 수직선을 드래그하여 분석 범위를 직접
Master Edition은 거래량과 자금 흐름의 관점을 통해 시장 구조를 시각화하도록 설계된 전문가급 분석 도구입니다. 표준 거래량 지표와 달리, 이 도구는 차트에 일일 거래량 프로필을 직접 표시하여 가격 발견이 발생한 위치와 "스마트 머니"가 위치한 곳을 정확하게 볼 수 있게 합니다. 이 Master Edition은 명확성과 속도를 위해 설계되었으며, 로드 시 차트 레이아웃을 즉시 아름답게 만드는 독특한 자동 테마 동기화 시스템을 특징으로 합니다. 주요 기능: 진정한 자금 흐름 계산: 표준 틱 거래량을 넘어섭니다. "Use Money Flow"를 활성화하면 거래량이 가격에 따라 가중치가 부여되어 특정 가격 수준에서의 실제 자본 투입을 드러냅니다. 가치 영역(VA) 시각화: 가치 영역(기본값: 거래량의 70%)을 자동으로 계산합니다. VA Fill: 통제 구역을 즉시 식별하기 위해 가치 영역 배경을 음영 처리합니다. 주요 수준: 통제점(POC), 가치 영역 고점(VAH), 가치 영
VDelta Profile Pro Volume Profile + Order-Flow Context for XAUUSD, US100 (NAS100) and US500 (SP500) VDelta Profile Pro builds a live volume profile directly on your chart, showing where the market actually traded — the Point of Control (POC), Value Area (VAH/VAL), and High Volume Nodes (HVN). These structural levels act as natural support and resistance zones that price tends to respect, react to, and return to. The core of this tool is volume-at-price : it measures how much activity occurred at
Advanced POC Fixed Range Volume Profile 은 MetaTrader 5용으로 설계된 대화형 볼륨 프로파일 지표입니다. 전체 알고리즘과 사용의 유동성은 TradingView의 유명한 "고정 범위 볼륨 프로파일(Fixed Range Volume Profile)" 도구를 기반으로 합니다. 차트의 임의의 영역을 수동으로 선택하여 거래량 분포를 분석할 수 있습니다. 이를 통해 유동성이 높은 구간, 가격 거부 영역, 특정 기간 동안 자산의 적정 가격을 즉시 식별할 수 있습니다. 주요 특징 POC(Point of Control), VAH(Value Area High), VAL(Value Area Low)의 시각적 강조. 온디맨드 거래량 분석: 계산이 시작되고 끝나는 위치를 정확히 선택합니다. 완벽한 반응형: 시간대(Timeframe)를 변경하거나 차트 확대/축소를 변경할 때 도구가 프로파일을 완벽하게 다시 계산하고 조정합니다. MT5에서 도구 사용 방법 간단한 단축키를
Volume Profile Rectangle 요약 선택한 영역 내에서 각 가격 수준별 거래량의 수평 분포를 시각화하는 인터랙티브 볼륨 프로파일 지표 입니다. 자동으로 이동 가능한 직사각형을 생성하고, 매수/매도 우세 거래량을 색상 막대로 표시합니다. 주요 기능: 수평 거래량 표시 : 각 가격 수준에서의 거래량 분포를 수평 막대 형태로 시각화 강세/약세 분석 : 매수 우세 거래량은 초록색, 매도 우세 거래량은 빨간색으로 표시 인터랙티브 직사각형 : 선택 영역(직사각형)을 이동하면 자동으로 분석이 업데이트됨 자동 생성 : 시작 시 기본 직사각형을 자동으로 생성하여 즉시 사용 가능 작동 방식: 영역 선택 : 자동 또는 수동으로 생성된 직사각형이 분석할 구간(시간 + 가격)을 정의 거래량 분포 계산 : 가격 구간을 여러 수준으로 나누고(해상도 설정 가능), 선택된 캔들의 거래량을 해당 구간에 분배 스마트 색상 분석 : 각 가격 수준별로 매수/매도 중 어느 쪽 거래량이 우세한지 판별 동적
Strategy Overview
The Ignition EA tries to take advantage of sudden momentum when the Ignition pattern is detected. The final bar in the ignition pattern has a small opening wick, a very little or no closing wick, is large in comparison to recent bars and must start from the lower end of the current range (for a bullish ignition)
Quick Testing
Use Symbol EURUSD, Timeframe M2, and remove the GBPUSD symbol from the "Symbols" input (stratergy 1 and stratergy 2)
Settings The below settings appe
The indicator calculates ZigZag using the classic algorithm with three parameters: Depth, Deviation, and Backstep. Its main function is detecting and visualizing repaints — moments when the last ZigZag point shifts to a new bar.
Upon loading, the indicator performs a simulation over the specified history depth. The algorithm sequentially recalculates ZigZag for each bar, comparing the current position of the last point with the previous one. If a shift is detected, a repaint line appears on the
Symbol Basket Control Panel is a professional trading utility designed to streamline multi-currency management. It acts as a centralized command center, allowing traders to execute and manage baskets of trades across different symbols with unparalleled speed and precision. Instead of manually opening and closing orders for each pair, this dashboard provides a high-performance graphical interface to control your entire portfolio from a single chart. Key Features: Centralized Execution: Open BUY o
GoldenX Entry는 MT5용 인디케이터로, 적응형 Smart Entry Trend 알고리즘, 신호 스코어링 시스템, 시장 레짐 감지 기능, 그리고 변동성 필터를 포함합니다. 각 신호에는 계산된 진입 레벨, 3개의 익절(TP1, TP2, TP3) 레벨, 그리고 손절(Stop-Loss) 레벨이 포함됩니다. 이 인디케이터는 다양한 시장 환경에 적응하도록 설계된 다중 분석 레이어 구조 위에 구축되어 있으며, 내장 최적화기와 통계 추적 시스템을 결합합니다. 또한 Risk-to-Reward(RR) 지표와 과거 거래 행동 기반의 정량 분석을 제공합니다. 시작은 간단합니다 — 선택한 타임프레임에서 최적화기를 실행한 뒤 차트에서 바로 인디케이터를 사용하면 됩니다. 핵심 기능
GoldenX Entry는 하나의 차트에서 신호 엔진, 트레이드 관리 기능, 그리고 과거 통계 추적을 통합합니다: - 내장 최적화기: 최적화기는 차트에서 원클릭으로 실행됩니다. 200개의 파라미터 조합을 두 단계 탐색
X Sensors Pro는 선택된 기간 동안 가격 수준별 거래량 분포를 시각화하는 전문 볼륨 프로파일 지표입니다. 이 지표는 자동으로 로컬 극값(HH와 LL)을 식별하고, 최대 거래량 수준인 POC(Point of Control)를 계산하며, 식별된 범위를 기반으로 지지선과 저항선을 구축합니다.
주요 기능:
컬러 히스토그램 형태의 볼륨 프로파일 시각화
POC(Point of Control) 자동 감지
HH(더 높은 고가) 및 LL(더 낮은 저가) 수준 구축
피벗 수준 및 다중 지지/저항 수준 계산
강세(녹색) 및 약세(빨간색) 거래량의 색상 표시
모든 시간대에 적응하는 조정 기능
이 지표의 용도는 무엇인가요?
이 지표는 트레이더의 다음과 같은 과제를 해결합니다:
1. 축적 및 분배 영역 식별
거래량은 항상 큰 세력이 시장에 진입하거나 이탈하는 곳에 집중됩니다. POC는 최대 거래량이 발생한 가격을 보여줍니다. 이것은 심리적으로 중요한 수준입니다.
2. 공정 가치 탐색
PO
Was: $249 Now: $99 Market Profile defines a number of day types that can help the trader to determine market behaviour. A key feature is the Value Area, representing the range of price action where 70% of trading took place. Understanding the Value Area can give traders valuable insight into market direction and establish the higher odds trade. It is an excellent addition to any system you may be using. Inspired by Jim Dalton’s book “Mind Over Markets”, this indicator is designed to suit the
The Initial Balance (Initial Balance / Initial Balance) is a concept related to the study of volume (to learn more, study about Market Profile and Auction Market Theory. You can find some videos in English when searching for "Initial Balance Market Profile").
The IB defines a range in which prices were negotiated in the first hour of trading.The amplitude of the range is important and the break in the range defined by the Initial Balance may have occurred due to the movement of several players
ARIPoint is a powerful trading companion designed to generate high-probability entry signals with dynamic TP/SL/DP levels based on volatility. Built-in performance tracking shows win/loss stats, PP1/PP2 hits, and success rates all updated live. Key Features: Buy/Sell signals with adaptive volatility bands Real-time TP/SL/DP levels based on ATR Built-in MA Filter with optional ATR/StdDev volatility Performance stats panel (Success, Profit/Loss, PP1/PP2) Alerts via popup, sound, push, or email Cu
PrimeScalping is a powerful trading companion designed to generate high-probability entry signals with dynamic TP/SL/DP levels based on volatility. Built-in performance tracking shows win/loss stats, PP1/PP2 hits, and success rates — all updated live.
Key Features: Buy/Sell signals with adaptive volatility bands Real-time TP/SL/DP levels based on ATR Built-in MA Filter with optional ATR/StdDev volatility Performance stats panel (Success, Profit/Loss, PP1/PP2) Alerts via popup, sound, push, or e
MERAVITH SCANNER는 MetaTrader 5용 전문 금융 시장 지표로, 여러 분석 도구를 하나의 통합 시스템으로 결합합니다. 독점적인 거래량 가중 평균 가격(VWAP) 방법론을 사용하여 모든 계산을 자동으로 수행하며, 주관적인 해석을 완전히 배제합니다. 이 지표는 모든 자산 클래스(Forex, 주식, 지수, 상품, 암호화폐)와 M1부터 월간 차트까지 모든 시간 프레임에서 작동합니다. 기본 원리는 “가격은 거래량을 따른다”입니다. MERAVITH는 기관 거래량이 집중되는 위치를 식별하고, 그 집중에서 수학적으로 정확한 가격 수준을 도출합니다. 예측이나 투기를 하지 않으며, 계산만 수행합니다. MERAVITH SCANNER를 사용하면 28개의 주요 Forex 통화쌍을 모든 시간 프레임에서 단 2~3분 만에 스캔할 수 있습니다. 또한 원하는 시장을 스캔할 수도 있으며, 예를 들어 약 100개의 주식을 약 10분 안에 스캔할 수 있습니다. 지표는 소진 레벨, 균형선, 편차, 통계
SmartScalping is a powerful trading companion designed to generate high-probability entry signals with dynamic TP/SL/DP levels based on volatility. Built-in performance tracking shows win/loss stats, PP1/PP2 hits, and success rates — all updated live.
Key Features: Buy/Sell signals with adaptive volatility bands Real-time TP/SL/DP levels based on ATR Built-in MA Filter with optional ATR/StdDev volatility Performance stats panel (Success, Profit/Loss, PP1/PP2) Alerts via popup, sound, push, or e
ScalpPoint is a powerful trading companion designed to generate high-probability entry signals with dynamic TP/SL/DP levels based on volatility. Built-in performance tracking shows win/loss stats, PP1/PP2 hits, and success rates — all updated live. Key Features: Buy/Sell signals with adaptive volatility bands Real-time TP/SL/DP levels based on ATR Built-in MA Filter with optional ATR/StdDev volatility Performance stats panel (Success, Profit/Loss, PP1/PP2) Alerts via popup, sound, push, or emai
MasterTrend Indicator for MT5
A powerful trend-following and signal-evaluation tool MasterTrend is a custom MT5 indicator that combines Moving Averages and ATR-based risk/reward logic to generate clear buy/sell signals. It visualizes dynamic SL/TP levels, evaluates past trade outcomes, and displays win/loss statistics in a clean on-chart panel. Key features include: Buy/Sell signals based on MA crossovers ATR-based SL/TP1/TP2/TP3 levels with visual lines and labels Signal outcome tracking wit
ARICoin is a powerful trading companion designed to generate high-probability entry signals with dynamic TP/SL/DP levels based on volatility. Built-in performance tracking shows win/loss stats, PP1/PP2 hits, and success rates all updated live. Key Features: Buy/Sell signals with adaptive volatility bands Real-time TP/SL/DP levels based on ATR Built-in MA Filter with optional ATR/StdDev volatility Performance stats panel (Success, Profit/Loss, PP1/PP2) Alerts via popup, sound, push, or email Cust
Классификатор силы тренда. Показания на истории не меняет. Изменяется классификация только незакрытого бара. По идее подобен полной системе ASCTrend, сигнальный модуль которой, точнее его аппроксимация в несколько "урезанном" виде, есть в свободном доступе, а также в терминале как сигнальный индикатор SilverTrend . Точной копией системы ASCTrend не является. Работает на всех инструментах и всех временных диапазонах. Индикатор использует несколько некоррелируемых между собой алгоритмов для класси
FFx Universal Strength Meter PRO is more than a basic strength meter. Instead of limiting the calculation to price, it can be based on any of the 19 integrated strength modes + 9 timeframes. With the FFx USM, you are able to define any period for any combination of timeframes. For example, you can set the dashboard for the last 10 candles for M15-H1-H4… Full flexibility! Very easy to interpret... It gives a great idea about which currency is weak and which is strong, so you can find the best pai
The FFx Universal MTF alerter shows on a single chart all the timeframes (M1 to Monthly) with their own status for the chosen indicator. 9 indicators mode (MACD-RSI-Stochastic-MA-ADX-Ichimoku-Candles-CCI-PSAR). Each can be applied multiple times on the same chart with different settings.
Very easy to interpret. Confirm your BUY entries when most of the timeframes are showing green color. And confirm your SELL entries when most of the timeframes are showing red color. 2 Alert Options : input to s
The FFx Watcher PRO is a dashboard displaying on a single chart the current direction of up to 15 standard indicators and up to 21 timeframes. It has 2 different modes: Watcher mode: Multi Indicators User is able to select up to 15 indicators to be displayed User is able to select up to 21 timeframes to be displayed Watcher mode: Multi Pairs User is able to select any number of pairs/symbols User is able to select up to 21 timeframes to be displayed This mode uses one of the standard indicators
FFx Patterns Alerter gives trade suggestions with Entry, Target 1, Target 2 and StopLoss .... for any of the selected patterns (PinBar, Engulfing, InsideBar, OutsideBar) Below are the different options available: Multiple instances can be applied on the same chart to monitor different patterns Entry suggestion - pips to be added over the break for the entry 3 different options to calculate the SL - by pips, by ATR multiplier or at the pattern High/Low 3 different options to calculate the 2 TPs -
MetaTrader 4 version available here : https://www.mql5.com/en/market/product/24881 FFx Basket Scanner is a global tool scanning all pairs and all timeframes over up to five indicators among the 16 available. You will clearly see which currencies to avoid trading and which ones to focus on.
Once a currency goes into an extreme zone (e.g. 20/80%), you can trade the whole basket with great confidence. Another way to use it is to look at two currencies (weak vs strong) to find the best single pairs
MetaTrader 4 version available here: https://www.mql5.com/en/market/product/25793 FFx Pivot SR Suite PRO is a complete suite for support and resistance levels. Support and Resistance are the most used levels in all kinds of trading. Can be used to find reversal trend, to set targets and stop, etc.
The indicator is fully flexible directly from the chart 4 periods to choose for the calculation: 4Hours, Daily, Weekly and Monthly 4 formulas to choose for the calculation: Classic, Camarilla, Fibonac
Recommended TimeFrame >= H1. 100% Non Repainted at any moment. Use it carefully, only with Trend Direction.
Trading Usage: 2 Variants: as Range System or as BreakOut System (Both Only With Trend Direction)::: (Always use StopLoss for minimise Risk);
[1] as Range System: (Recommended) in UP TREND: - BUY in Blue Line , then if price goes down by 50 points (on H1) open Second BUY. Close in any Profit you wish: TrailingStop(45 points) or Close when Price touches upper Gold Line.
in DOWN TREND
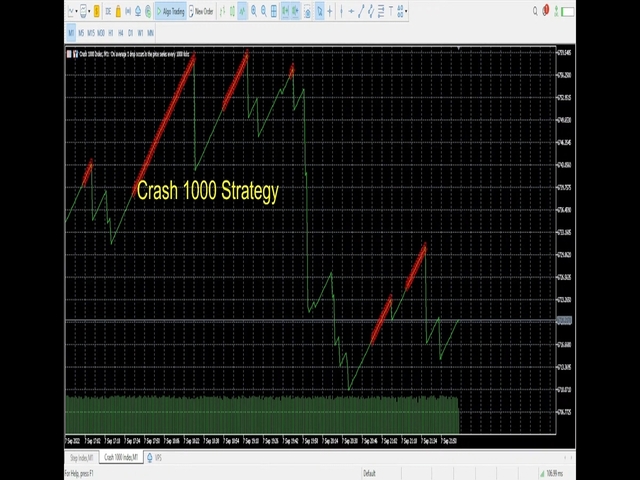
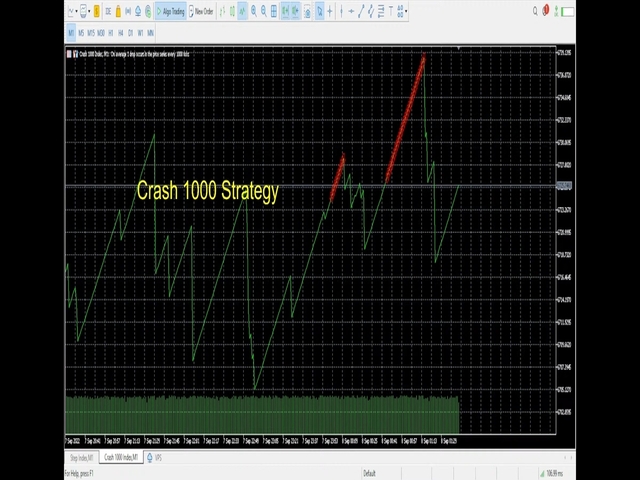
this indicator is a Spike detector indicator, it is specially designed to trade Boom 1000, Boom 500, Crash 1000 and Crash 500 We recommend using it on Deriv Boom and Crash indices only Its setting is intuitive, familiar, easy to use it has notification functions; audible notifications and push notifications. this tool is simple to use, easy to handle This update is based on different strategies for spikes
This indicator is based on the crossing of two Moving Average with the RSI It is intended for scalpers Specially designed for Boom and Crash syhtetic indices from Binary.com/Deriv.com It is easy to use and intuitive. We recommend its use on M1 and is equipped with three types of notification Email alert Sound notification Push notification these parameters can be activated and deactivated.
This indicator is a scalping indicator intended solely for the Boom and Crash indices of the Deriv Limited market It supports Boom 500, Boom 1000, Crash 500 and Crash 1000 Not repaint and no bug The settings are intuitive and easy to use The product activation number is 20 The Time Frame used depends on the user If you are an aggressive scalper then just use M1 For long trades use M15 If you are conservative use M5 Please contact me for more details of its use
Indicator is based on Market Maker Strategy. NO REPAINT.
MM's are traders and their objective is to make money. This includes strategies to trade against retails traders. The major difference between them and other traders is that they have the ability, through access to massive volumes, to move price at their will. So to make money, they aim to buy at a lower price and then sell at a higher price. They achieve this by: 1. Inducing traders to take positions. This is achieved by using a
The indicator places a buy or sell signal when the conditions of the strategy it was designed with are met. The strategy is guaranteed, strong, and has been tested for 9 years. The indicator is for binary options and can be converted into a bot by linking it to MT2Trading, where it sends the signal to this platform. This platform automatically opens a trade on the trading platform you are using, whether it is Pocket Option, IQ Option, or any other binary options platforms. The entry is on the n
CBT Quantum Maverick
고효율 바이너리 옵션 거래 시스템 CBT Quantum Maverick는 정밀하고 간단하며 체계적인 거래를 원하는 트레이더를 위해 설계된 고성능 바이너리 옵션 거래 시스템입니다. 사용자 지정이 필요 없으며, 처음부터 최적화된 결과를 제공합니다. 약간의 연습만으로 신호를 쉽게 마스터할 수 있습니다. 주요 특징: 정확한 신호 제공:
현재 봉 데이터를 기반으로 다음 캔들에 대한 신호를 생성하며, 빈번한 재도색이 없습니다. 다양한 시장에 대한 적응성:
바이너리 옵션 거래에 특화되었으며, 여러 브로커 및 자산 클래스와 호환됩니다. 호환 가능: Deriv Synthetic Charts: 모든 시간 프레임에서 사용 가능. OTC 차트: Quotex, PocketOption, Binomo, Stockity, IQOption, Exnova, OlympTrade, Deriv, Binolla, Homebroker 등의 브로커와 호환(MT5로의 무료 데이터 임
Introducing to your attention an innovative expert advisor created specifically for the most juicy and volatility currency basket: GBPUSD, XAUUSD and EURJPY. This system is designed using the main features of this market's movement, making it an ideal choice for dynamic trading on high-trending and medium-volatile pairs. The signals are focused on minimizing trading risks, aiming to reduce losses to a minimum.
Main features ESignals is designed to show open and close arrows at the beg
This strategy focuses on identifying and following clear market trends by filtering out noise and short-term fluctuations. Using advanced algorithms, it highlights significant upward and downward movements, enabling traders to make data-driven decisions. The indicator is designed for simplicity and precision, ideal for traders who prefer a systematic approach to trend trading. Whether you're a beginner or an experienced trader, this tool helps you stay aligned with the dominant market direction
PRICE WILL BE INCREASED TO £4999 SOON!
5 or 15 MINUTE CHART ONLY: A state-of-the-art trading indicator, designed with advanced analytical and mathematical programming, delivers top-tier buy and sell signals. Simply enter a small buy position when a green arrow appears and a small sell position when a red arrow is shown. While signals from this indicator are infrequent, they boast exceptional accuracy when generated. Please apply your own stop-loss and take-profit levels as needed.
مؤشر Smart Trend Candles هو أداة فعّالة في منصة MetaTrader 4، تجمع بين عناصر تحليل فني متعددة لتحديد اتجاهات السوق وقياس قوة المشترين والبائعين. يوفر هذا المؤشر متعدد الاستخدامات إشارات مرئية واضحة تُحسّن قرارات التداول الخاصة بك. الميزات الرئيسية 1. تحديد الاتجاه يستخدم شموع Heikin-Ashi المعدلة (اختياري) لتصفية ضوضاء السوق يتضمن متوسطًا متحركًا (فترة قابلة للتكوين) لتأكيد الاتجاه تنفيذ مؤشر القوة النسبية لقياس الزخم 2. قياس القوة تشير الشموع المرمزة بالألوان إلى شدة ضغط الشراء/البيع تحليل الحج
Advanced Analysis – Total Visual Clarity
The Ichimoku Dashboard features three powerful dashboards to deliver precise trading signals based on a proven methodology. The color-coded panel design allows users to instantly identify the status of each monitored financial instrument at a glance. The combined table of the "Ichimoku Dashboard" for MetaTrader 5 is a key component that integrates and synthesizes trading signals generated by the indicators, providing a clear and immediate overview to su
Trend Frequency Market MT5 Carry out analysis and backtest even before opening your orders, check the strategy's Winrate and stay in favor of the Trend and the strength of the movement.
The TFM indicator is specialized in providing you with the strength points of the movement, painting the candles GREEN or RED to report price aggression from the Players who are acting at the exact moment. Taking advantage of this detection, the indicator plots Arrow and Entry, Stop Loss and Take Profit levels
PRICE WILL BE INCREASED TO £4999 SOON!
Knight Rider FX is a precision-engineered trading indicator that delivers highly accurate, non-repainting signals without flooding your chart. It filters out noise and selectively highlights only the highest probability trade setups. On higher timeframes, it anticipates major market reversals, while on intraday charts it pinpoints mini reversals with tactical clarity. By focusing on quality over quantity, Knight Rider FX equips traders with disciplined ent