TMA KC Channel Indicator

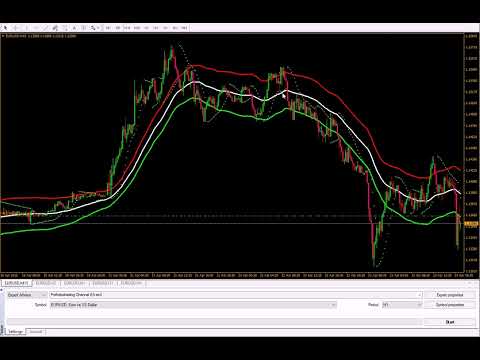
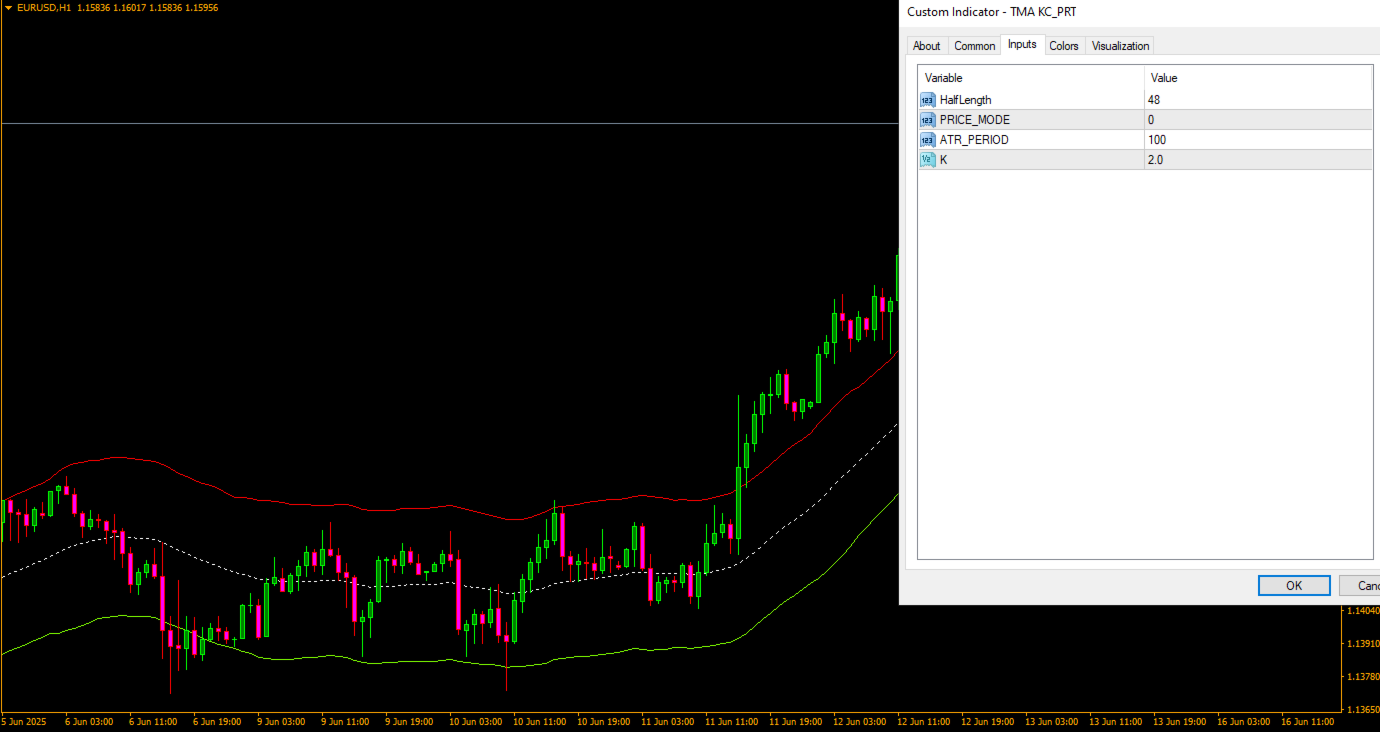
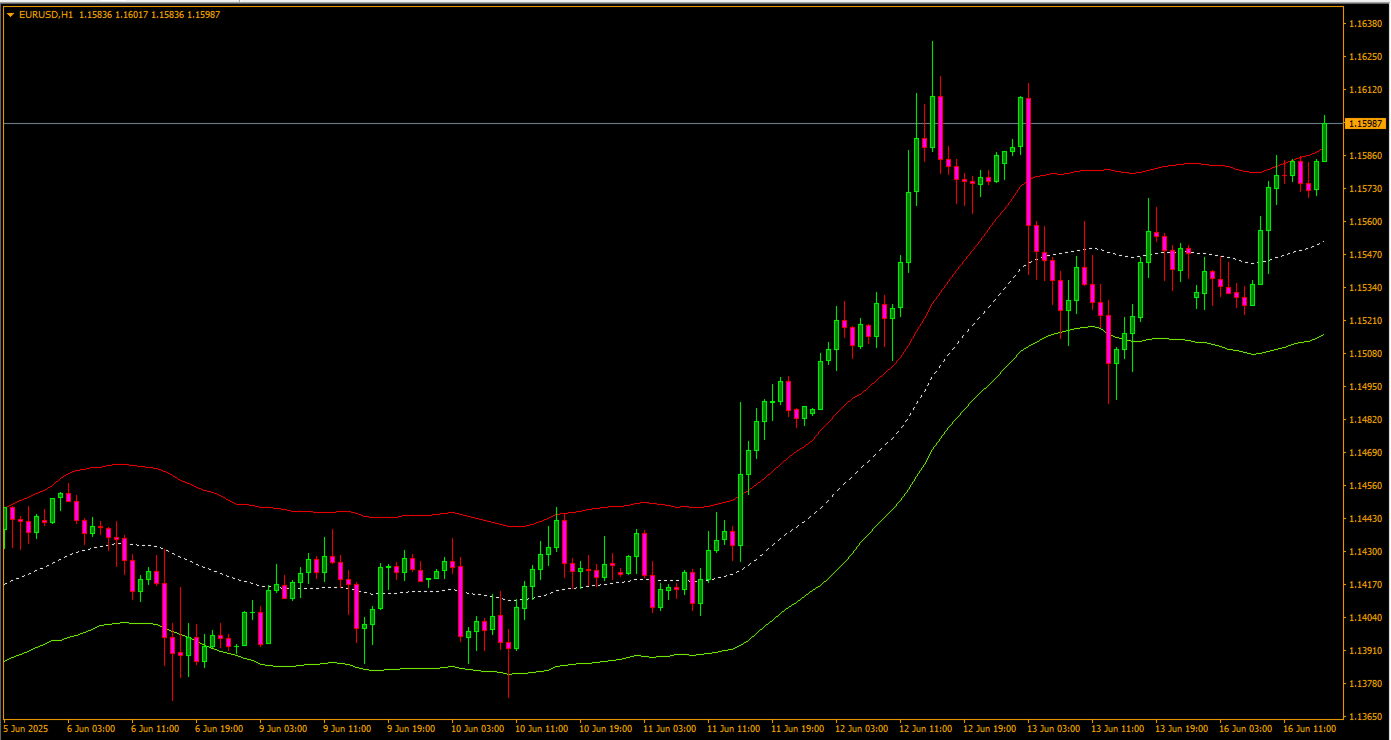
TMA_KC PRT is non-redrawn channel indicator and can be used to identify trend and support and resistance levels.


Indicator settings allow you to assign a specific coefficient to each price channel, which makes it possible to narrow or expand each channel separately.

The TMA_KC PRT indicator is a multicurrency instrument, so the choice of a timeframe depends solely on the trader’s preference. TMA_KC PRT indicator can be used on any time frame, so you can easily make the indicator an integral part of both a scalping strategy and a long-term strategy.
 
The channel direction angle indicates the direction of the trend. If the channel is directed upwards, positions are opened only for buying, and if downwards, only for selling. If the channel is directed horizontally, the market is flat, so it is worth trading on a rebound from the opposite borders of the channel.
 

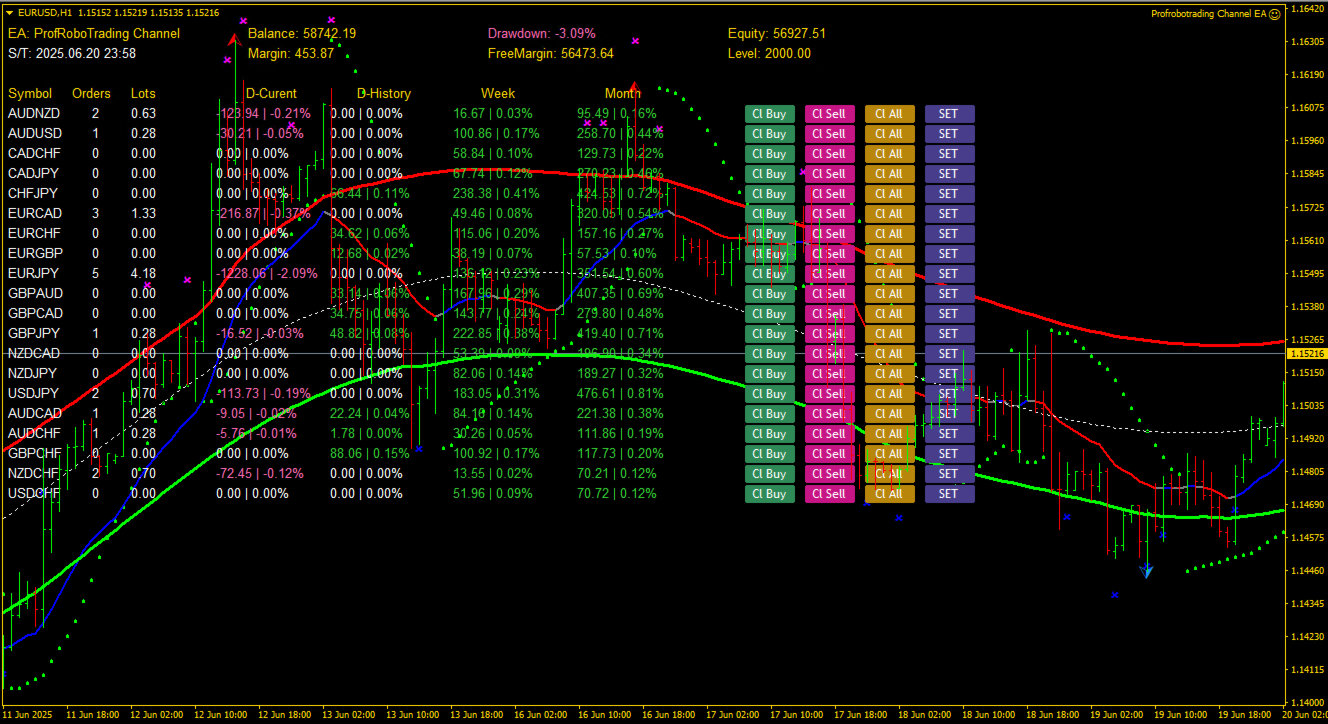
You can use this indicator in our versatile ProfRoboTrading Channel EA, in wich you can seamlessly integrate various channel, arrow, and reversal indicators. It offers the flexibility to use all popular channel trading strategies, while also providing powerful tools to customize your trading conditions and risk management system.


ProfRoboTrading Channel EA for MT4:

https://www.mql5.com/en/market/product/140233?source=Site+Market+MT4+New+Rating006


Universal Channel Expert Advisor for MT4:

https://www.mql5.com/en/market/product/135441?source=Site+Market+MT4+Search+Rating006%3aUniversal+Channel+Expert+Advisor


추천 제품
Lisek Levels and Channels Indicator
Darius Hans Lischka
4.8 (20)
Are you ready to become the Sherlock Holmes of forex trading? ️‍️ Introducing the ultimate trading toolkit:   Lisek Levels and Channels   Indicator !!! Forget juggling multiple indicators like a circus act. We've packed everything you need into one spectacular show: Price Levels? Check! Price Channels? You bet! Price VWAP? Oh yeah! Volume On Balance? It's all there! And the cherry on top? Alarms and Push Notifications that'll wake you up faster than a double espresso! ️ Your cha
FREE
PZ Trendlines
PZ TRADING SLU
4.27 (11)
Tired of plotting trendlines? The PZ TrendLines indicator applies a mechanical approach to the construction of trend lines for you! [ Installation Guide | Update Guide | Troubleshooting | FAQ | All Products ] It can draw up to 18 trendlines Trendlines can be optionally based on fractals Each line represents a breakout level Each trendline can be broken or rejected Configurable amount of lines Configurable colors Author Arturo López Pérez, private investor and speculator, software engineer and
FREE
Virtual Targets
Hoang Van Dien
3.83 (6)
This indicator is very useful for day traders or short term traders. No need to calculate the number of pips manually, just look at the chart and you will see the Virtual Take Profit / Virtual Stop Loss target line and evaluate whether the entry point is feasible to reach the intended target or not. Enter the intended Take Profit / Stop Loss pips for your trade. The indicator will display Virtual Take Profit / Virtual Stop Loss lines for you to easily see if the target is feasible or not.
FREE
WH Price Wave Pattern MT4
Wissam Hussein
4.4 (5)
Welcome to our   Price Wave Pattern   MT4 --(ABCD Pattern)-- The ABCD pattern is a powerful and widely used trading pattern in the world of technical analysis. It is a harmonic price pattern that traders use to identify potential buy and sell opportunities in the market. With the ABCD pattern, traders can anticipate potential price movements and make informed decisions on when to enter and exit trades. EA Version : Price Wave EA MT4 MT5 version : Price Wave Pattern MT5 Features :  Automatic
FREE
Schaff Trend Cycle이란? Schaff Trend Cycle(STC)은 추세 전환을 신속하게 포착하기 위해 설계된 오실레이터형 보조지표입니다. 기존의 이동 평균선이나 MACD와 달리, 시장의 주기적 흐름과 모멘텀을 결합하여 추세의 시작과 끝을 보다 명확하게 파악할 수 있도록 도와줍니다. 주요 특징 명확한 추세 전환 신호: 상승 추세에서는 STC 라인이 상승하고, 하락 추세에서는 하락합니다. 횡보장에서의 노이즈 감소: 주기 기반의 스무딩 처리를 통해 단기적인 변동을 억제합니다. 간편한 파라미터 조정: 기간 및 스무딩 설정을 통해 초보자부터 고급 사용자까지 폭넓게 활용할 수 있습니다. 계산 로직 개요 모멘텀 계산 설정된 기간 동안의 가격 변화를 기반으로 단기 및 장기 모멘텀을 계산합니다. 주기적 스무딩 모멘텀에 대해 이중 스무딩 처리를 적용하여 주기적인 진동 성분을 추출합니다. 정규화 처리 결과값을 0~100 사이로 정규화하여 오실레이터로 표시합니다. 신호 생성 일반
FREE
How would you like to instantly know what the current trend is? How about the quality of that trend? Finding the trend on a chart can be subjective. The Fractal Trend Finder indicator examines the chart for you and reveals what the current trend is based on objective criteria. Using the Fractal Trend Finder you can easily tell if you are trading with the trend or against it. It also identifies those times when the market is not trending. Theoretically, you could trade with the trend when the tre
FREE
Supply Demand Ribbon is an indicator with moving supply and demand lines that help you identify price zones more easily. The indicator helps you determine flexible entry, stop loss, and take profit areas. There are also strategies for algorithmically changing ribbon colors. From there you can come up with many trading strategies for yourself! MT5 Version:   Click here! You can explore many feature in   Advanced   version   here ! You can combine it with our indicators below to make your tradin
FREE
This indicator is designed to detect high probability reversal patterns: Double Tops/Bottoms with fake breakouts . This is the FREE version of the indicator: https://www.mql5.com/en/market/product/26371 The free version works only on EURUSD and GBPUSD! Please read also the blog post " Professional Trading With Double Tops/Bottoms And Divergences! " which explains the concepts behind the ULTIMATE Double Top/Bottom indicator and how you can use a professional top-down approach. The provided video
FREE
With this system you can spot high-probability trades in direction of strong trends. You can profit from stop hunt moves initiated by the smart money! Important Information How you can maximize the potential of the scanner, please read here: www.mql5.com/en/blogs/post/718109 Please read also the blog about the usage of the indicator: Professional Trading With Strong Momentum This FREE Version of the indicator works only on EURUSD and GBPUSD. The full version of the indicator can be found here:
FREE
Awesome Pivot Indicator
Komang Putra Riswanjaya
The Pivot Indicator is a vital tool for technical analysis used by traders in the financial markets. Designed to assist in identifying potential reversal points or trend changes, this indicator provides valuable insights into key levels in the market. Key features of the Pivot Indicator include: Automatic Calculations: The Pivot Indicator automatically calculates Pivot Point, Support, and Resistance levels based on the previous period's high, low, and close prices. This eliminates the complexity
FREE
The Red Dragons Support and Resistance Levels indicator automatically determines support and resistance levels using the proprietary algorithm based on historical and current data, so the levels are dynamic, which allows you to adjust trading targets based on the current price movement. For this reason, we use this indicator in our advisors, for example, Red Dragons, which you can purchase here: https://www.mql5.com/en/market/product/128713?source=Site +Market+MT4+New+Rating006 The panel also
FREE
Power Trend Free
Yurij Kozhevnikov
5 (2)
Power Trend Free - the indicator shows the trend strength in the selected period. Input Parameters The indicator has three input parameters: Period - a positive number greater than one, it shows the number of candlesticks used for calculations. If you enter one or zero, there will be no error, but the indicator will not be drawn. Applied Price - the standard "Apply to:" set meaning data used for the indicator calculation: Close - Close prices; Open - Open prices; High - High prices; Low - Low p
FREE
하모닉 패턴은 시장 반전점을 예측하는 데 가장 적합합니다. 이러한 패턴은 높은 승률과 하루 동안 다양한 거래 기회를 제공합니다. 저희 인디케이터는 하모닉 트레이딩 문헌에 기반하여 가장 인기 있는 하모닉 패턴을 식별합니다. 중요 사항: 이 인디케이터는 다시 그리지 않으며 (D 지점에서 패턴을 감지함), 따라잡지 않습니다 (패턴이 유효하거나 취소됨). 사용 방법: MT5 차트에 인디케이터를 끌어다 놓으세요. 패턴 감지를 TRUE로 설정하세요 (ABCD; Gartley). 원하는대로 편차를 조정하세요 (높은 편차는 더 많은 패턴, 낮은 편차는 더 적은 패턴). 색상을 원하는 대로 사용자 정의하세요. 필요에 따라 ENTRY POINT, TP 및 SL에 대한 경고를 활성화하거나 비활성화하세요. 패턴 감지 시: 알고리즘은 D 지점에서 패턴을 감지합니다. 경고가 활성화되어 있으면 패턴 감지에 대한 알림을 보냅니다. 패턴이 무효화되면 "패턴 취소"라는 메시지가 포함된 경고가 트리거됩니다. 성공적인
FREE
Follow The Line
Oliver Gideon Amofa Appiah
3.94 (16)
FOLLOW THE LINE GET THE FULL VERSION HERE: https://www.mql5.com/en/market/product/36024 This indicator obeys the popular maxim that: "THE TREND IS YOUR FRIEND" It paints a GREEN line for BUY and also paints a RED line for SELL.  It gives alarms and alerts of all kinds. IT DOES NOT REPAINT and can be used for all currency pairs and timeframes. Yes, as easy and simple as that. Even a newbie can use it to make great and reliable trades. NB: For best results, get my other premium indicators for more
FREE
Hi Low Levels Last Day MT4
Igor Vishnevskii
5 (1)
The free version of the Hi Low Last Day MT4 indicator . The Hi Low Levels Last Day MT4 indicator shows the high and low of the last trading day . The ability to change the color of the lines is available . Try the full version of the Hi Low Last Day MT4 indicator , in which additional indicator features are available : Displaying the minimum and maximum of the second last day Displaying the minimum and maximum of the previous week Sound alert when crossing max . and min . levels Selecting an arb
FREE
Support and resistance levels
Alexandr Bryzgalov
4.29 (17)
The indicator displays the probable ( Support and resistance ) levels. The indicator draws horizontal and trend levels of support and resistance. The indicator settings: Trends - the mode for displaying trend lines or horizontal lines of support and resistance Yes - display trend lines only No - display horizontal lines only UseResource - use the resources built into the indicator. Yes - use the ZigZag indicator from the resources of the product. No - use a custom ZigZag indicator. HistoryBar -
FREE
Wise Men Indicator demo
Bohdan Kasyanenko
3 (2)
The indicator displays signals according to the strategy of Bill Williams on the chart. Demo version of the indicator has the same features as the paid, except that it can work only on a demo account . Signal "First Wise Man" is formed when there is a divergent bar with angulation.  Bullish divergent bar - with lower minimum and closing price in the upper half. Bearish divergent bar - higher maximum and the closing price at the bottom half. Angulation is formed when all three lines of Alligator
FREE
Magic Supply Demand Indicator works on all products and timeframes. It is a new formula, and   the very new features are two zone strength functions adjustable by user input!   This is a great advantage in trading. When you learn how to use the proprietary features such as the zone strength with   min X-factor of price travel away, you will be able to tell whether the zone is strong or not. The supply and demand zones are used as an alert trigger.   You can use popup alert with sound on MetaTra
FREE
WPR Breakout MT4
Mohamed Hassan Mohamed Hassan Alsherbiny
When prices breakout resistance levels are combined with   Larry Williams' Percentage Range "WPR"   oscillator breaks out its historical resistance levels then probability emerges to record farther prices.   It's strongly encouraged to confirm price breakout with oscillator breakout since they have comparable effects to price breaking support and resistance levels; surely, short trades will have the same perception. Concept is based on find swing levels which based on number of bars by each side
FREE
Super Auto Fibonacci
Muhammed Emin Ugur
Discover the power of precision and efficiency in your trading with the " Super Auto Fibonacci " MT4 indicator. This cutting-edge tool is meticulously designed to enhance your technical analysis, providing you with invaluable insights to make informed trading decisions. Key Features: Automated Fibonacci Analysis: Say goodbye to the hassle of manual Fibonacci retracement and extension drawing. "Super Auto Fibonacci" instantly identifies and plots Fibonacci levels on your MT4 chart, saving you tim
FREE
TreendLines
Sajjad Karimi
5 (1)
''Trendlines'' is an Indicator, that every Trader need and shows Trendline and  Support and resistance levels in all  Timeframe's. Also In 1-hour, 4-hour and daily time frames and Current timeframes, support, and resistance levels are specified and trend lines are drawn so that the trader can see all levels on a chart.   In   Properties   it is possible to turn off unnecessary Lines.  In ' Tendency indicator '' , as full package of Predictions that every Trader need, there  is also the Predict
FREE
Classic ZigZag formula. But no lags and repaints. You can see on screenshots that it shows values between peaks and it is useful to test strategies based on indicator. Because sometimes people find a good idea about it but don't understand that repainting indicators have some things to keep in mind. The parameters are the same as original ZigZag indicator: Depth, Deviation and Backstep.
FREE
.................................if you need pivot point s levels............................... ............................this is a daily pivot point level creator........................... ...it is for daily pivots and show levels at times period H4 , H1 , M30 , M15 ,M 5... .................................also shows levels for 3 last days.............................. ................can use it with other indicators and see important levels...............
FREE
MA Search 3
Mariusz Piotr Rodacki
This indicator allows you to overlay three different moving averages on the chart simultaneously. Each of these moving averages has additional settings such as: -Time frame -Shift -MA method -Applied price Using this indicator, you can easily set up three moving averages and find the one that suits you the best. You can also use this indicator to determine the trend when the moving averages cross.
FREE
StrikePin
Mike Pascal Plavonil
1 (1)
The StrikePin indicator is a technical, analytical tool designed to identify trend reversals and find optimal market entries.  The StrikePin indicator is based on the pin bar pattern, which is the Price Action reversal pattern. An entry signal, in a trending market, can offer a very high-probability entry and a good risk to reward scenario. Be careful: the indicator is repainting since it is looking for highest high and lowest lows.  You should avoid to use it in experts but you can use it in
FREE
Hidden Support And Resistance
Lesedi Oliver Seilane
5 (1)
updated hidden market support and resistance. this indicator is made for new current market that has new support and resistance that some traders struggle to see. The indicator works on all timeframes from the 1-minute timeframe to the monthly One Trading tip to use When price is at resistance and the indicator appears wait for a bearish candle to close then enter a sell trade. Same applies for a buy trade when price reaches support level, and the indicator appears wait for the bullish candle
FREE
Pivot SR
Wartono
4.67 (3)
It identifies the pivot, support, and resistance price levels of the selected timeframe and then draws lines onto the chart. FEATURES: Option to specify the Timeframe Period in the PivotSR calculation. Option to display the PivotSR of the last candle, of every candle, or of the current candle. Options for displaying labels, line thickness, and line color. PivotSR can be interpreted as reversal levels or past price reactions that can be used as the basis for current price analysis. Some traders b
FREE
Candle Countdown — MT4용 정확한 캔들 종료 시간 카운트다운 Candle Countdown은 차트 위에 현재 캔들이 종료될 때까지 남은 시간 을 표시하는 간단하고 정확한 도구입니다. 진입 시점이 캔들 마감에 의존하는 경우, 몇 초의 차이도 중요합니다. 이 인디케이터는 정확한 시간을 보여주어 서두르거나 추측하지 않고 결정을 내릴 수 있도록 도와줍니다. 캔들 종료 시간을 정확하게 제어하기 위한 인디케이터입니다. 표시 내용: 캔들 종료까지 남은 시간 현재 서버 시간 스프레드 Stop Level 타이머는 틱에 의존하지 않고 플랫폼의 내부 타이머를 통해 업데이트되므로, 시장 움직임이 적은 상황에서도 안정적으로 동작합니다. 이로 인해 낮은 변동성 구간에서도 부드럽고 안정적인 카운트다운을 제공합니다. 모든 정보는 배경 블록에 표시되어 어떤 차트 색상에서도 잘 보이며, 차트 분석을 방해하지 않습니다. 캔들 종료 시점이 가까워질수록 타이머 색상이 변경되어 빠르게 상황을 파악할 수
FREE
Free automatic fibonacci
Tonny Obare
4.67 (49)
Free automatic Fibonacci is an indicator that automatically plots a Fibonacci retracement based on the number of bars you select on the BarsToScan setting in the indicator. The Fibonacci is automatically updated in real time as new highest and lowest values appears amongst the selected bars. You can select which level values to be displayed in the indicator settings. You can also select the color of the levels thus enabling the trader to be able to attach the indicator several times with differe
FREE
SR indicator
Alexander Chertnik
5 (2)
SR is a support and resistance indicator, it shows major highs and lows by different colors. The color of a level is changing if the last high or low are touching it. After the closing of a bar above or below level, it will delete it. extern inputs: loop for candles / colors / drawing time *This indicator signal is not perfect and have to be used with other market analysis and confirmations.
FREE
이 제품의 구매자들이 또한 구매함
Gann Made Easy
Oleg Rodin
4.83 (157)
Gann Made Easy 는 mr.의 이론을 사용하여 최고의 거래 원칙을 기반으로 하는 전문적이고 사용하기 쉬운 Forex 거래 시스템입니다. W.D. 간. 이 표시기는 Stop Loss 및 Take Profit Levels를 포함하여 정확한 BUY 및 SELL 신호를 제공합니다. PUSH 알림을 사용하여 이동 중에도 거래할 수 있습니다. 구매 후 거래 방법 안내 및 유용한 추가 지표를 무료로 받으시려면 저에게 연락주세요! 아마도 Gann 거래 방법에 대해 이미 여러 번 들었을 것입니다. 일반적으로 Gann의 이론은 초보자 거래자뿐만 아니라 이미 거래 경험이 있는 사람들에게도 매우 복잡한 것입니다. Gann의 거래 방식은 이론적으로 적용하기 쉽지 않기 때문입니다. 나는 그 지식을 연마하고 Forex 지표에 최고의 원칙을 적용하기 위해 몇 년을 보냈습니다. 표시기는 적용하기가 매우 쉽습니다. 차트에 첨부하고 간단한 거래 권장 사항을 따르기만 하면 됩니다. 지표는 지속적으로 시장 분석
Scalper Inside PRO
Alexey Minkov
4.74 (69)
An exclusive indicator that utilizes an innovative algorithm to swiftly and accurately determine the market trend. The indicator automatically calculates opening, closing, and profit levels, providing detailed trading statistics. With these features, you can choose the most appropriate trading instrument for the current market conditions. Additionally, you can easily integrate your own arrow indicators into Scalper Inside Pro to quickly evaluate their statistics and profitability. Scalper Inside
Dynamic Scalper System
Vitalyi Belyh
5 (1)
" Dynamic Scalper System " 지표는 추세 파동 내에서 스캘핑 방식으로 거래하도록 설계되었습니다. 주요 통화쌍 및 금에서 테스트되었으며, 다른 거래 상품과의 호환성이 가능합니다. 추가적인 가격 변동 지원을 통해 추세에 따라 단기 포지션 진입 신호를 제공합니다. 지표의 원리 큰 화살표는 추세 방향을 결정합니다. 작은 화살표 형태의 스캘핑 신호를 생성하는 알고리즘은 추세 파동 내에서 작동합니다. 빨간색 화살표는 상승 방향을, 파란색 화살표는 하락 방향을 나타냅니다. 민감한 가격 변동선은 추세 방향으로 그려지며, 작은 화살표의 신호와 함께 작용합니다. 신호는 다음과 같이 작동합니다. 적절한 시점에 선이 나타나면 진입 신호가 형성되고, 선이 있는 동안 미결제 포지션을 유지하며, 완료되면 거래를 종료합니다. 권장되는 작업 시간대는 M1~H4입니다. 화살표는 현재 캔들에 형성되며, 다음 캔들이 이미 시작되었더라도 이전 캔들의 화살표는 다시 그려지지 않습니다. 입력 매개
Atomic Analyst
Issam Kassas
5 (3)
우선적으로 언급할 점은이 거래 지표가 다시 그리지 않고 지연되지 않으며 이를 통해 수동 및 로봇 거래 모두에 이상적이라는 점입니다. 사용자 매뉴얼: 설정, 입력 및 전략. Atomic Analyst는 가격의 강도와 모멘텀을 활용하여 시장에서 더 나은 이점을 찾는 PA Price Action Indicator입니다. 고급 필터를 장착하여 잡음과 거짓 신호를 제거하고 거래 잠재력을 높이는 데 도움이 됩니다. 복잡한 지표의 다중 레이어를 사용하여 Atomic Analyst는 차트를 스캔하고 복잡한 수학적 계산을 간단한 신호와 색상으로 변환하여 초보 트레이더가 이해하고 일관된 거래 결정을 내릴 수 있도록합니다. "Atomic Analyst"는 새로운 및 경험이 풍부한 트레이더를위한 종합적인 거래 솔루션입니다. 프리미엄 지표와 최고 수준의 기능을 하나의 거래 전략에 결합하여 모든 종류의 트레이더에 대한 다재다능한 선택지가되었습니다. 인트라데이 거래 및 스캘핑 전략 : 빠르고 정확한 일일
M1 Sniper
Oleg Rodin
5 (19)
M1 SNIPER 는 사용하기 쉬운 거래 지표 시스템입니다. M1 시간대에 맞춰 설계된 화살표 지표입니다. 이 지표는 M1 시간대 스캘핑을 위한 단독 시스템으로 사용할 수 있으며, 기존 거래 시스템의 일부로도 사용할 수 있습니다. 이 거래 시스템은 M1 시간대 거래용으로 특별히 설계되었지만, 다른 시간대에도 사용할 수 있습니다. 원래는 XAUUSD와 BTCUSD 거래를 위해 이 방법을 설계했지만, 다른 시장 거래에도 유용하다는 것을 알게 되었습니다. 이 지표의 신호는 추세 방향과 반대로 거래될 수 있습니다. 저는 지표의 신호를 활용하여 양방향으로 거래할 수 있도록 돕는 특별한 거래 기법을 알려드립니다. 이 방법은 특별한 동적 지지선과 저항선 가격 영역을 활용하는 것을 기반으로 합니다. 구매하시면 M1 SNIPER 화살표 지표를 바로 다운로드하실 수 있습니다. 또한, 아래 스크린샷에 표시된 Apollo Dynamic SR 지표는 M1 SNIPER 도구를 사용하는 모든 사용자에게 무료로
Trend Lines PRO
Roman Podpora
5 (1)
트렌드 라인즈 프로       이 지표는 시장이 실제로 어떤 방향으로 전환되는지 파악하는 데 도움이 됩니다. 실제 추세 반전 지점과 주요 시장 참여자들이 다시 진입하는 지점을 보여줍니다. 보시다시피       BOS 라인       복잡한 설정이나 불필요한 노이즈 없이 더 높은 시간대의 추세 변화와 주요 레벨을 확인할 수 있습니다. 신호는 차트에 다시 그려지지 않고 캔들이 마감된 후에도 계속 표시됩니다. VERSION MT 5   -   RFI LEVELS PRO   표시기   와 결합할 때 최대 잠재력을 발휘합니다. 지표가 보여주는 내용: 실제 변화       추세(BOS 라인) 한 번 신호가 나타나면 그 신호는 계속 유효합니다! 이는 신호를 발생시킨 후 변경될 수 있는 리페인팅 방식의 지표와 중요한 차이점입니다. 리페인팅 방식의 지표는 잠재적으로 자금 손실로 이어질 수 있습니다. 이제 더욱 높은 확률과 정확도로 시장에 진입할 수 있습니다. 또한 화살표가 나타난 후 목표가(익절)
Dynamic Forex28 Navigator
Bernhard Schweigert
4.43 (7)
Dynamic Forex28 Navigator - 차세대 외환 거래 도구. 현재 49% 할인. Dynamic Forex28 Navigator는 오랫동안 인기 있는 지표의 진화형으로, 세 가지의 힘을 하나로 결합했습니다. 고급 통화 Strength28 지표(695개 리뷰) + 고급 통화 IMPULSE with ALERT(520개 리뷰) + CS28 콤보 신호(보너스). 지표에 대한 자세한 정보 https://www.mql5.com/en/blogs/post/758844 차세대 Strength 지표는 무엇을 제공합니까?  원래 지표에서 좋아했던 모든 것이 새로운 기능과 더 높은 정확도로 강화되었습니다. 주요 기능: 독점적인 통화 Strength 공식.  모든 시간대에 걸쳐 부드럽고 정확한 강도선. 추세와 정확한 진입을 식별하는 데 이상적입니다. 역동적인 시장 피보나치 수준(시장 피보나치).  이 지표에만 있는 고유한 기능. 가격 차트가 아닌 통화 강도에 피보나치가 적용됩니다.
Volatility Trend System - a trading system that gives signals for entries. The volatility system gives linear and point signals in the direction of the trend, as well as signals to exit it, without redrawing and delays. The trend indicator monitors the direction of the medium-term trend, shows the direction and its change. The signal indicator is based on changes in volatility and shows market entries. The indicator is equipped with several types of alerts. Can be applied to various trading ins
Smart Price Action Concepts
Issam Kassas
4.75 (12)
우선적으로, 이 거래 도구는 전문적인 거래에 이상적인 비-다시 그리기 및 지연되지 않는 지표입니다.  온라인 강좌, 사용자 매뉴얼 및 데모. 스마트 가격 액션 컨셉트 인디케이터는 신규 및 경험 많은 트레이더 모두에게 매우 강력한 도구입니다. Inner Circle Trader Analysis 및 Smart Money Concepts Trading Strategies와 같은 고급 거래 아이디어를 결합하여 20가지 이상의 유용한 지표를 하나로 결합합니다. 이 인디케이터는 스마트 머니 컨셉트에 중점을 두어 대형 기관의 거래 방식을 제공하고 이동을 예측하는 데 도움을 줍니다.  특히 유동성 분석에 뛰어나 기관이 어떻게 거래하는지 이해하는 데 도움을 줍니다. 시장 트렌드를 예측하고 가격 변동을 신중하게 분석하는 데 탁월합니다. 귀하의 거래를 기관 전략에 맞추어 시장의 동향에 대해 더 정확한 예측을 할 수 있습니다. 이 인디케이터는 시장 구조를 분석하고 중요한 주문 블록을 식별하고 다양한
Cyclic Impulse
Vitalyi Belyh
차트를 구조화하고 주기적인 가격 변동을 식별하는 기술 지표입니다. 모든 차트에서 작업할 수 있습니다. 다양한 유형의 알림. 그래프 자체에도 추가 화살표가 있습니다. 역사를 재구성하지 않고, 촛불을 닫는 작업에 임한다. M5 이상에서 권장되는 TF입니다. 사용 및 구성이 쉬운 매개변수입니다. 매개변수가 다른 2개의 지표를 사용하는 경우, 다른 지표 없이 해당 지표만 사용할 수 있습니다. 2개의 입력 매개변수가 있습니다 주기성과 신호 지속 시간 이 2개의 매개변수는 차트 구조의 처리와 관련이 있습니다. Cyclicity - 역전 주기가 얼마나 자주 바뀌는지 조절하고 주기를 매끄럽게 합니다. Signal duration - 최소 숫자에서는 가격 움직임의 충격을 감지하고, 최대 숫자에서는 장기적 추세 움직임을 감지합니다.. --------------------------------
Trend indicator AI
Ramil Minniakhmetov
4.49 (84)
트렌드 인공 지능 지표는 실행 가능한 진입 점 및 반전 경고와 추세 식별을 결합하여 상인의 시장 분석을 향상시킬 훌륭한 도구입니다. 이 표시기는 사용자가 자신감과 정밀도로 외환 시장의 복잡성을 탐색 할 수 있도록 지원합니다 기본 신호 외에도 트렌드 인공 지능 지표는 풀백 또는 되돌림 중에 발생하는 2 차 진입 점을 식별하여 거래자가 기존 트렌드 내에서 가격 수정을 활용할 수 있도록합니다. 중요한 장점: ·작동 4 및 5 *명확한 구매 또는 판매 신호 *다시 칠하지 않습니다 *모든 자산에서 작동 나는 전보 사기에 개 또는 세트를 판매하지 않도록주의. 모든 설정은 블로그에 여기에 무료.  중요! 지침 및 보너스를 얻기 위해 구입 후 즉시 저에게 연락! 진짜 가동 감시는 뿐 아니라 나의 다른 제품 여기에서 찾아낼 수 있습니다: https://www.mql5.com/en/users/mechanic/seller&nbsp ; 설정 및 입력: 모든 자산에 대해 기본 설정을 권
Scalper Vault
Oleg Rodin
5 (36)
Scalper Vault 는 성공적인 스캘핑에 필요한 모든 것을 제공하는 전문 스캘핑 시스템입니다. 이 표시기는 외환 및 바이너리 옵션 거래자가 사용할 수 있는 완전한 거래 시스템입니다. 권장 시간 프레임은 M5입니다. 시스템은 추세 방향으로 정확한 화살표 신호를 제공합니다. 또한 상단 및 하단 신호와 Gann 시장 수준을 제공합니다.  이 시스템은 사용하기가 매우 쉽습니다. 원하는 시장 지역의 화살표만 따라가면 됩니다. 엑시트는 가격이 적정 수준에 도달하거나 시장의 고점 또는 저점 신호가 나타날 때 수행됩니다.  표시기는 PUSH 알림을 포함한 모든 유형의 경고를 제공합니다. 인디케이터 구매 후 연락주세요. 내 개인 거래 권장 사항과 훌륭한 보너스 지표를 무료로 공유합니다! 나는 당신에게 행복하고 유익한 거래를 기원합니다!
GOLD Impulse with Alert
Bernhard Schweigert
4.67 (12)
이 지표는 Advanced Currency IMPULSE with ALERT  +   Currency Strength Exotics  의 2가지 제품의 슈퍼 조합입니다. 그것은 모든 시간 프레임에 대해 작동하며 8개의 주요 통화와 하나의 기호에 대한 강약의 충동을 그래픽으로 보여줍니다! 이 표시기는 금, 이국적인 쌍, 상품, 지수 또는 선물과 같은 기호에 대한 통화 강도 가속을 표시하는 데 특화되어 있습니다. 금, 은, 오일, DAX, US30, MXN, TRY, CNH 등의 진정한 통화 강도 가속(충동 또는 속도)을 표시하기 위해 9번째 줄에 모든 기호를 추가할 수 있습니다. 새로운 기본 알고리즘을 기반으로 구축되어 잠재적인 거래를 훨씬 더 쉽게 식별하고 확인할 수 있습니다. 이는 통화의 강세 또는 약세가 가속되는지 여부를 그래픽으로 표시하고 가속 속도를 측정하기 때문입니다. 자동차의 속도계처럼 생각하면 됩니다. 가속화할 때 Forex 시장에서 동일한 일이 분명히 더 빠르
이 지표를 구매하면 제 프로페셔널 트레이드 매니저를 무료로 드립니다. 우선 이 거래 시스템이 리페인팅, 리드로잉 및 레이그 인디케이터가 아니라는 점을 강조하는 것이 중요합니다. 이는 수동 및 로봇 거래 모두에 이상적인 것으로 만듭니다. 온라인 강좌, 설명서 및 프리셋 다운로드. "스마트 트렌드 트레이딩 시스템 MT5"은 새로운 및 경험이 풍부한 트레이더를 위해 맞춤형으로 제작된 종합적인 거래 솔루션입니다. 10개 이상의 프리미엄 인디케이터를 결합하고 7개 이상의 견고한 거래 전략을 특징으로 하여 다양한 시장 조건에 대한 다목적 선택이 가능합니다. 트렌드 추종 전략: 효과적인 트렌드 추이를 타기 위한 정확한 진입 및 손절 관리를 제공합니다. 반전 전략: 잠재적인 트렌드 반전을 식별하여 트레이더가 범위 시장을 활용할 수 있게 합니다. 스캘핑 전략: 빠르고 정확한 데이 트레이딩 및 단기 거래를 위해 설계되었습니다. 안정성: 모든 인디케이터가 리페인팅, 리드로잉 및 레이그가 아니므로 신뢰
Advanced Supply Demand
Bernhard Schweigert
4.91 (299)
현재 40% 할인! 초보자나 전문 트레이더를 위한 최고의 솔루션! 이 보조지표는 우리가 다수의 독창적 기능과 새로운 공식을 통합한 독특하고 고품질이며 저렴한 거래 도구입니다. 이 업데이트를 통해 이중 시간대를 표시할 수 있습니다. 더 높은 TF를 표시할 수 있을 뿐만 아니라 차트 TF와 더 높은 TF 모두를 표시할 수 있습니다: 중첩 영역 표시. 모든 Supply Demand 트레이더들이 좋아할 것입니다. :) 중요한 정보 공개 Advanced Supply Demand의 잠재력을 극대화하려면 다음을 방문하십시오. https://www.mql5.com/ko/blogs/post/720245   진입 또는 목표의 명확한 트리거 포인트를 정확히 찾아냄으로 해서 거래가 어떻게 개선될지 상상해 보십시오. 새로운 알고리즘을 기반으로 매수자와 매도자 간의 잠재적인 불균형을 훨씬 더 쉽게 분간할 수 있습니다. 왜냐하면 가장 강한 공급영역과 가장 강한 수요 영역과 과거에 어떻게 진행 되었는지를(이전
The Super Arrow Indicator provides non-repainting buy and sell signals with exceptional accuracy. Key Features No repainting – confirmed signals remain fixed Clear visual arrows: green for buy, red for sell Real-time alerts via pop-up, sound, and optional email Clean chart view with no unnecessary clutter Works on all markets: Forex, gold, oil, indices, crypto Adjustable Parameters TimeFrame Default: "current time frame" Function: Sets the time frame for indicator calculation Options: Can be set
CRT Multi-Timeframe Market Structure & Liquidity Sweep Indicator Non-Repainting | Multi-Asset | MT5 Version Available MT5 Version:   https://www.mql5.com/en/market/product/162075 Full User Guide — explains what each feature does and why:   https://www.mql5.com/en/blogs/post/767525 Quick Start User Guide  — explains how to configure and in what order:  https://www.mql5.com/en/blogs/post/767540 Indicator Overview CRT Ghost Candle HTF Fractal is a complete institutional-grade market structure too
Auto Optimized Parabolic RSI: 고급 3D 모멘텀 엔진 대부분의 개인 투자자용 보조지표는 시장의 변동성이 변하는 순간 무용지물이 되는 정적인 입력값에 의존하기 때문에 실패합니다. Auto Optimized Parabolic RSI는 자체적인 수학적 우위를 지속적으로 재계산하여 "보조지표 노후화" 문제를 해결하며, 기관급 퀀트 트레이딩의 적응력을 귀하의 MT5 터미널에 직접 제공합니다. 핵심 이점: 맞춤형 인메모리 3D 최적화   표준 자동 최적화 도구들은 일반적인 보조지표 호출로 터미널에 과부하를 일으켜 MT5 플랫폼을 멈추게 하는 경우가 많습니다. 이 도구는 이러한 병목 현상을 완전히 우회합니다. 맞춤형 네이티브 RAM 기반 계산기로 구축된 내부 엔진은 차트를 로드하거나 타임프레임을 변경할 때마다 빛처럼 빠른 3D 그리드 검색을 실행합니다. RSI 기간(주기), SAR 스텝(가속도) 및 SAR 최대치(속도 제한)를 동시에 스캔하여 플랫폼 지연 없이 수만 개의
Scalping Entry Points - is a manual trading system that can adjust to price movements and give signals to open trades without redrawing. The indicator determines the direction of the trend by the central level of support and resistance. The dot indicator provides signals for entries and exits.  Suitable for manual intraday trading, scalping and binary options. Works on all time frames and trading instruments. The indicator gives several types of alerts. How to use the product The blue line det
FX Volume
Daniel Stein
4.63 (38)
FX Volume: 브로커 시각에서 바라보는 진짜 시장 심리 간단 요약 트레이딩 접근 방식을 한층 더 향상시키고 싶으신가요? FX Volume 는 소매 트레이더와 브로커의 포지션을 실시간으로 파악할 수 있게 해 줍니다. 이는 COT 같은 지연된 보고서보다 훨씬 빠릅니다. 꾸준한 수익을 추구하는 분이든, 시장에서 더 깊은 우위를 원하시는 분이든, FX Volume 을 통해 대규모 불균형을 찾아내고, 돌파 여부를 확인하며 리스크 관리를 정교화할 수 있습니다. 지금 시작해 보세요! 실제 거래량 데이터가 의사결정을 어떻게 혁신할 수 있는지 직접 경험해 보시기 바랍니다. 1. 트레이더에게 FX Volume이 매우 유익한 이유 탁월한 정확도를 지닌 조기 경보 신호 • 다른 사람들보다 훨씬 앞서, 각 통화쌍을 매수·매도하는 트레이더 수를 거의 실시간으로 파악할 수 있습니다. • FX Volume 은 여러 리테일 브로커에서 추출한 실제 거래량 데이터를 종합해 명확하고 편리한 형태로 제공하는
현재 40% 할인 ! 초보자 또는 전문가 트레이더를 위한 최고의 솔루션! 이 대시보드 소프트웨어는 28개의 통화 쌍에서 작동합니다. 2가지 주요 지표(Advanced Currency Strength 28 및 Advanced Currency Impulse)를 기반으로 합니다. 전체 Forex 시장에 대한 훌륭한 개요를 제공합니다. 고급 통화 강도 값, 통화 이동 속도 및 모든(9) 시간대의 28 Forex 쌍에 대한 신호를 보여줍니다. 추세 및/또는 스캘핑 기회를 정확히 파악하기 위해 차트의 단일 지표를 사용하여 전체 시장을 볼 수 있을 때 거래가 어떻게 개선될지 상상해 보십시오! 잠재적인 거래를 식별하고 확인하면서 강력한 통화와 약한 통화를 더욱 쉽게 식별할 수 있도록 이 지표에 기능을 내장했습니다. 이 표시기는 통화의 강세 또는 약세가 증가 또는 감소하는지 여부와 모든 시간대에서 수행되는 방식을 그래픽으로 보여줍니다. 추가된 새로운 기능은 현재 시장 조건 변화에 적응하는
Super Reversal Indicator with Alert 개요 Super Reversal Indicator with Alert는 다중 시간 프레임 분석을 기반으로, 스토캐스틱 모멘텀, 수요와 공급 영역, 그리고 가격 반전 신호를 결합하여 높은 확률의 시장 반전 기회를 식별하도록 설계된 트레이딩 도구입니다. 이 지표는 명확한 시각적 신호와 실시간 알림을 통해 트레이더가 시장의 전환 지점을 쉽게 파악할 수 있도록 도와줍니다. 주요 기능 다중 시간 프레임 스토캐스틱 분석 상위 시간 프레임의 스토캐스틱 오실레이터 사용 (사용자 설정 가능) 모멘텀 변화 및 교차 신호 감지 정밀한 진입을 위한 과매수 및 과매도 구간 제공 반전 리젝션 신호 주요 가격 구간에서 강한 리젝션 캔들 감지 다음 위치에서의 반전 식별 일일 고점 (매도 반전) 일일 저점 (매수 반전) 차트에 화살표로 표시하여 직관적인 확인 가능 수요 및 공급 영역 H4 및 D1 시간 프레임에서 주요 영역 자동 표시 다음 영역 강조
Meravith
Ivan Stefanov
5 (3)
마켓 메이커를 위한 도구. Meravith는 다음과 같은 기능을 제공합니다: 모든 타임프레임을 분석하고 현재 유효한 추세를 표시합니다. 강세와 약세 거래량이 동일한 유동성 구간(거래량 균형 구간)을 강조 표시합니다. 서로 다른 타임프레임의 모든 유동성 레벨을 차트에 직접 표시합니다. 텍스트 기반 시장 분석을 생성하여 참고용으로 제공합니다. 현재 추세를 기반으로 목표가, 지지선 및 손절가를 계산합니다. 거래의 위험 대비 보상 비율(Risk/Reward)을 계산합니다. 계좌 잔고에 따라 포지션 크기를 산출하고 잠재 수익을 추정합니다. 시장에 중대한 변화가 발생할 경우 경고도 제공합니다. 지표의 주요 라인: 강세/약세 거래량 소진 라인 — 목표가로 사용됩니다. 시장 추세를 나타내는 라인. 시장이 강세인지 약세인지에 따라 색상이 변경되며 추세 지지선 역할을 합니다. 색상은 주로 시장 심리를 보여줍니다. 거래량 균형선(Eq). Eq(Volume Equilibrium) 라인은 시스템의 핵심입니
Market Maker Reversal Scanner
Siyasanga Stephen Mabokela
Market Maker Reversal Scanner — Professional Watchlist Builder for Reversal Traders (MT4/MT5) If you trade reversals, your biggest enemy isn’t entries — it’s watchlist selection . Most traders waste hours scrolling charts and end up forcing trades on “meh” instruments. Market Maker Reversal Scanner solves that by doing one job extremely well: It scans your symbols and highlights the instruments that are “in play” for reversal conditions — so you can focus on the best setups during your session i
PZ Order Block
PZ TRADING SLU
간단하면서도 효과적인 포지션 트레이딩 전략인 Order Blocks의 개인적인 구현. 가격 범위가 브레이크 아웃의 반대 방향으로 위반되지 않은 경우 거래자는 시장에 진입하거나 마지막 주문 블록 방향으로 거래를 찾아야 합니다. 명확성을 위해 열린 블록은 그려지지 않습니다. [ 설치 가이드 | 업데이트 가이드 | 문제 해결 | 자주하는 질문 | 모든 제품 ] 강세 오픈 블록은 신시장 저점 이후의 첫 번째 강세 막대입니다. 약세 오픈 블록은 신시장 고점 이후 첫 번째 약세 막대입니다. 오픈 블록이 깨졌을 때 시그널이 나타나 오더 블록이 됨 오더블록이 반대편으로 깨지면 반전블록이 된다 표시기는 모든 종류의 경고를 구현합니다. 다시 칠하거나 다시 칠하지 않습니다. 입력 매개변수 기간: 새로운 고가 또는 저가를 생성하는 데 필요한 막대의 양입니다. 값이 작을수록 더 많은 신호가 발생합니다. 최소 ATR 필터: ATR의 승수로 표시되는 주문 블록 막대의 최소 본체 크기입니다. 최대 ATR 필
RFI levels PRO
Roman Podpora
5 (1)
이 지표는 추세 반전 지점과 가격 반등 영역을 정확하게 보여줍니다.       주요 투자자들   . 새로운 트렌드가 형성되는 곳을 파악하고 최대한 정확하게 의사결정을 내리며 모든 거래를 완벽하게 통제합니다. TREND LINES PRO   지표와 함께 사용할 때 최대의 잠재력을 발휘합니다.  VERSION MT5 지표가 보여주는 내용: 새로운 추세의 시작 시 활성화되는 반전 구조 및 반전 수준. 최소한의 위험 대비 수익률을 갖는 이익 실현   (TAKE PROFIT)   및   손절매(STOP LOSS)   레벨 표시       RR 1:2   . 지능형 손실 감소 로직이 적용된 손절매 기능. 지정된 지표에서 두 가지 추세 유형에 대한 반전 패턴을 표시합니다. 지표: 트렌드를 따라   트렌드 라인 프로   (글로벌 트렌드 변화) 트렌드 프로   (빠른 트렌드 변화) 간단하고 효과적입니다       스캐너       실시간 추세 (신규). 다중 시간 프레임 도구 필터링. 표시하다  
Pips Generator
Oleg Rodin
4.6 (10)
Apollo Pips Generator 는 추세의 방향으로 신호를 제공하는 지표입니다. 표시기는 여러 진입점을 제공하므로 항상 이익을 얻을 수 있는 거래 기회를 찾을 수 있습니다. 스크린샷에 주의하세요. 스크린샷은 상단과 하단을 나타내는 별 신호가 있는 채널로 표시되는 다른 도구와 함께 Pips Generator 도구를 보여줍니다. 이 조합은 시스템을 적용할 수 있는 여러 방법을 제공합니다. 구매 후 두 번째 표시기를 무료로 받으려면 저에게 연락하십시오. 스크린샷에 나와 있는 것과 완전히 동일한 시스템을 갖게 될 것입니다. 또한 최상의 결과를 얻기 위해 이 시스템을 사용하는 방법에 대한 지침도 제공합니다. 두 도구 모두 PUSH 알림을 포함한 모든 유형의 경고를 제공합니다. 나는 당신에게 행복한 거래를 기원합니다!
TrendLine PRO MT4
Evgenii Aksenov
4.83 (167)
The Trend Line PRO indicator is an independent trading strategy. It shows the trend change, the entry point to the transaction, as well as automatically calculates three levels of Take Profit and Stop Loss protection. Trend Line PRO is perfect for all Meta Trader symbols: currencies, metals, cryptocurrencies, stocks and indices. The indicator is used in trading on real accounts, which confirms the reliability of the strategy. Robots using   Trend Line PRO   and real Signals can be found here:   
CyberZingFx Volume Plus
Afsal Meerankutty
4.94 (17)
Advanced version of CyberZingFx Volume Plus, the ultimate MT4 indicator for traders seeking highly accurate buy and sell signals. With an additional strategy and price action dot signals that enhances its effectiveness, this indicator offers a superior trading experience for professionals and beginners alike. The CyberZingFx Volume Plus Advanced version combines the power of volume analysis and historical price data with an additional strategy, resulting in even more precise and reliable signals
Support Resistance screnner
STE S.S.COMPANY
4.95 (37)
Support And Resistance Screener는 하나의 지표 안에 여러 도구를 제공하는 MetaTrader에 대한 하나의 레벨 지표입니다. 사용 가능한 도구는 다음과 같습니다. 1. 시장 구조 스크리너. 2. 완고한 후퇴 영역. 3. 약세 후퇴 영역. 4. 일일 피벗 포인트 5. 주간 피벗 포인트 6. 월간 피벗 포인트 7. 고조파 패턴과 볼륨에 기반한 강력한 지지와 저항. 8. 은행 수준 구역. LIMITED TIME OFFER : HV 지원 및 저항 표시기는 50 $ 및 평생 동안만 사용할 수 있습니다. ( 원래 가격 125$ ) 메타트레이더 백테스터 제한 없이 인디케이터를 사용하시겠습니까? 데모 버전을 다운로드하려면 여기를 클릭하십시오. 주요 특징들 고조파 및 볼륨 알고리즘을 기반으로 하는 강력한 지원 및 저항 영역. Harmonic 및 Volume 알고리즘을 기반으로 한 강세 및 약세 풀백 영역. 시장 구조 스크리너 일간, 주간 및 월간 피벗 포인트. 문서 모
제작자의 제품 더 보기
Extreme Spike PRT
Irina Cherkashina
The Extreme Spike PRT Indicator   is an effective tool for identifying   sharp market fluctuations .   It performs its calculations using the ATR (Average True Range) indicator and displays candles with extreme volatility in two categories:   primary spikes   and   secondary spikes , within the Metatrader platform oscillator window. This tool assists traders in detecting   intense price movements   and conducting more precise   analyses   based on these fluctuations. Time Frame 15-minute - 1-ho
Regression_Channel_mod Indicator that expands our standard linear regression channel by adding support and resistance lines. Easy to integrate into other indicators. The linear regression channel consists of several parallel lines equidistant from the upper and lower part of the linear regression trend line. The distance between the channel boundaries and the regression line is equal to the deviation of the maximum closing price from the regression line.
TMA Centered Bands Indicator
Irina Cherkashina
5 (1)
The TMA Centered Bands Indicator for MT5 draws bands on the chart and shows the overall price trend. It displays three bands - the lower and upper boundaries of the channel and the median.   The bands are made up of moving averages, and each of them has an MA period. The name TMA comes from triangular moving averages, as the indicator draws triangular bands.   The price will fluctuate between these ranges whenever the trend changes direction, thus creating entry and exit points.   How to trade
FREE
The Channel Sgnals ProfRoboTrading Indicator for MT5 is an effective Forex trading tool designed to track market movements.   The MT5 signal point indicator effectively detects trend reversals after they have already occurred. This Indicator   is a fully automated technical tool that includes a number of parameters to track market trends.   It automatically examines the ever-changing price dynamics of the market, compares the information with earlier data and generates a trading signal. Because
FREE
Kalires Channel Indicator
Irina Cherkashina
3 (1)
The Kalires Channel Indicator is a technical indicator used to evaluate trend direction and potential trading opportunities. This is a hybrid indicator that combines Kauffman Adaptive Moving Average (KAMA), linear regression and smoothing. The Kalires Channel Indicator consists of two lines: one central and two outer bands. The central line is a smoothed KAMA modified according to the direction of the trend. The outer bars represent two linear regression lines drawn above and below the center l
FREE
Our modernized version of the popular channel TMA_TRUE  indicator for MT4, which provides information on the main points of trend reversal and momentum exhaustion by drawing a channel on the chart, also draws arrows of signals for buy and sell. As a result, traders can identify bullish and bearish price reversal zones and BUY and SELL accordingly. This indicator works well on all instruments and on all Timeframes. This indicator is the basis of our Channel Trigger EA, which you can buy in MQL
FREE
Bollinger Bands Stop Indicator holds significant importance for traders navigating the complex world of financial markets. Its relevance lies in several key aspects. Firstly, it aids in trend identification. By analyzing price movements relative to the Bollinger Bands, traders can discern whether the market is in an uptrend, downtrend, or ranging phase. Secondly, the indicator provides valuable insights into market volatility. Wider bands indicate higher volatility, while narrower bands suggest
FREE
The TrendOscillator Indicator is an upgraded version of the traditional Stochastic Oscillator.   It comprises two lines: %K and %D.   The %K line represents the current market position.   In contrast, the %D line is a moving average of the %K line used to generate signals and identify potential entry or exit points. The good thing is the indicator works on all timeframes like the traditional Stochastic.   However, to avoid any false signals, applying the indicator on longer timeframes is better
FREE
The TMA Centered Bands indicator for MT4 draws bands on the chart and reports the overall price trend, as well as gives arrows signals to buy and sell when the bar closes outside the channel. Unlike many TMAs, our version uses the calculation part of the algorithm without redrawing, and also adds the ability to select a symbol. The bands are made up of moving averages, and each of them has an MA period. The name TMA comes from triangular moving averages, as the indicator draws triangular bands
FREE
The TrendChannelTracker Indicator is an innovative Forex trading tool. This indicator, which is based on the standard Stochastic Oscillator, provides traders with a unique and simplified method for observing market trends. In contrast to the traditional Stochastic Oscillator, which is shown at the bottom of the chart, the TrendChannelTracker Indicator is built into the price action itself. This removes the need for traders to continually switch their attention between the oscillator and the pri
FREE
The Forex Gangster Indicator allows you to determine the current trend. If the Forex Gangster Indicator line has moved below the price and turned blue, then you should open deals for an increase. If the Forex Gangster Indicator line has appeared above the price and turned red, then you should open deals for a decrease: The indicator is suitable for any time frames, but it needs to be supplemented with filtering indicators, since by itself it is late and does not have time to give an accurate si
FREE
This indicator works by plotting fractals on the chart as arrows that can be used as buy or sell signals. It is a great tool for both new and experienced traders as it provides a clear visual representation of the market and helps traders identify fractals. Although it repaints, it can be used quite effectively in conjunction with other tools to filter trading strategies. We use this indicator in this way in our Royal Fractals EA, which you can purchase on the MQL5 Market: https://www.mql5.com
FREE
This indicator works by plotting fractals on the chart as arrows that can be used as buy or sell signals. It is a great tool for both new and experienced traders as it provides a clear visual representation of the market and helps traders identify fractals. Although it repaints, it can be used quite effectively in conjunction with other tools to filter trading strategies. We use this indicator in this way in our RoyalFractals II Expert Advisor, which you can purchase on the MQL5 Market: https:
FREE
The BandsFill Indicator is a modified Bollinger Bands with a colored cloud.   It has two adjustable parameters: Period Deviation The cloud is colored as follows: If the price crosses the upper band, the cloud is blue. If the price crosses the lower band, the cloud is pink.   Thanks to this, the BandsFill Indicator provides traders with an easy opportunity to detect various features and patterns in price dynamics that are invisible to the naked eye. Based on this information, traders can predict
FREE
Moving Averages Divergence 3x3    Indicator     uses the crossover technique for signaling the market trend and the trade opportunities as well.     It applies 3 formats of the same indicator and allows them to plot the crossover signals which are interpreted as the trade signals along with the direction of the market trend. Moving Averages Divergence 3x3    Indicator   can be applied to trade all kinds of forex currency pairs within the financial markets.  Although, this indicator works well o
FREE
The Teamtrader Channel Stop indicator allows you to determine the current trend. If the Teamtrader Channel Stop indicator line has moved below the price and turned blue, then you should open deals for an increase. If the Teamtrader Channel Stop indicator line has appeared above the price and turned red, then you should open deals for a decrease: The indicator is suitable for any time frames, but it needs to be supplemented with filtering indicators, since by itself it is late and does not have
FREE
The Red Dragons Support and Resistance Levels indicator automatically determines support and resistance levels using the proprietary algorithm based on historical and current data, so the levels are dynamic, which allows you to adjust trading targets based on the current price movement. For this reason, we use this indicator in our advisors, for example, Red Dragons, which you can purchase here: https://www.mql5.com/en/market/product/128713?source=Site +Market+MT4+New+Rating006 The panel also
FREE
Forex Gangster PRT
Irina Cherkashina
FOREX GANGSTER is a unique Expert Advisor created by a professional prop trader and financial asset manager with many years of experience. This is a solution for those who strive for stable profits without constant control over each transaction or monitoring the work of a trading advisor. Created for optimal conservative trading and investing through exchange instruments with long-term regular profits and minimal risks. The Expert Advisor algorithm is based on a deep understanding of market pat
The Wolf Wave Finder Indicator is a popular indicator, that is useful in identifying potential trading opportunities.   The indicator works by recognizing the Wolf Wave pattern, which is a well-known pattern used by professional traders to identify potential areas of support and resistance.   The indicator is easy to use and provides traders with an easy way to identify potential trades.   The Wolf Wave Finder Indicator is a great tool for traders who are looking for a reliable and accurate way
Fibo Parabolic PRT
Irina Cherkashina
This indicator is a fusion of the Parabolic SAR and Fibonacci indicators. Fibo is drawn on the last wave, at the peaks the indicator displays prices for convenience. Parabolic SAR helps to define the market trend and generates trends following trade signals.     On the other hand, Fibonacci plots the price retracement levels so that traders can determine a better and safer place to enter the market. Scalping with Parabolic SAR and Fibonacci Overview. For this strategy, in addition to our indica
This is an easy-to-set-up and easy-to-use Expert Advisor that will help you always have the necessary information about your trading account at hand, sending from MetaTrader 4 to you in Telegram: • Account drawdown • Number of open positions • Volume of open positions • Profit per day, week, month How to get an chat ID: - Chat with BotFather to create Bot and get API Token of Bot. If you had Bot, skip the step. - Chat with bot @userinfobot , then the bot will reply your ID. How to setu
Symbol Manager PRT
Irina Cherkashina
The SYMBOL MANAGER symbol change indicator is an effective tool designed to enhance trading convenience and significantly simplify the trader's experience. This indicator allows users to switch seamlessly between currency pairs and timeframes within a single open window of the trading terminal. Importantly, when switching, the associated template, including indicators and current chart settings, is automatically duplicated, ensuring a consistent trading environment.
Morning Star PRT 지표는 모닝 플랫 브레이크아웃 원리를 사용합니다. 이 지표는 모닝 플랫 레벨을 표시하고 가능한 타겟을 보여줍니다. 지표에 피보나치 레벨이 추가되었고, 설정에서 지정한 두 타겟 레벨과 나이트 플랫 레벨의 교차점에 대한 경고음이 울립니다. Morning Star PRT 지표는 나이트가 끝날 때 나이트 플랫 채널을 구축하고, 두 개의 피보나치 가격 레벨이 위아래로 움직입니다. 이러한 레벨은 타겟 레벨과 반전 레벨로 간주할 수 있습니다. Morning Star PRT 지표는 모든 타임프레임에서 작동하지만 M15 간격에서 사용하는 것이 가장 효과적입니다. The Morning Star PRT indicator uses the morning flat breakout principle. The indicator displays morning flat levels and shows possible targets. An additional Fibonacci le
지표 공급 및 수요 구역 PRT– 차트의 공급 및 수요 구역 표시를 수행하는 데 사용되는 사용자 지정 도구입니다. 이 지표는 저항/지지 수준과 공급/수요 구역을 강조하는 차트에 선과 사각형을 그립니다. 편의상 선과 그림은 모두 다른 색상으로 칠해져 신호를 서로 쉽게 구별할 수 있습니다. 이 지표는 아직 사용되지 않았고 가격이 아직 돌파하지 않은 새로운 수준만 그립니다. 초보자와 숙련된 트레이더 모두에게 적합합니다. 이 지표는 스캘핑, 트렌드, 카운터 트렌드 및 기타 트레이딩 시스템에서 사용됩니다. 이것은 모든 전략에 쉽게 포함될 수 있는 보편적인 알고리즘입니다. 모든 시간 프레임과 도구에서 잘 보이고 오실레이터와 잘 결합됩니다. Indicator Supply & Demand zones PRT– is a custom tool that is used to perform supply and demand zones marking of the chart. The indicator draw
Pattern Master PRT
Irina Cherkashina
이 지표는 차트 패턴을 식별하고자 하는 트레이더에게 강력한 도구이며, 이를 트레이딩 전략에 통합하는 데에는 수많은 이점이 있습니다. 이 도구는 금융 시장에서 잠재적인 추세와 반전을 효과적으로 식별하고 신호를 보내 트레이딩 수익성을 높입니다. 고급 알고리즘 덕분에 이 지표는 시장 데이터를 정확하게 분석하여 트레이더에게 정보에 입각한 결정을 내리는 데 도움이 되는 귀중한 정보를 제공할 수 있습니다. 이 지표를 사용하면 차트 패턴을 높은 정확도로 자동으로 식별하므로 시장을 보다 포괄적으로 분석할 수 있습니다. 이러한 패턴은 종종 특정 방향으로 잠재적인 가격 움직임을 나타냅니다. 따라서 이 정보에 액세스할 수 있으면 트레이더는 이러한 패턴을 인식하거나 의미를 이해하지 못할 수 있는 다른 시장 참여자보다 유리합니다. 이 지표는 광범위한 강세 및 약세 패턴 인식 기능을 자랑합니다(차트에서 약어로 표시된 명칭은 괄호 안에 표시됨): - Rising Star(SS); - Evening St
This universal expert advisor is based on our own Algorithm, which is based on effective and time-tested Elliot Wave Theory.  This   expert advisor   is ideal for working both on a flat and during sharp or protracted trend movements (thanks to the Martingale method, according to which averaging positions are opened in accordance with the multiplier and distance set in the settings for accepting a new signal). ATTENTION! CAREFULLY STUDY THE OPERATING PRINCIPLE AND AVAILABLE SETTINGS OF THE EXPER
This is the automatic price spike signal indicator for MT4. Plots advance alerts on potential breakouts/pullbacks. Suits forex, stocks & crypto trading strategies. This is a perfect indicator for reversal traders. A spike often indicates a turn-around moment. The best way to use that gauge is to apply it to your favourite trading system as a filter. 這是 MT4 的自動價格飆升訊號指示器。繪製有關潛在突破/回調的預先警報。適合外匯、股票和加密貨幣交易策略。 對於反轉交易者來說,這是一個完美的指標。尖峰通常表示轉變時刻。使用該指標的最佳方法是將其作為過濾器應用到您最喜歡的交易系統中
Parabolic SAR & Support/Resistance Levels는 외환 거래에서 잠재적인 추세 반전과 진입 및 종료 지점을 식별하는 데 사용되는 기술 분석 지표일 뿐만 아니라 기성 자율 거래 전략이기도 합니다. 이 지표는 PSAR 지표를 기반으로 차트에 동적 지원 및 저항 수준을 추가하여 트레이더가 시장이 잠재적으로 반전될 수 있는 주요 가격 수준을 식별하는 데 도움이 될 수 있습니다. 이 지표를 사용하면 트레이더는 시장의 강점과 방향, 거래의 잠재적인 진입 및 종료 지점에 대한 통찰력을 얻을 수 있습니다. Parabolic SAR & Support/Resistance Levels 지표는 차트에 다양한 Parabolic Support and Resistance(PSAR) 수준을 표시하여 트레이더에게 잠재적인 추세 반전 신호를 제공하는 기술 분석 도구입니다. 이 지표는 MT4 차트 창에 수평으로 정렬된 일련의 선으로 표시되어 트레이더가 실제 PSAR 수준을 쉽게 식별할
All Market Channels
Irina Cherkashina
The All Market Channels indicator from ProfRobotrading automatically builds and displays all formed trading channels on the screen. This indicator is very convenient for trading on all existing channel strategies and is applicable to all instruments and timeframes.  Look at the screenshot - it will tell you more :) More information is available on our website ProfRoboTrading. ProfRobotrading의 All Market Channels 지표는 모든 형성된 거래 채널을 자동으로 구축하여 화면에 표시합니다. 이 지표는 모든 기존 채널 전략에서 거래하는 데 매우 편리하며 모든 상품과
This is a Bollinger Bands Compression indicator. It detects volatility compression and the release of “suppressed momentum.” It can be used when it coincides with any specific trading entries — released volatility means a higher probability of making a decent profit. There is also a histogram with colored bands symbolizing weakness or strength, and a zero line crossover. Therefore, this indicator can be used both in conjunction with other indicators within trading strategies, and on its own meri
필터:
리뷰 없음
리뷰 답변